. 2020 Jul 1;37(13):1574-1586.
doi: 10.1089/neu.2019.6537. Epub 2020 Apr 2.

Penetrating Traumatic Brain Injury Triggers Dysregulation of Cathepsin B Protein Levels Independent of Cysteine Protease Activity in Brain and Cerebral Spinal Fluid

Affiliations

Penetrating Traumatic Brain Injury Triggers Dysregulation of Cathepsin B Protein Levels Independent of Cysteine Protease Activity in Brain and Cerebral Spinal Fluid

Angela M Boutté et al. J Neurotrauma. .

Abstract

Cathepsin B (CatB), a lysosomal cysteine protease, is important to brain function and may have dual utility as a peripheral biomarker of moderate-severe traumatic brain injury (TBI). The present study determined levels of pro- and mature (mat) CatB protein as well as cysteine protease activity within the frontal cortex (FC; proximal injury site), hippocampus (HC; distal injury site), and cerebral spinal fluid (CSF) collected 1-7 days after craniotomy and penetrating ballistic-like brain injury (PBBI) in rats. Values were compared with naïve controls. Further, the utility of CatB protein as a translational biomarker was determined in CSF derived from patients with severe TBI. Craniotomy increased matCatB levels in the FC and HC, and led to elevation of HC activity at day 7. PBBI caused an even greater elevation in matCatB within the FC and HC within 3-7 days. After PBBI, cysteine protease activity peaked at 3 days in the FC and was elevated at 1 day and 7 days, but not 3 days, in the HC. In rat CSF, proCatB, matCatB, and cysteine protease activity peaked at 3 days after craniotomy and PBBI. Addition of CA-074, a CatB-specific inhibitor, confirmed that protease activity was due to active matCatB in rat brain tissues and CSF at all time-points. In patients, CatB protein was detectable from 6 h through 10 days after TBI. Notably, CatB levels were significantly higher in CSF collected within 3 days after TBI compared with non-TBI controls. Collectively, this work indicates that CatB and its cysteine protease activity may serve as collective molecular signatures of TBI progression that differentially vary within both proximal and distal brain regions. CatB and its protease activity may have utility as a surrogate, translational biomarker of acute-subacute TBI.

Keywords: biomarkers; cathepsin B; clinical TBI; cysteine protease; head trauma; penetrating ballistic-like brain injury; translational rodent models; traumatic brain injury.


Conflict of interest statement

V. Hook, G. Hook, and S. Jacobsen have equity positions and G. Hook and S. Jacobsen are employed by American Life Science Pharmaceuticals, Inc. V. Hook's conflict has been disclosed and is managed by her employer, the University of California, San Diego. The other authors have no conflicts of interest.

Figures

FIG. 1.
FIG. 1.
Study design. (A) Timeline of experimental TBI in rats. Individual cohorts (n = 6–10 rats per group and time-point) were subjected to either craniotomy or PBBI. The composite neuroscore was determined at acute (30 min) and at terminal (1, 3, or 7 days) end-points after injury. (B) Schema of biochemical outcome metrics studied after experimental TBI in rats. Biological samples were derived from individual cohorts of rats subjected to craniotomy or PBBI as described in (A) or from naïve animals (n = 6) without surgical procedures or neuroscore assessment. Frontal cortex, hippocampus, and CSF was collected and analyzed for cathepsin B content using western blotting. Cysteine protease enzyme activity was determined in the absence or presence of CA-074 (cathepsin B-specific inhibitor). (C) Study design for reporting of demographic information, assessment of the Marshall CT Scale and Glasgow Coma Scale scores, and collection of CSF from patients with severe TBI compared with controls. Cathepsin B protein levels were measured in CSF using western blotting. CT, computed tomography; CSF, cerebrospinal fluid; PBBI, penetrating ballistic-like brain injury; TBI, traumatic brain injury.
FIG. 2.
FIG. 2.
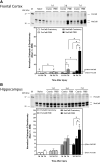
Cathepsin B protein levels in rat brain after TBI. Pro- (ProCatB) and mature cathepsin B (MatCatB) protein levels were determined in (A) frontal cortex or (B) hippocampus isolated at 1, 3, or 7 days after injury. Representative western blots are indicated for each brain region and sample (5 μg/lane). ProCatB (∼37 kDa) and MatCatB are (20–25 kDa). Lanes designated for the molecular weight marker are noted as “M.” Relative quantitation of densitometric signals is shown below each western blot image. Data are displayed as the mean ± SEM for craniotomy (ProCatB, white bars; MatCatB, light gray bars) or for PBBI (ProCatB, dark gray bars; MatCatB, black bars) at each time-point. Levels of ProCatB (dotted line, mean = 1) and MatCatB (solid line) are indicated for naïve controls. Statistically significant values are indicated (#p ≤ 0.05 injury vs. naïve control, *p ≤ 0.05 craniotomy vs. PBBI, ANOVA with the Tukey multiple comparisons post-test). ANOVA, analysis of variance; PBBI, penetrating ballistic-like brain injury; SEM, standard error of the mean; TBI, traumatic brain injury.
FIG. 3.
FIG. 3.
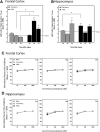
Cysteine protease activity in rat brain after TBI. (A) Frontal cortex or (B) hippocampus cysteine protease activity in clarified lysates isolated from rats 1, 3, or 7 days after injury. Quantitative enzyme activity determined based on cleavage of the substrate, FR-AMC, in the absence of protease inhibitors using 10 μg total protein from clarified lysates isolated at 1, 3, or 7 days after injury. Post-injury time (x axis, days) compared with rate of AMC generated (y axis, [μM]/10 min reaction ± SEM/per 10 μg protein) is displayed for craniotomy (gray bars) and PBBI (black bars). Naïve controls are indicated (mean = solid line). Statistically significant comparisons are shown. (C) Frontal cortex or (D) hippocampal cysteine protease activity inhibition in the presence of 10 μg clarified lysates with CA-074. The percentage of inhibition was derived from AMC generated without CA-074, as in A and B. Naïve controls, craniotomy, and PBBI cohorts were analyzed independently and scaled to level of AMC generated in each reaction (no inhibitor = 0% normalized inhibition). Data are shown for samples isolated 1 day (left), 3 days (center), or 7 days (right) in samples isolated from naïve controls (closed gray squares), craniotomy (open circles), or PBBI (closed circles). The concentration of CA-074 used is displayed (x axis, range: 10–1000 nM) compared wtih the percentage (%) of inhibition of cysteine protease activity(y axis, mean ± SEM). Significant differences in % inhibition are indicated (#p ≤ 0.05, injury vs. naïve control; *p ≤ 0.05, craniotomy vs. PBBI, ANOVA, and Tukey post-test). ANOVA, analysis of variance; FR-AMC, z-Phe-Arg-amino-methyl coumarin; PBBI, penetrating ballistic-like brain injury; SEM, standard error of the mean; TBI, traumatic brain injury.
FIG. 4.
FIG. 4.
Cathepsin B protein and cysteine protease activity in rat CSF after TBI. (A) Representative western blots of cathepsin B in CSF collected from naïve controls or from craniotomy or PBBI injured rats at 1 day (top), 3 days (center), or 7 days (bottom). Recombinant rat CatB standards [range: 2.55 ng/lane] and the molecular weight markers (M) are indicated for each blot. Numbered tick-marks signify (–1) ProCatB, (–2) MatCatB. (B) Quantitation of proCatB and MatCatB based on densitometry. Data are displayed as the mean ± SEM for craniotomy (ProCatB, white bars; MatCatB, light gray bars) or PBBI (ProCatB, dark gray bars; MatCatB, black bars). Naïve controls are indicated for ProCatB (dotted line, mean = 1) and MatCatB (solid line). (C) Quantitative enzyme activity determined in CSF isolated at 1, 3, or 7 days after injury. Post-injury time (x axis, days) compared with FR-AMC generated (y axis, mean ± SEM AMC μM/60 min reaction/1.25 μL final volume × 40 [dilution factor]) is displayed for craniotomy (gray bars) and PBBI (black bars). Activity derived from naïve controls is indicated (solid line). (D) Inhibition of cysteine protease activity CSF collected 1 day, 3 days, or 7 days after craniotomy (gray bars) or PBBI (black bars). Inhibition of cysteine protease activity was determined after incubation with 1 nM of CA-074 (x axis) and is displayed as the percent (%) of inhibition compared with the reaction without CA-074 (0%) as in C. Inhibition within CSF from naïve controls is indicated (solid line). Statistically significant values are indicated (#p ≤ 0.05 injury vs. naïve control, *p ≤ 0.05 craniotomy vs. PBBI, ANOVA with the Tukey multiple comparisons post-test). ANOVA, analysis of variance; CSF, cerebrospinal fluid; FR-AMC, z-Phe-Arg-amino-methyl coumarin; PBBI, penetrating ballistic-like brain injury; SEM, standard error of the mean; TBI, traumatic brain injury.
FIG. 5.
FIG. 5.
Neurological deficits, cathepsin B protein levels, and protease activity in PBBI rats. The composite neuroscore determined from individual cohorts determined at acute (30 min, white bars) or terminal (1, 3, or 7 days, black bars) time-points after PBBI (mean ± SEM) (*p ≤ 0.05, two-way ANOVA with Fisher's LSD post-test). Craniotomy-injured cohorts have a null (“0”) neuroscore value (not shown). ANOVA, analysis of variance; LSD, least significant difference; PBBI, penetrating ballistic-like brain injury; SEM, standard error of the mean.
FIG. 6.
FIG. 6.
CSF cathepsin B protein levels among patients with TBI. (A) Exemplary western blot image of non-activated pro-cathepsin B (38–40 kDa) in CSF compared with recombinant human protein is indicated. Lane 1–3: TBI patients BYLR 2681, 2715, and 3982, respectively. Lane 4: 100 ng of recombinant human cathepsin B. (B) Western blots of cathepsin B detected in CSF collected from patient 1 (top), patient 2 (middle), and patient 3 (bottom) within hours (h) or days (d) after TBI. Lane “C” is the non-TBI control. (C) Semi-quantitative densitometry of pro-cathepsin B in CSF derived from controls (open circles) or patients with penetrating TBI (closed circles) within 3 days (≤3 d) of injury (*p ≤ 0.05 TBI vs. control, two-tailed t-test with Welch's correction). CSF, cerebrospinal fluid; TBI, traumatic brain injury.

References

    1. Stocchetti N., and Zanier E.R. (2016). Chronic impact of traumatic brain injury on outcome and quality of life: a narrative review. Crit Care 20, 148. - PMC - PubMed
    1. Brickell T.A., Lange R.T., and French L.M. (2014). Three-year outcome following moderate-to-severe tbi in US military service members: a descriptive cross-sectional study. Military Med. 179, 839–848 - PubMed
    1. Orman J.A., Geyer D., Jones J., Schneider E.B., Grafman J., Pugh M.J., and DuBose J. (2012). Epidemiology of moderate-to-severe penetrating versus closed traumatic brain injury in the Iraq and Afghanistan wars. J. Trauma Acute Care 73, S496–S502 - PubMed
    1. Schulz-Heik R.J., Poole J.H., Dahdah M.N., Sullivan C., Date E.S., Salerno R.M., Schwab K., and Harris O. (2016). Long-term outcomes after moderate-to-severe traumatic brain injury among military veterans: successes and challenges. Brain Inj. 30, 271–279 - PubMed
    1. Milton J., Rugino A., Narayan K., Karas C., and Awuor V. (2017). A case-based review of the management of penetrating brain trauma. Cureus 9, e1342. - PMC - PubMed

Publication types

MeSH terms