. 2020 Mar 5;10(3):1113-1124.
doi: 10.1534/g3.119.400968.

Multi-trait Genomic Prediction Model Increased the Predictive Ability for Agronomic and Malting Quality Traits in Barley (Hordeum vulgare L.)

Affiliations

Multi-trait Genomic Prediction Model Increased the Predictive Ability for Agronomic and Malting Quality Traits in Barley (Hordeum vulgare L.)

Madhav Bhatta et al. G3 (Bethesda). .

Abstract

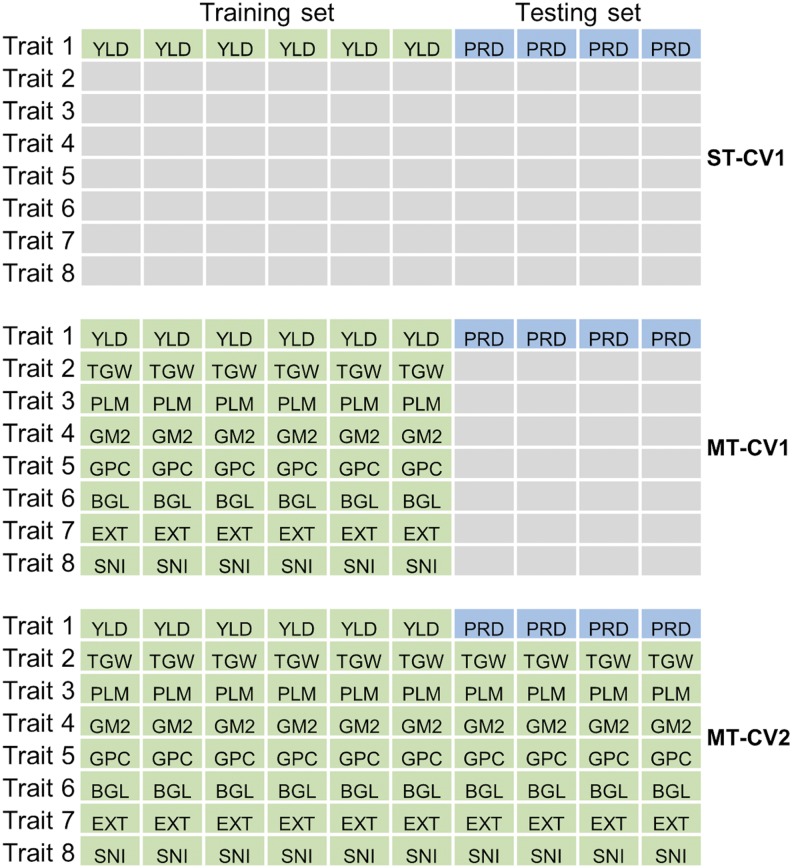
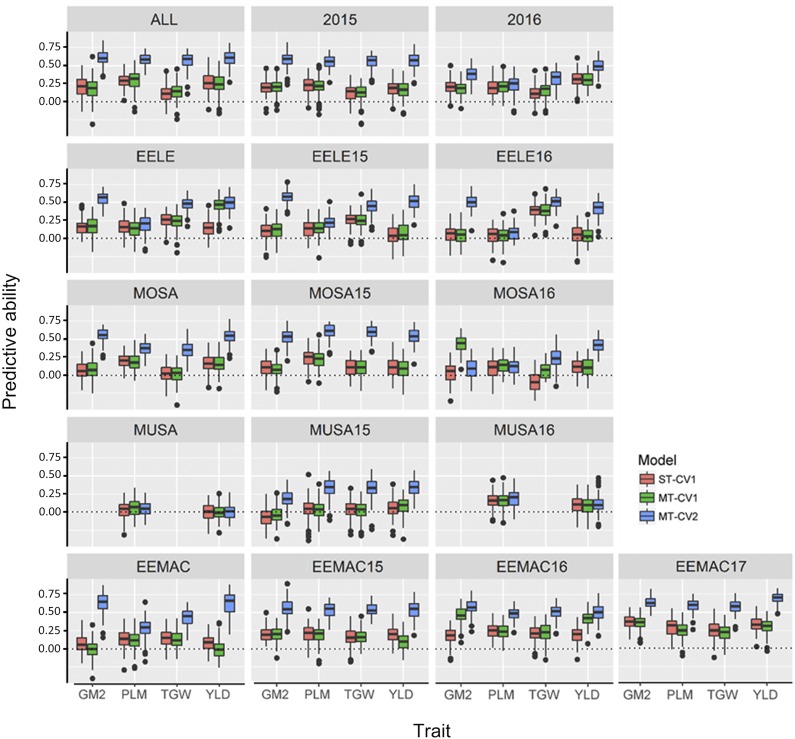
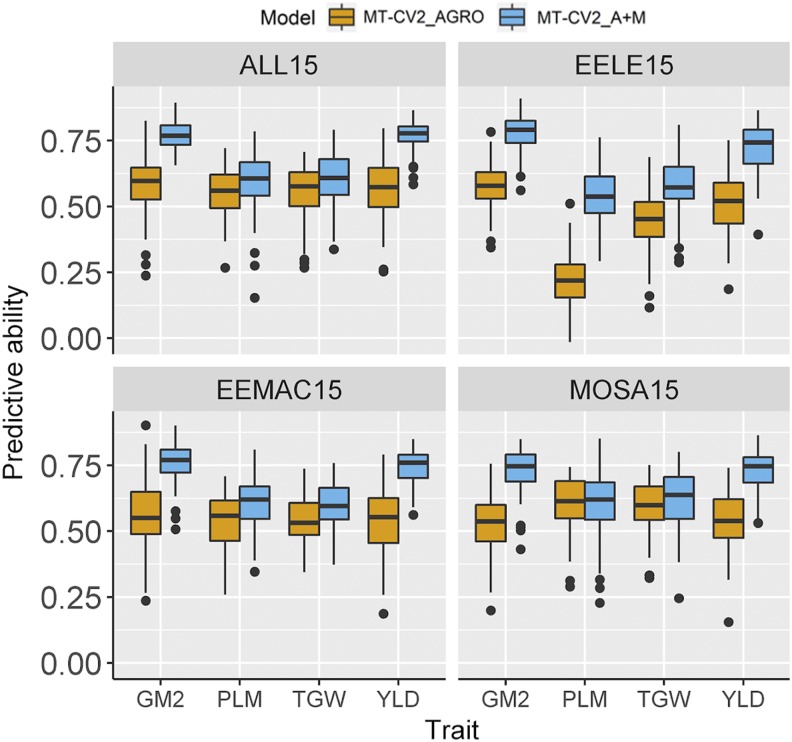
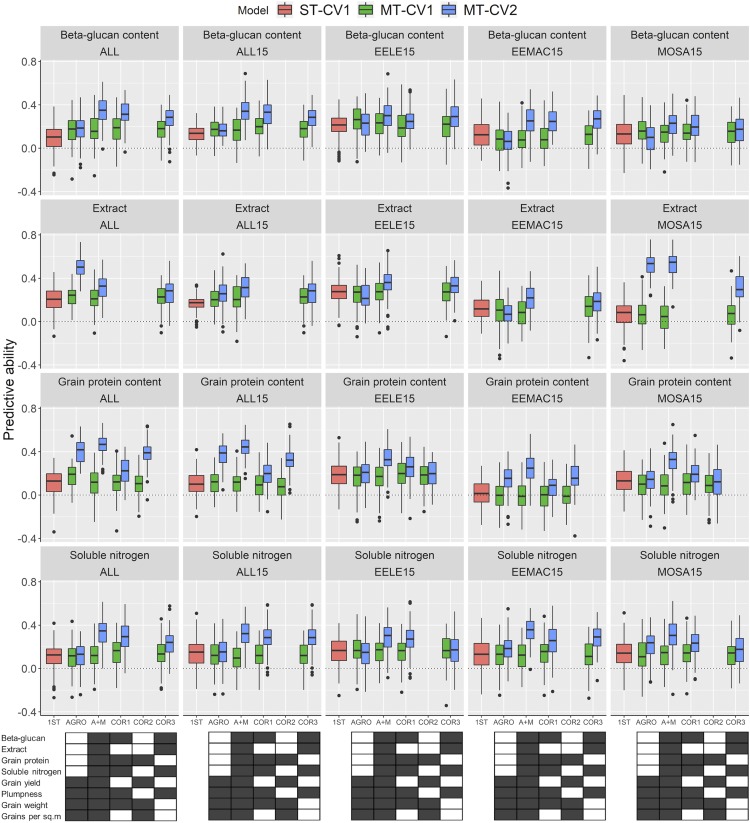
Plant breeders regularly evaluate multiple traits across multiple environments, which opens an avenue for using multiple traits in genomic prediction models. We assessed the potential of multi-trait (MT) genomic prediction model through evaluating several strategies of incorporating multiple traits (eight agronomic and malting quality traits) into the prediction models with two cross-validation schemes (CV1, predicting new lines with genotypic information only and CV2, predicting partially phenotyped lines using both genotypic and phenotypic information from correlated traits) in barley. The predictive ability was similar for single (ST-CV1) and multi-trait (MT-CV1) models to predict new lines. However, the predictive ability for agronomic traits was considerably increased when partially phenotyped lines (MT-CV2) were used. The predictive ability for grain yield using the MT-CV2 model with other agronomic traits resulted in 57% and 61% higher predictive ability than ST-CV1 and MT-CV1 models, respectively. Therefore, complex traits such as grain yield are better predicted when correlated traits are used. Similarly, a considerable increase in the predictive ability of malting quality traits was observed when correlated traits were used. The predictive ability for grain protein content using the MT-CV2 model with both agronomic and malting traits resulted in a 76% higher predictive ability than ST-CV1 and MT-CV1 models. Additionally, the higher predictive ability for new environments was obtained for all traits using the MT-CV2 model compared to the MT-CV1 model. This study showed the potential of improving the genomic prediction of complex traits by incorporating the information from multiple traits (cost-friendly and easy to measure traits) collected throughout breeding programs which could assist in speeding up breeding cycles.

Keywords: GenPred; Genomic Prediction; Multi-trait; Shared Data Resources; genomic prediction; grain yield, grain quality; malting quality; multi-environment.


Figures

Figure 1
Figure 1
Prediction scheme for the single trait (ST) and multi-trait (MT) genomic prediction models with two cross-validation schemes (CV1 and CV2) used in this study. ST-CV1 model: single trait prediction model with cross-validation scheme 1 where a trait (e.g., grain yield; YLD) is predicted at a time; we used 60% of individuals as the training set (phenotyped and genotyped, light green) and 40% of the individuals as the testing set (genotyped only, light blue with PRD code for the trait to be predicted, yield as an example here). MT-CV1 model: multi-trait prediction model with cross-validation scheme 1 for new un-phenotyped individuals; we used 60% of individuals as the training set (phenotyped for all traits and genotyped; light green) and 40% of the individuals as the testing set (genotyped but not phenotyped for any trait; light blue with PRD code for the trait to be predicted, yield as an example here). MT-CV2 model: multi-trait prediction model with cross-validation scheme 2 where 100% of the information from other traits are available for the individuals to be predicted; we used 60% of individuals as the training set (phenotyped for all traits and genotyped; light green) and 40% of the individuals as the testing set (phenotyped for associated traits but not for the targeted traits, and genotyped; light blue with PRD code for the trait to be predicted, yield as an example here). Rectangles represent genotypes and colors represent whether the phenotypic information was used (light green) or not (light blue with PRD code for the trait to be predicted, yield as an example here) for the population. Similar scheme was applied for predicting thousand grain weight (TGW), grain plumpness (PLM), number of grains per square meter (GM2), protein content (GPC), beta-glucan content (BGL), malt extract (EXT), and soluble nitrogen (SNI) where PRD was used for TGW, PLM, GM2, GPC, BGL, EXT and SNI one at a time.
Figure 2
Figure 2
Genetic correlation between agronomic and malting quality traits using best linear unbiased estimates from combining three experiments (EEMAC, EELE, and MOSA) conducted in 2015. Numbers in bold indicate a correlation significantly different from zero at an alpha level of 0.05. BGL, beta-glucan content; EXT, malt extract; GM2, number of grain m-2; PLM, grain plumpness; TGW, thousand grain weight; GPC, grain protein content; SNI, soluble nitrogen; and YLD, grain yield.
Figure 3
Figure 3
Principal component analysis showing the association between agronomic and malting quality traits. BGL, beta-glucan content; EXT, malt extract; GM2, number of grains per square meter; PLM, grain plumpness; TGW, thousand grain weight; GPC, grain protein content; SNI, soluble nitrogen; and YLD, grain yield. PVE: Proportion of the variance explained by each trait.
Figure 4
Figure 4
Box plots showing the predictive ability for grain yield (YLD), plumpness (PLM), thousand grain weight (TGW), and number of grains per square meter (GM2) using single trait (ST) and multi-trait (MT) models from individual experiments (EELE15, EELE16, EEMAC15, EEMAC16, EEMAC17, MOSA15, MOSA16, MUSA15, and MUSA16), experiments across locations (EELE, EEMAC, MOSA, and MUSA), years (2015, 2016, and 2017), and all experiments combined (ALL). CV1, predicting new lines with genotypic information only and CV2, predicting partially phenotyped lines by using genotypic and phenotypic information from all traits from individuals in the training set, and genotypic and correlated phenotypic traits in the testing set.
Figure 5
Figure 5
Boxplots showing the predictive ability for grain yield (YLD), plumpness (PLM), thousand grain weight (TGW), and number of grains square meter (GM2) using single trait (ST) and multi-trait (MT) models from 2015 experiments conducted in three locations (EELE, EEMAC, and MOSA). ALL15, three combined experiments of the year 2015; CV2, predicting partially phenotyped lines by using genotypic and phenotypic information from all traits from individuals in the training set, and genotypic and phenotypic information from other correlated traits in the testing set.; The correlated traits were: AGRO, agronomic traits (YLD, PLM, TGW, and GM2); or A+M, agronomic and malting quality traits (beta-glucan content, malt extract, protein content, and soluble nitrogen).
Figure 6
Figure 6
Box plots showing the predictive ability for malting quality traits using single trait (ST) and multi-trait (MT) prediction models for the experiments conducted in 2015 in three locations (EELE, EEMAC, and MOSA) and for the combined experiments in 2015 (ALL15) and all (ALL). ALL, agronomic traits from all nine experiments combined and malting traits from the ALL15; CV1, predicting new lines with genotypic information only; and CV2, predicting partially phenotyped lines by using genotypic and phenotypic information from all traits from individuals in the training set, and genotypic and phenotypic information from other correlated traits in the testing set. Predicted traits were: beta-glucan content; malt extract; protein content; and soluble nitrogen; ST represents single trait, AGRO, agronomic traits (grain yield, plumpness, thousand grain weight, and number of grains per square meter) and trait of interest for multi-trait prediction model; A+M, agronomic and malting quality traits; COR1, denotes correlated traits which are soluble nitrogen, thousand grain weight, beta-glucan content, plumpness, and grain protein content; COR2, denotes traits within principal component 1 (PC1), which are grain yield, thousand grain weight, number of grains per square meter, and grain protein content; COR3, traits within PC2 which are beta-glucan content, plumpness, soluble nitrogen, and extract. Treatment combinations were shown in a 5 × 8 rectangle figure where each small rectangle with colors represent the presence (black) or absence (white) of phenotypic information used in the prediction model.

References

    1. Belamkar V., Guttieri M.J., Hussain W., Jarquín D., El-basyoni I., et al. . 2018. Genomic Selection in Preliminary Yield Trials in a Winter Wheat Breeding Program. G3:(Bethesda), 8: 2735. 10.1534/g3.118.200415 - DOI - PMC - PubMed
    1. Berro I. M., Lado B., Nalin R. S., Quincke M., and Gutierrez L., 2019. Training population optimization for genomic selection. Plant Genome 12: 190028 10.3835/plantgenome2019.04.0028 - DOI - PubMed
    1. Bertholdsson N. O., 1999. Characterization of malting barley cultivars with more or less stable grain protein content under varying environmental conditions. Eur. J. Agron. 10: 1–8. 10.1016/S1161-0301(98)00043-4 - DOI
    1. Bhatta M., Baenziger P., Waters B., Poudel R., Belamkar V. et al. , 2018a Genome-wide association study reveals novel genomic regions associated with 10 grain minerals in synthetic hexaploid wheat. Int. J. Mol. Sci. 19: 3237 10.3390/ijms19103237 - DOI - PMC - PubMed
    1. Bhatta M., Morgounov A., Belamkar V., and Baenziger P., 2018b Genome-wide association study reveals novel genomic regions for grain yield and yield-related traits in drought-stressed synthetic hexaploid wheat. Int. J. Mol. Sci. 19: 3011 10.3390/ijms19103011 - DOI - PMC - PubMed

Publication types

LinkOut - more resources