. 2020 Feb 14;367(6479):eaaw3381.
doi: 10.1126/science.aaw3381. Epub 2020 Jan 23.

Lineage tracing on transcriptional landscapes links state to fate during differentiation

Affiliations

Lineage tracing on transcriptional landscapes links state to fate during differentiation

Caleb Weinreb et al. Science. .

Abstract

A challenge in biology is to associate molecular differences among progenitor cells with their capacity to generate mature cell types. Here, we used expressed DNA barcodes to clonally trace transcriptomes over time and applied this to study fate determination in hematopoiesis. We identified states of primed fate potential and located them on a continuous transcriptional landscape. We identified two routes of monocyte differentiation that leave an imprint on mature cells. Analysis of sister cells also revealed cells to have intrinsic fate biases not detectable by single-cell RNA sequencing. Finally, we benchmarked computational methods of dynamic inference from single-cell snapshots, showing that fate choice occurs earlier than is detected by state-of the-art algorithms and that cells progress steadily through pseudotime with precise and consistent dynamics.


Figures

Figure 1:
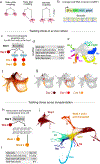
Figure 1:. Tracking clones over hematopoietic differentiation.
(a) Experimental designs for tracking differentiation dynamics by analysis of sister cells. (b) The LARRY lentiviral construct delivers an expressed, heritable barcode that is detectable using scSeq. (c) Experiment tracking hematopoietic progenitor clones over time in primary culture. Colored circles indicate samples collected for scSeq. (d) Numbers of cells and clones sampled. (e) Annotated SPRING plot of transcriptomes from all time points [Ly=lymphoid precursor, Mk=megakaryocyte, Er=erythrocyte, Ma=mast cell, Ba=basophil, Eos=eosinophil, Neu=neutrophil, Mo=monocyte, DC=dendritic cell, migDC=migratory (ccr7+) DC, pDC=plasmacytoid DC]. (f) SPRING plot colored by time point at which cells were profiled. (g) Examples of clonal dynamics on the single cell landscape. Each plot shows a separate clone, with cells colored by time point and overlaid on the full dataset in gray. (h) Experiment tracking clones after transplantation into 10 mice. Colored circles as in (c). (i) Numbers of cells and clones sampled. (j) scSeq data prior to transplantation (top-left) and post-transplantation (bottom-right), plotted as in (e) (T=T cell, B=B cell, NK=NK cell, MPP=multipotent progenitor).
Figure 2:
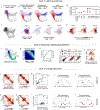
Figure 2:. Linking state to fate in early hematopoiesis.
(a-b) Sister cells at day 2 are transcriptionally similar as seen (a) by example (each color shows one clone), and (b) by the probability of sister cells occupying the same, or neighboring, transcriptional clusters. (c) Day 2 cells (colored dots) are colored by the fate of their mature sisters observed at a later time in vitro. Outlined regions of the SPRING plot indicate the respective fates. (d) Location of progenitors (colored dots) with two fates among their sisters at later time points. (e) Gene expression domains of day 2 cells guides selection of early progenitors for further analysis. (f) Early progenitors colored by the fraction of sisters in each fate at days 4–6 in culture. (g) Volcano plots identify genes enriched among early progenitors for each lineage. Labeled genes shown red. (h-i) Detection of early progenitor gene expression associated with future fates post-transplantation, repeating analyses from e-g. In (e,f,h,i) points with non-zero value are plotted on top.
Figure 3:
Figure 3:. Stochasticity and hidden variables from scSeq data.
(a,b) Machine learning partially predicts clonal fate from the transcriptional state of early progenitors in vitro and in vivo. (Accuracy = fraction correct assignments). Asterisk (*) indicates statistical significance (𝑝𝑝<10−4), N.S.=not significant. Error-bars indicate standard deviation. (c, f) Split-well and mouse experiments testing for heritable properties that influence fate choice but are not detectable by scSeq. Hidden heritable properties are implicated if cell fate outcomes are better predicted by the late (day 6 in vitro, 1 week in vivo) state of an isolated sister cell, as compared to the early (day 2) state of a sister. (d,g) Clonal fate distributions for sisters split into different wells or different mice and profiled on day 6. Each row across both heatmaps is a clone; color indicates the proportion of the clone in each lineage in the respective wells. Example clones are shown on the right as red dots on SPRING plots. (e,h) Fate prediction from late isolated sisters is more accurate than early prediction for different machine learning methods [naïve Bayes (NB), k-nearest neighbor (KNN), random forest (RF), multilayer perceptron (MLP)]. Error bars: standard deviation across 100 partitions of the data into training and testing sets. (i) A split-well test for committed cells by sampling clones both on day 2 and in two separate wells on day 6. Clones emerging from pure multipotent states will show statistically independent fate outcomes in two wells (left), contrasting with committed clones (right). (j) scSeq SPRING plots showing early progenitors (day 2), colored by fates of sisters isolated in separate wells (white dots indicate ‘mixed clones’ with distinct fate outcomes). For each fate decision, the observed frequency of mixed clones falls short of that predicted for uncommitted progenitors, even for clusters most enriched for mixed clones (bottom panels). (k,l) Plot of predicted vs. observed frequency of mixed clones. Points on the diagonal correspond to independent stochastic fate choice; points above the diagonal to asymmetric sister cell fate; and points below the diagonal to fate priming or pre-commitment. For all fate choices studied, fate priming or pre-commitment is inferred.
Figure 4:
Figure 4:. Multiple paths of monocyte differentiation.
(a) Differentiating monocytes show opposing expression of neutrophil and DC markers. Raw expression values are plotted with points ordered by expression level. (b) Monocytes segregate by proportions of neutrophil and DC sisters. Only monocytes for which clonal data was available are shown. Plots show raw unsmoothed values from cells with clonal data. Points with the highest value are plotted on top. (c) Early (day 2) progenitors whose sisters differentiate into neutrophil-like or DC-like monocytes occupy distinct transcriptional states. Plot as in Fig. 2c. (d,e) Volcano plots identifying differentially-expressed genes between (d) the progenitors of, and (e) mature DC-like and neutrophil-like monocytes. (f) Barcodes overlap between cell-types indicates monocyte-DC and monocyte-neutrophil coupling one week post-transplantation. (g) Genes differentially expressed between monocytes related to neutrophils or to DCs after transplantation. (h) Signature scores (average of Z-scored expression) shown on a SPRING plot of post-transplantion monocytes. Points are ordered by expression level. (i) A DC-to-neutrophil axis of gene expression persists in mature monocytes, as seen by SPRING plots of scSeq data from monocytes in mouse bone marrow (top) and human blood (bottom). (j-m) Clonal analysis of monocyte differentiation in unperturbed hematopoiesis. (j) Under a model of two different monocyte differentiation pathways, Neu-DC-Mo clones should be depleted relative to the null expectation. (k) Experimental schematic for barcoding mouse bone marrow in situ with clonal cell type composition assayed after a 12-week chase. (l) The number of cells in each type detected per clone (rows). (m) Observed vs. independent expectation for Mo-Neu-DC clones is consistent with two monocyte ontogenies.
Figure 5:
Figure 5:. A benchmark for dynamic inference from scSeq data.
(a) SPRING plot of neutrophil/monocyte differentiation, with progenitors (day 2) colored by the ratio of neutrophil vs. monocyte fate of their sisters (days 4–6). (b) Algorithmic predictions of neutrophil vs. monocyte fate from transcription alone fail to recognize the early fate boundary revealed by clonal tracking. (c) Expanded view of early progenitors (thresholded by CD34 expression); plots as in (a,b). (d) Pearson correlation between future clonal fate outcomes of early progenitors and (I) smoothed fate probabilities of held-out clonal data, (II) output of algorithmic predictions, (III) expression of top 10 most-correlated genes (red = transcription factors). Held-out data sets the upper bound on accuracy of fate prediction algorithms. (e) Expression of fate-correlated transcription factors in CD34+ progenitors. Points are ordered by expression level. (f) “Pseudotime” ordering of neutrophil differentiation. Dotted lines represent the approximate boundaries in gene expression associated with canonical stages (PMy=promyelocyte; My=myelocyte). (g) Joint distribution of pseudotime of sister cells separated in time by 2 days reveals a consistent forward shift across the trajectory. (h) Pseudotime progression as a function of real time obtained from integration of pseudotime velocity from (g). (i) Pseudotime remains correlated for sister cells cultured in separate wells. (j) Distributions of pseudotime changes show greater variability in MPPs compared to later stages (red=day 2 to 4; orange=day 2 to 6). (k) Clonal-overlap between cell types in culture. The number of shared barcodes between pairs is normalized by expectation if clonal membership is shuffled. (l) State proximity for cell types in culture, represented by graph diffusion distance (connectivity) in a high-dimensional k-nearest-neighbor graph of all data from Fig. 1e. (m) Clonal-overlap across all pairs of lineages correlates with state proximity. (n,o) Inferred differentiation hierarchies assembled by iteratively joining cell types based on the clonal or state distances. Red dots indicate the sole discrepancy between the hierarchies. (p-t) As (k-o) repeated for cells post-transplantation, showing increased discrepancies between clonal and state-based hierarchies.

Comment in

References

    1. Jensen P, Dymecki SM, Essentials of recombinase-based genetic fate mapping in mice. Methods Mol Biol 1092, 437–454 (2014). - PMC - PubMed
    1. Woodworth MB, Girskis KM, Walsh CA, Building a lineage from single cells: genetic techniques for cell lineage tracking. Nat Rev Genet 18, 230–244 (2017). - PMC - PubMed
    1. C. A. Herring, B. Chen, E. T. McKinley, K. S. Lau, Single-Cell Computational Strategies for Lineage Reconstruction in Tissue Systems. Cell Mol Gastroenterol Hepatol 5, 539–548 (2018). - PMC - PubMed
    1. Weinreb C, Wolock S, Tusi BK, Socolovsky M, Klein AM, Fundamental limits on dynamic inference from single-cell snapshots. Proc Natl Acad Sci U S A 115, E2467–E2476 (2018). - PMC - PubMed
    1. Schiebinger G. et al., Optimal-Transport Analysis of Single-Cell Gene Expression Identifies Developmental Trajectories in Reprogramming. Cell 176, 1517 (2019). - PMC - PubMed

Publication types