. 2020 Apr;10(4):536-551.
doi: 10.1158/2159-8290.CD-19-0710. Epub 2020 Jan 23.

Monocytic Subclones Confer Resistance to Venetoclax-Based Therapy in Patients with Acute Myeloid Leukemia

Affiliations

Monocytic Subclones Confer Resistance to Venetoclax-Based Therapy in Patients with Acute Myeloid Leukemia

Shanshan Pei et al. Cancer Discov. 2020 Apr.

Abstract

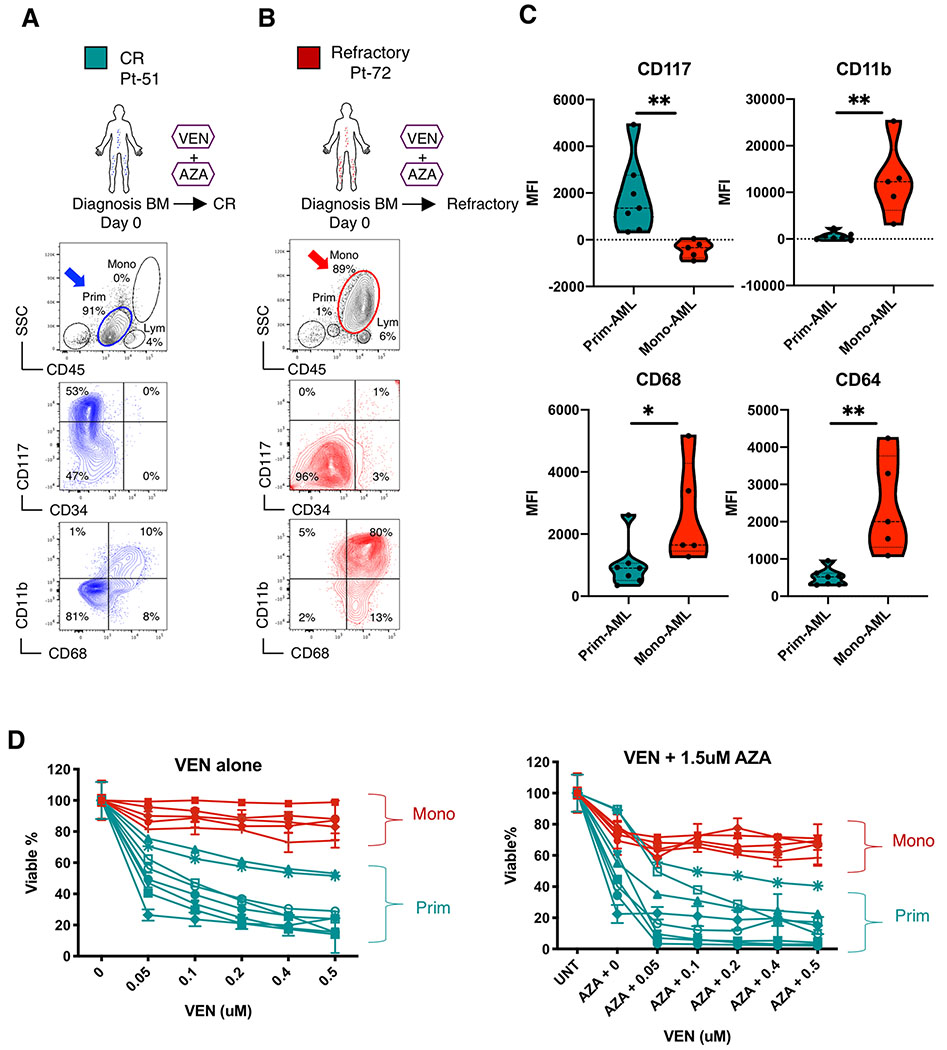
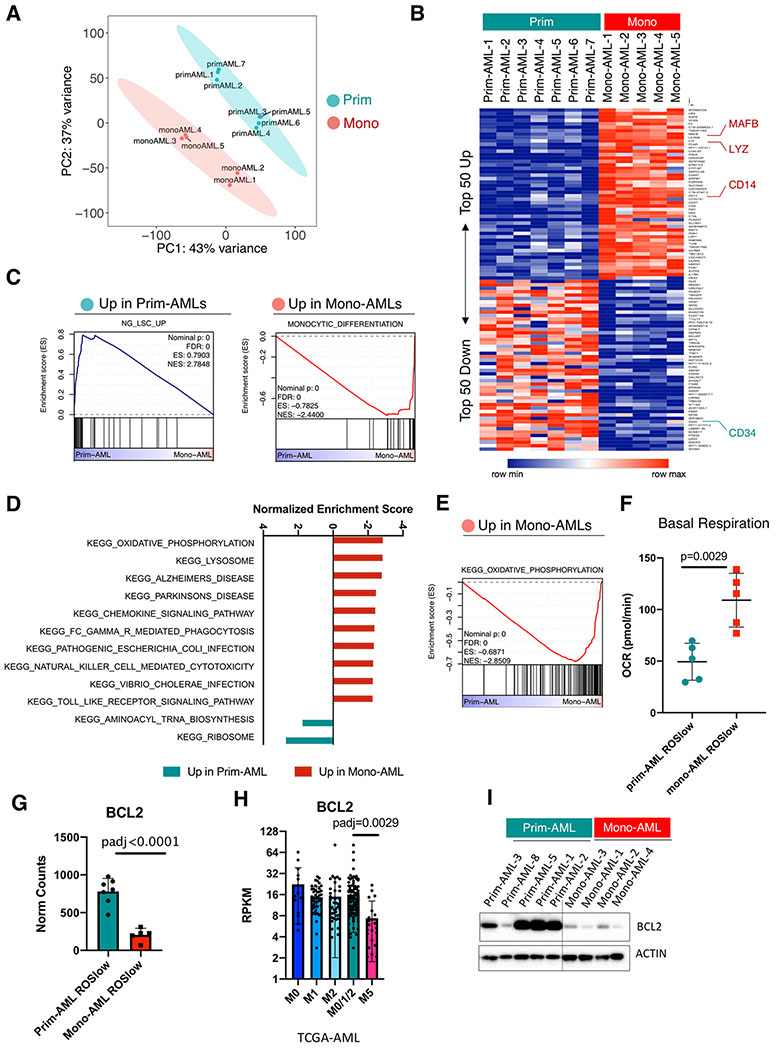
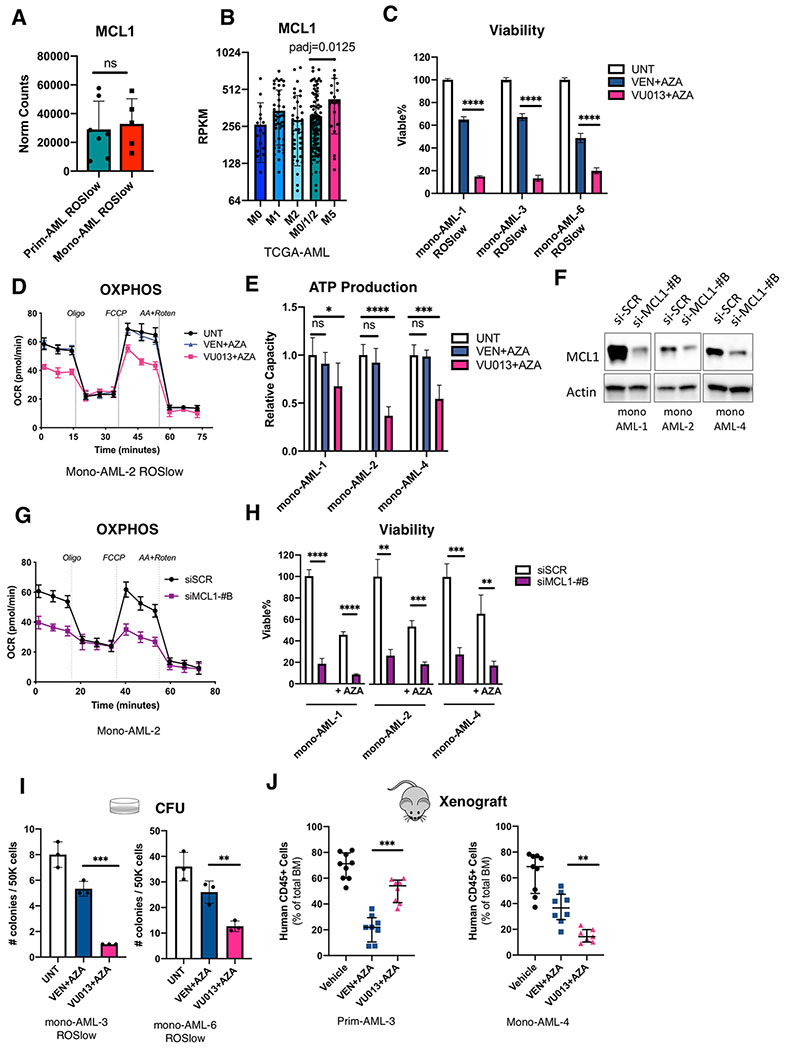
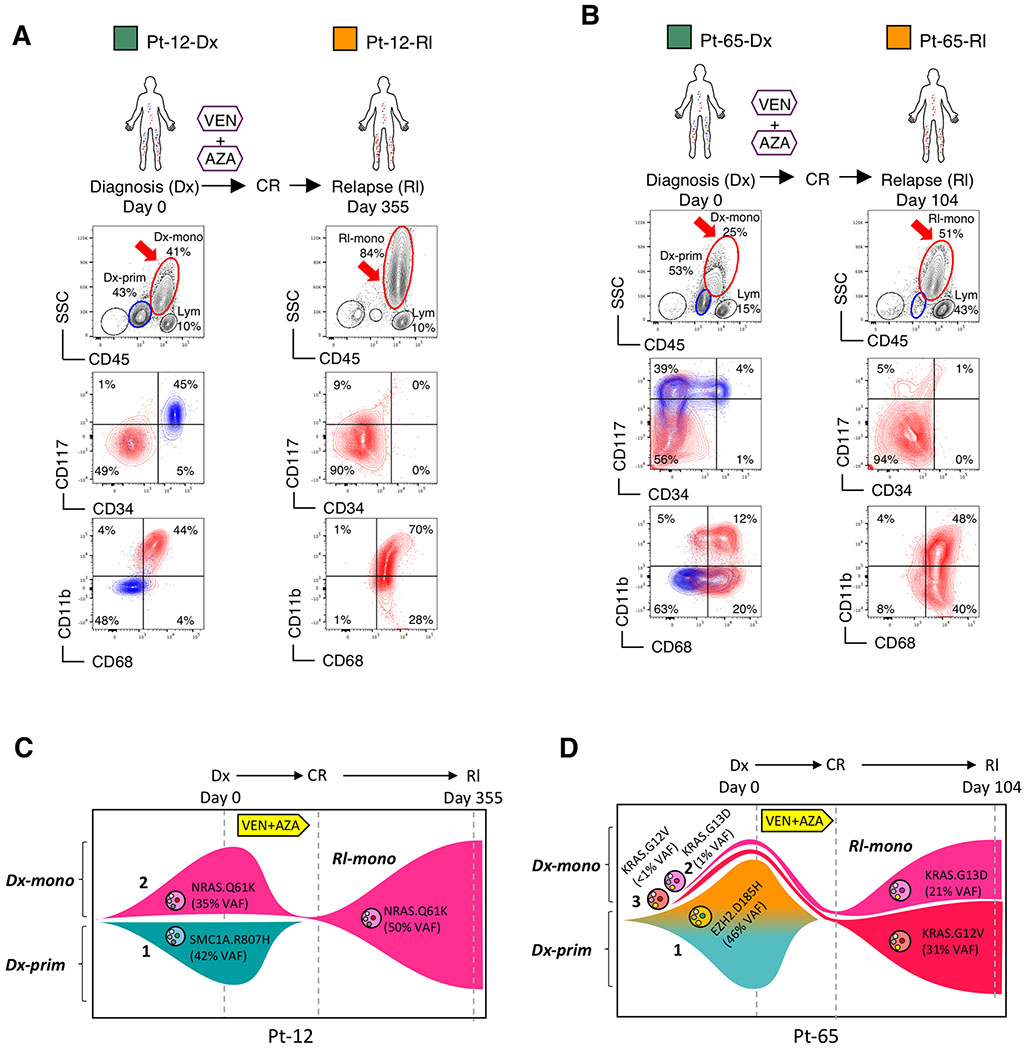
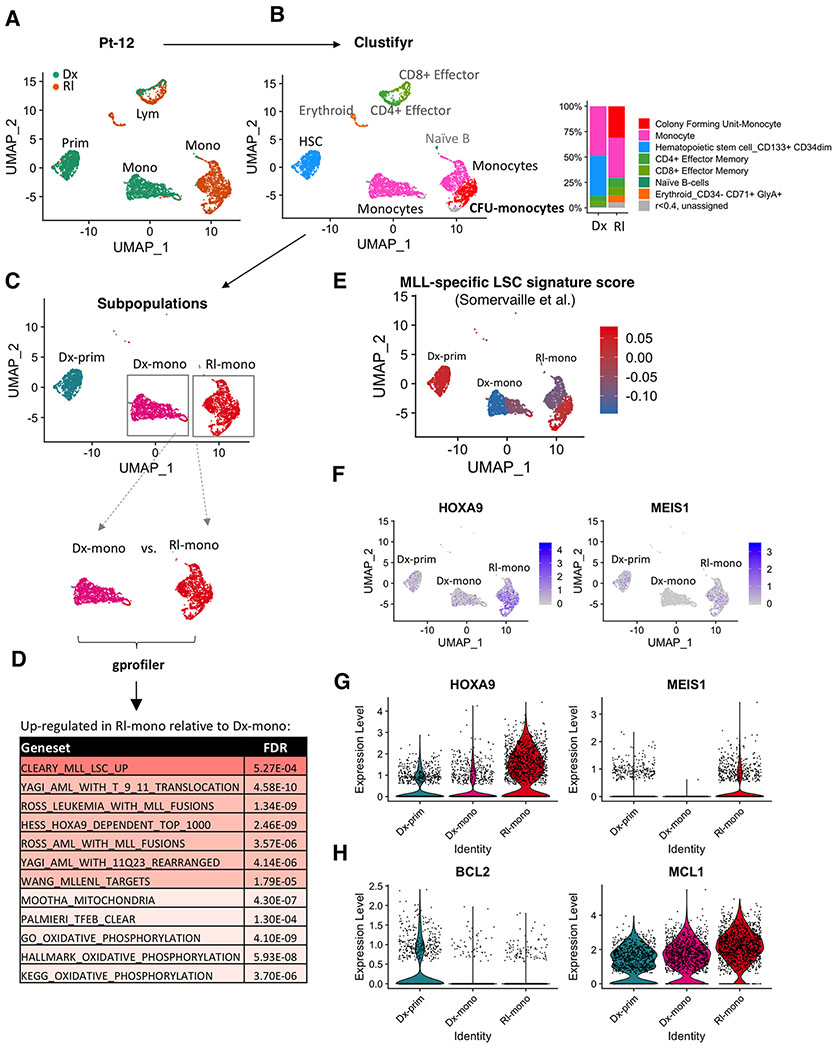
Venetoclax-based therapy can induce responses in approximately 70% of older previously untreated patients with acute myeloid leukemia (AML). However, up-front resistance as well as relapse following initial response demonstrates the need for a deeper understanding of resistance mechanisms. In the present study, we report that responses to venetoclax +azacitidine in patients with AML correlate closely with developmental stage, where phenotypically primitive AML is sensitive, but monocytic AML is more resistant. Mechanistically, resistant monocytic AML has a distinct transcriptomic profile, loses expression of venetoclax target BCL2, and relies on MCL1 to mediate oxidative phosphorylation and survival. This differential sensitivity drives a selective process in patients which favors the outgrowth of monocytic subpopulations at relapse. Based on these findings, we conclude that resistance to venetoclax + azacitidine can arise due to biological properties intrinsic to monocytic differentiation. We propose that optimal AML therapies should be designed so as to independently target AML subclones that may arise at differing stages of pathogenesis. SIGNIFICANCE: Identifying characteristics of patients who respond poorly to venetoclax-based therapy and devising alternative therapeutic strategies for such patients are important topics in AML. We show that venetoclax resistance can arise due to intrinsic molecular/metabolic properties of monocytic AML cells and that such properties can potentially be targeted with alternative strategies.


Conflict of interest statement

Conflict of interest: D.A.P. receives research funding from and serves as an advisor to AbbVie

Figures

Figure 1.
Figure 1.. Monocytic AML is intrinsically resistant to venetoclax + azacitidine.
A, B, Treatment history of Pt-51, Pt-72 and flow analysis of their bone marrow specimens at diagnosis. In the CD45/SSC plots, Mono, Prim and Lym gates indicate monocytic, primitive and lymphocytic subpopulations, respectively. The CD34/CD117 and CD68/CD11b plots show immunophenotype of the gated primitive subpopulations in blue and monocytic subpopulations in red. Arrows highlight populations of interest. Clinical information for these patients is listed in Supplementary Table S1. C, Violin plots showing median fluorescence intensity (MFI) of CD117, CD11b, CD68 and CD64 in mono-AML (N=5) and prim-AML (N=7) quantified by flow cytometry analysis. Each dot represents a unique AML. Mann-Whitney test was used to determine significance. D, Viability of sorted ROSlow LSCs from mono-AML (N=5) and prim-AML (N=7) after 24 hours in vitro treatment with VEN alone or in combination with a fixed dose of 1.5 uM AZA. Mean +/− SD of technical triplicates. All viability data were normalized to untreated controls.
Figure 2.
Figure 2.. Monocytic AML is biologically distinct from primitive AML and loses expression of venetoclax target BCL2.
A, PCA analysis of the bulk RNA-seq data showing clear segregation of ROSlow mono-AML (N=5) from ROSlow prim-AML (N=7). B, Heatmap showing expression of top 50 up- and down-regulated genes in ROSlow mono-AML (N=5) relative to ROSlow prim-AML (N=7), MAFB, LYZ and CD14 are highlighted as monocytic markers; CD34 is highlighted as a primitive marker. C, GSEA enrichment plots showing up-regulated gene sets in prim- or mono-AML specimens. D, Bar graphs showing normalized enrichment score (NES) of top-ranked gene sets produced by GSEA analysis of mono-AML versus prim-AML bulk RNA-seq data using the KEGG gene set collection. E, A GSEA enrichment plot showing up-regulated OXPHOS gene sent in mono-AML. F, Basal respiration rate in ROSlow prim-AML (N=5) versus ROSlow mono-AML (N=5). Each dot represents a unique AML. Mean +/− SD. G, Bar graphs showing expression of BCL2 in ROSlow prim-AML (N=7) and ROSlow mono-AML (N=5). Each dot represents a unique AML. Mean +/− SD. H. Bar graphs showing expression of BCL2 in FAB-M0 (N=16), M1 (N=44), M2 (N=40), M0/1/2 (N=100) and M5 (N=21) subclasses of AMLs from the TCGA dataset. Each dot represents a unique AML. I, Western blot results showing protein level expression of BCL2 in prim-AML (N=5) and mono-AML (N=4). Actin is used as loading control.
Figure 3.
Figure 3.. Monocytic AML is preferentially reliant on MCL1 for energy metabolism and survival.
A, Bar graphs showing expression of MCL1 in ROSlow prim-AML (N=7) and ROSlow mono-AML (N=5). Each dot represents a unique AML. Mean +/− SD. B, Bar graphs showing expression of MCL1 in FAB-M0 (N=16), M1 (N=44), M2 (N=40), M0/1/2 (N=100) and M5 (N=21) subclasses of AMLs from the TCGA dataset. Each dot represents a unique AML. Mean +/− SD. C, Relative viability of monocytic AML specimens treated 24 hours with 0.5uM VEN+ 1.5uM AZA or 0.5 uM VU013 (VU661013) + 1.5uM AZA. Technical triplicates per group. Mean +/− SD. Two-tailed, unpaired t-test. D, Oxygen consumption rate (OCR) curves from Seahorse Mito Stress Assay comparing impact of 0.5uM VEN + 1.5uM AZA and 0.5uM VU013 (VU661013) + 1.5uM AZA on OXPHOS activity of monocytic AML. Technical replicates of five per data point. Mean +/− SD. Vertical dotted lines indicate injection times used in the Mito Stress Assay. E, Relative ATP production capacity calculated from the Seahorse Mito Stress Assay in 0.5uM VEN + 1.5uM AZA or 0.5uM VU013 (VU661013) + 1.5uM AZA treated monocytic AML specimens. Technical replicates of five per group. Mean +/− SD. Two-tailed, unpaired t-test. F, Western blot results showing siMCL1-#B-mediated knock down of MCL1 at protein level. G, OCR curves comparing OXPHOS activity in siMCL1-#B vs siSCR (siScramble) control monocytic AML. Technical replicates of five per data point. Mean +/− SD. Vertical dotted lines show injection times used in the Mito Stress Assay. H, Relative viability of monocytic AML cells with 48 hours exposure to siMCL1-#B or siSCR (siScramble) control, with or without presence of 1.5uM AZA. Technical triplicates per group. Mean +/− SD. Two-tailed, unpaired t-test. I, Results of Colony Forming Unit (CFU) assay comparing the impact of 0.5uM VEN + 1.5uM AZA versus 0.5uM VU013 (VU661013) + 1.5uM AZA on the stem/progenitor function of mono-AML. Mean +/− SD. Two-tailed, unpaired t-test. J, Percentage of engraftment in NSG-S mice after ex vivo treatment with 0.5uM VEN + 1.5uM AZA or 0.5uM VU013 (VU661013) + 1.5uM AZA. Each dot represents an individual mouse. Median +/− interquartile range. Mann-Whitney test was used to compare the treatment groups.
Figure 4.
Figure 4.. Monocytic disease arising from venetoclax + azacitidine treatment is derived from pre-existing monocytic subclones.
A, B, Treatment history of Pt-12, Pt-65 and flow analysis of their diagnosis (Dx) and relapse (Rl) specimens. In the CD45/SSC plots, Mono, Prim and Lym gates identify monocytic, primitive and lymphocytic populations, respectively. The CD34/CD117 and CD68/CD11b plots show immunophenotype of the gated primitive subpopulations in blue and monocytic subpopulations in red. Arrows highlight populations of interest. Clinical information of these patients is listed in Supplementary Table S1. C, D, Fish plots showing clonal dynamics in paired diagnosis (Dx) and relapse (Rl) specimens of Pt-12 and Pt-65. Genetic subclones are illustrated by distinct shapes accompanied by their clonal number (1, 2, or 3). Phenotypic subpopulations are illustrated by color as follows: teal indicates primitive phenotype; brown, pink or red indicate monocytic phenotype. For Pt-12, clone 1 presents a primitive phenotype; clone 2 presents a monocytic phenotype. For Pt-65, clone 1 presents a mixed monocytic and primitive phenotype; clone 2 presents a monocytic phenotype; clone 3 is inferred to have a monocytic phenotype as well.
Figure 5.
Figure 5.. Monocytic disease at relapse has activated MLL-specific LSC programs and sustained reliance on MCL1.
A, UMAP plots of single cell RNA-seq data generated from CITE-seq analysis of paired diagnosis (Dx) and relapse (Rl) specimens from Pt-12. Each cluster represents a subpopulation of biologically similar cells clustered by their transcriptome similarity. Each dot within each cluster represents a single cell. Teal indicates cells from diagnosis, Brown indicates cells from relapse. Also see supplementary Fig. S5A,B. B, Clustifyr analysis assigning each cluster to its closest normal hematopoietic lineage counterpart according to their transcriptome similarity. Bar graph comparing relative percentage of each subcluster in diagnosis and relapse specimens. C, Major myeloid subpopulations analyzed in subsequent analyses. D, Gprofiler analysis results showing significantly upregulated gene sets in the “Rl-mono” cluster relative to the “Dx-mono” cluster. E, A heatmap showing relative expression of MLL-specific LSC gene expression signature at single cell resolution. Red indicates strong positive expression of MLL-specific LSC signature; Blue indicates a negative expression pattern suggesting non-LSC nature. F, A heatmap showing relative expression of HOXA9 and MEIS1 at single cell resolution. G,H, Violin plots showing relative expression of HOXA9, MEIS1, BCL2 and MCL1 in different clusters. Each dot represents a single cell.

Similar articles

Cited by

References

    1. Almeida AM, Ramos F. Acute myeloid leukemia in the older adults. Leuk Res Rep 2016;6:1–7 doi 10.1016/j.lrr.2016.06.001. - DOI - PMC - PubMed
    1. Buchner T, Berdel WE, Haferlach C, Haferlach T, Schnittger S, Muller-Tidow C, et al. Age-related risk profile and chemotherapy dose response in acute myeloid leukemia: a study by the German Acute Myeloid Leukemia Cooperative Group. J Clin Oncol 2009;27(1):61–9 doi 10.1200/JCO.2007.15.4245. - DOI - PubMed
    1. Pollyea DA, Kohrt HE, Medeiros BC. Acute myeloid leukaemia in the elderly: a review. Br J Haematol 2011;152(5):524–42 doi 10.1111/j.1365-2141.2010.08470.x. - DOI - PubMed
    1. Fenaux P, Mufti GJ, Hellstrom-Lindberg E, Santini V, Finelli C, Giagounidis A, et al. Efficacy of azacitidine compared with that of conventional care regimens in the treatment of higher-risk myelodysplastic syndromes: a randomised, open-label, phase III study. Lancet Oncol 2009;10(3):223–32 doi 10.1016/S1470-2045(09)70003-8. - DOI - PMC - PubMed
    1. Kantarjian H, Issa JP, Rosenfeld CS, Bennett JM, Albitar M, DiPersio J, et al. Decitabine improves patient outcomes in myelodysplastic syndromes: results of a phase III randomized study. Cancer 2006;106(8):1794–803 doi 10.1002/cncr.21792. - DOI - PubMed

Publication types

MeSH terms