. 2020 Jan 24;367(6476):eaay1645.
doi: 10.1126/science.aay1645.

Chromatin accessibility dynamics in a model of human forebrain development

Affiliations

Chromatin accessibility dynamics in a model of human forebrain development

Alexandro E Trevino et al. Science. .

Abstract

Forebrain development is characterized by highly synchronized cellular processes, which, if perturbed, can cause disease. To chart the regulatory activity underlying these events, we generated a map of accessible chromatin in human three-dimensional forebrain organoids. To capture corticogenesis, we sampled glial and neuronal lineages from dorsal or ventral forebrain organoids over 20 months in vitro. Active chromatin regions identified in human primary brain tissue were observed in organoids at different developmental stages. We used this resource to map genetic risk for disease and to explore evolutionary conservation. Moreover, we integrated chromatin accessibility with transcriptomics to identify putative enhancer-gene linkages and transcription factors that regulate human corticogenesis. Overall, this platform brings insights into gene-regulatory dynamics at previously inaccessible stages of human forebrain development, including signatures of neuropsychiatric disorders.


Conflict of interest statement

Competing interests: Stanford University has filed a provisional patent application that covers the generation of region-specific brain organoids and their assembly (U.S. patent application number 62/477,858 and 15/158,408).

Figures

Fig. 1.
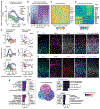
Fig. 1.. Forebrain lineage markers and ATAC-seq clustering in hCSs and hSSs.
(A) Generation of hCSs and hSSs from hiPS cells. Neuronal and glial cells were collected by immunopanning or FACS for ATAC-seq and RNA-seq. Day 20 to 60 spheroids were collected intact. Cells from HFT at PCW20 and PCW21 were collected. (B and C) Immunohistochemistry in hCSs at day 131 (d131) showing expression of GFAP and PAX6 in a ventricular zone (VZ)–like region, and the layer-specific markers CTIP2 and SATB2. (D and E) Immunohistochemistry for the astrocyte markers GFAP and SOX9 in hCS day 200 (d200) and GABA and GAD67 in hSS day 61 (d61). (F) Genome browser plots of marker gene accessibility for hiPS cells, hCS neurons, hSS neurons, and glial cells. (G) Promoter and distal accessibility levels and expression. For the left three panels, heatmap color indicates the scaled accessibility level at the promoter (left), all distal elements averaged (middle), or the distal element with activity most correlated to gene expression (right). The rightmost panel shows RNA expression over time [in transcripts per million (TPM)]. Expression of genes with multiple RefSeq annotations was averaged. (H) PCA of all ATAC-seq samples. hiPS cells (yellow), whole hCSs or hSSs (green), glial cells (red), and neuronal cells (blue) are shown. Shapes indicate hCSs (circles), hSSs (triangles), hiPS cells (diamonds), and HFT (squares). Stage is represented by a gradient. hiPS cells represent day 0. (I) PCA of all ATAC-seq samples. Whole samples refer to both hCSs and hSSs. (J) PCA of all ATAC-seq samples by source. (K) PCA of all ATAC-seq samples showing differentiation timing. HFT at PCW20 to PCW21 were labeled as d140. Scale bars, 20 μm (B) and (D), 50 μm (C) and (E).
Fig. 2.
Fig. 2.. Comparison of hCS and HFT chromatin accessibility landscapes.
(A) Comparison of hCSs to HFT at the peak level by hierarchical and K-means clustering. Sample set includes iNGN, early hCSs, isolated hCS lineages (79 to 230 days), and PCW20 HFT and microdissected HFT from GZ and CP [from (20)]. (B) Differentially accessible peaks between early spheroids and glial and neuronal lineages (DESeq2). Differential peaks at FDR < 0.01 are in red; the three panels correspond to three differential tests. Panels compare (i) hCSs (<50 days) to HFT; (ii) HepaCAM+ cells from hCSs (179 to 230 days) and HFT; and (iii) Thy1+ cells from hCSs (179 to 230 days) and HFT. (C) Similarity of HFT samples to hCSs over time. Scaled Jaccard indices are plotted. Each row denotes the merged neuronal and glial hCS samples that are most similar to the HFT sample.
Fig. 3.
Fig. 3.. Gene-regulatory dynamics in hCSs, hSSs, and HFT.
(A) K-means clustering of variable, distal accessible peaks. Activity is represented as normalized ATAC signal without additional row-scaling. Samples were sorted by stage and cell lineage. HFT samples were included in the K-means algorithm as d140. Stage or days in culture is represented by a gradient. (B) Heatmap showing expression of genes correlated to accessible elements from each K-means cluster within 500 kb of the TSS. RNA-seq clusters correspond to ATAC-seq clusters. Cluster PL was omitted because of lack of RNA-seq. (Top) Schematic of the correlation approach, displayed as row-standardized TPM. (C) Representative genes from each K-means cluster along with the GO enrichment within each cluster. P values derive from the hypergeometric test, and the color indicates the fold enrichment. (D) Enrichment of GWAS signal for schizophrenia, ASD, and Alzheimer’s disease in clusters, estimated using LD score regression. The size and color indicate fold enrichment; data points without significance are shown with a black dot. (E) Enrichment of SFARI ASD genes in the linked gene expression clusters. Colors correspond to enrichment in the cluster, and stars indicate significance (P < 0.05). (F) Enrichment of de novo noncoding ASD mutations. Enrichment scores [-log10(P) * log2(enrichment)]. (G) Motif enrichment in SFARI genes relative to enhancers of other linked genes displayed as a volcano plot [log2(enrichment) versus -log10(P)].
Fig. 4.
Fig. 4.. Transcription factor activity in the forebrain.
(A) Heatmap summarizing motif enrichments in ATAC-seq K-means clusters. The top 15 most-enriched motifs per cluster are displayed, and color indicates scaled log2(fold enrichment) versus other clusters. Select motifs are shown. (B) Schematic of chromVAR-RNA-seq expression correlation approach. Motifs are linked to TF genes that share a position weight matrix (PWM) cluster, family annotation, or binding domain by using available databases. For each motif, the correlation of chromVAR motif deviations to the expression values of each eligible TF gene is compared against a background set of correlations. A P value and FDR are computed against the null to determine significance. (C) ChromVAR-expression correlations for a subset of enriched motifs. Color indicates Pearson correlations for a TF motif-TF gene pair. The top six correlations are displayed. Stars indicate FDR-adjusted P < 0.05. Cell icons indicate the lineages with the greatest enrichments for a given motif. (D) ChromVAR motif accessibility (deviation Z scores), RNA expression (log2 TPM), and immunohistochemistry for candidate lineage-specific TFs identified by means of paired ATAC-seq and RNA-seq. For chromVAR, values are indicated with a smoothed line. RNA-seq values are shown by sample. Immunostainings show NFIA expression with KI67 and CTIP2 in hCSs (days 75 and 130); ID4 with HOPX and CTIP2 in hCS (day 130); SOX21 with GFAP in hCS (days 200 and 552); and ONECUT2 with MAP2 and GAD67 in hSS (day 61). (E) Motif volcano plots (log2 fold enrichment of motif in ATAC-seq cluster versus other clusters by -log10 P values) for GP and PN2. The color of each circle indicates the number of sequence matches in the foreground set for each motif. Cluster names are derived from the JASPAR database. The size of each colored box indicates the TF number from a given family that are enriched in the cluster. Scale bars, 50 μm (D).
Fig. 5.
Fig. 5.. A wave of chromatin accessibility and coordinated gene regulation during cortical neurogenesis.
(A) Comparison of highly active open chromatin regions in neuronal lineages. The number of peaks in the top decile of ATAC-seq signal is shown. (B) Heatmap of hCS neuron peaks (DESeq2, FDR-adjusted P < 0.01) over 79 to 230 days. Peaks are sorted by the day-weighted mean of accessibility across these time points. Signal is displayed as row-scaled normalized accessibility. (C) Gene expression patterns of genes significantly linked to peaks in (B), displayed as row-scaled log2 (TPM). Select genes are shown. (D) ChromVAR deviations in hCSs. Row-scaled deviation Z-scores for each motif are plotted and sorted by the day-weighted mean of the deviations. (E) ChromVAR deviations and RNA-seq expression values for TBR1, MEF2C, and POU3F2 (BRN2). (F) Immunohistochemistry of hCS in cryosections at day 130 showing expression of the layer-specific markers TBR1 and BRN2 (or POU3F2) with MAP2. (G) Immunohistochemistry hCS at day 130 showing expression of MEF2C, BRN2, and CTIP2. (H) For each TF motif, the number of genes from the SFARI database with a linked enhancer having that motif is shown. Euler diagram indicates genes with binding motifs for more than one of the indicated TFs in linked enhancers. GO enrichments for groups of these SFARI genes are shown. “Shared regulation” indicates genes with two or more motifs. Scale bars, 50 μm (F) and (G).

References

    1. Silbereis JC, Pochareddy S, Zhu Y, Li M, Sestan N, The cellular and molecular landscapes of the developing human central nervous system. Neuron 89, 248–268 (2016). doi: 10.1016/j.neuron.2015.12.008; - DOI - PMC - PubMed
    1. Rubenstein JLR, Annual Research Review: Development of the cerebral cortex: implications for neurodevelopmental disorders. J. Child Psychol. Psychiatry 52, 339–355 (2011). doi: 10.1111/j.1469-7610.2010.02307.x; - DOI - PMC - PubMed
    1. Wonders CP, Anderson SA, The origin and specification of cortical interneurons. Nat. Rev. Neurosci 7, 687–696 (2006). doi: 10.1038/nrn1954; - DOI - PubMed
    1. Juric-Sekhar G, Hevner RF, Malformations of cerebral cortex development: Molecules and mechanisms. Annu. Rev. Pathol 14, 293–318 (2019). doi: 10.1146/annurev-pathmechdis-012418-012927; - DOI - PMC - PubMed
    1. Buenrostro JD et al., Integrated single-cell analysis maps the continuous regulatory landscape of human hematopoietic differentiation. Cell 173, 1535–1548.e16 (2018). doi: 10.1016/j.cell.2018.03.074; - DOI - PMC - PubMed

Publication types