. 2020 Feb 11;117(6):2957-2967.
doi: 10.1073/pnas.1915520117. Epub 2020 Jan 23.

Structural instability and divergence from conserved residues underlie intracellular retention of mammalian odorant receptors

Affiliations

Structural instability and divergence from conserved residues underlie intracellular retention of mammalian odorant receptors

Kentaro Ikegami et al. Proc Natl Acad Sci U S A. .

Abstract

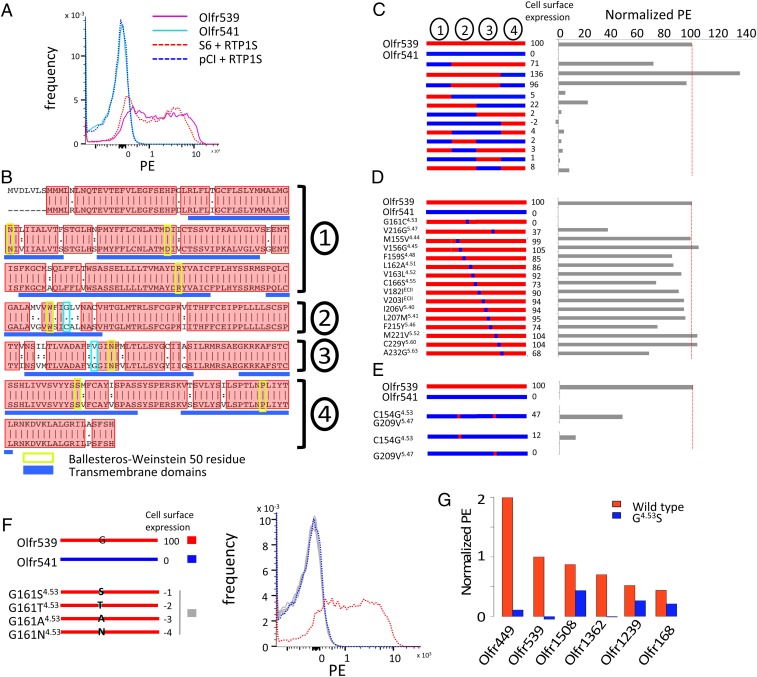
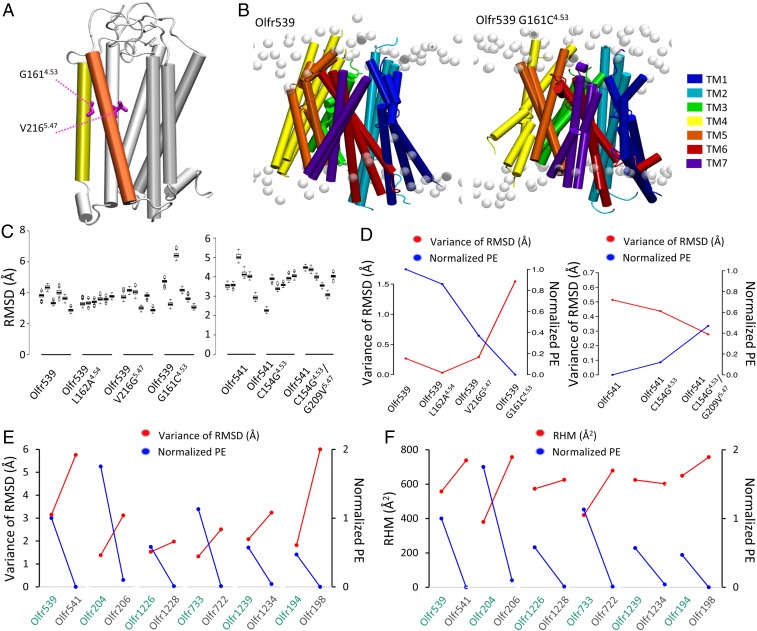
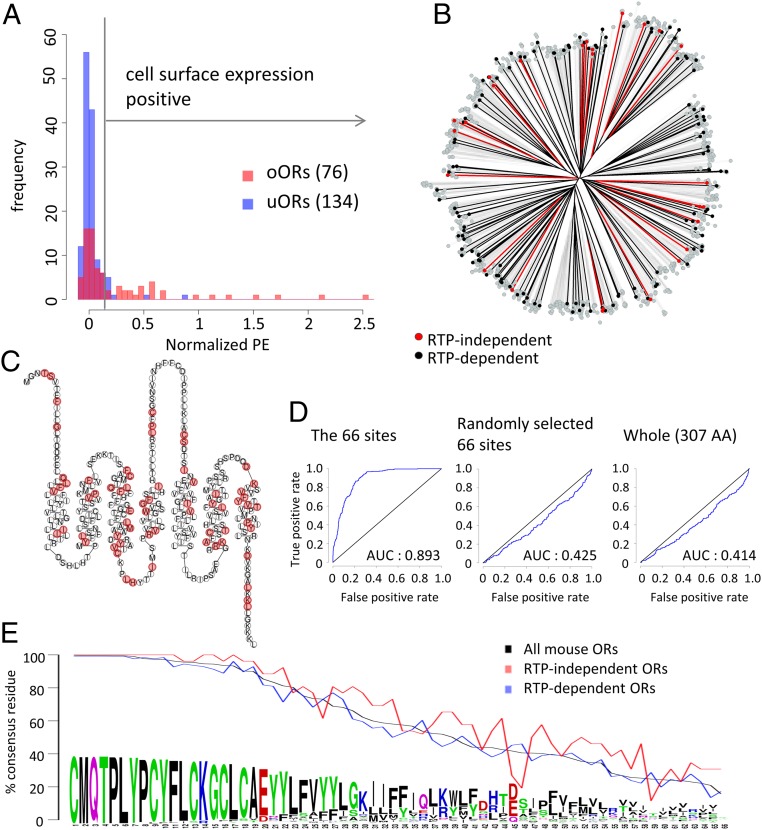
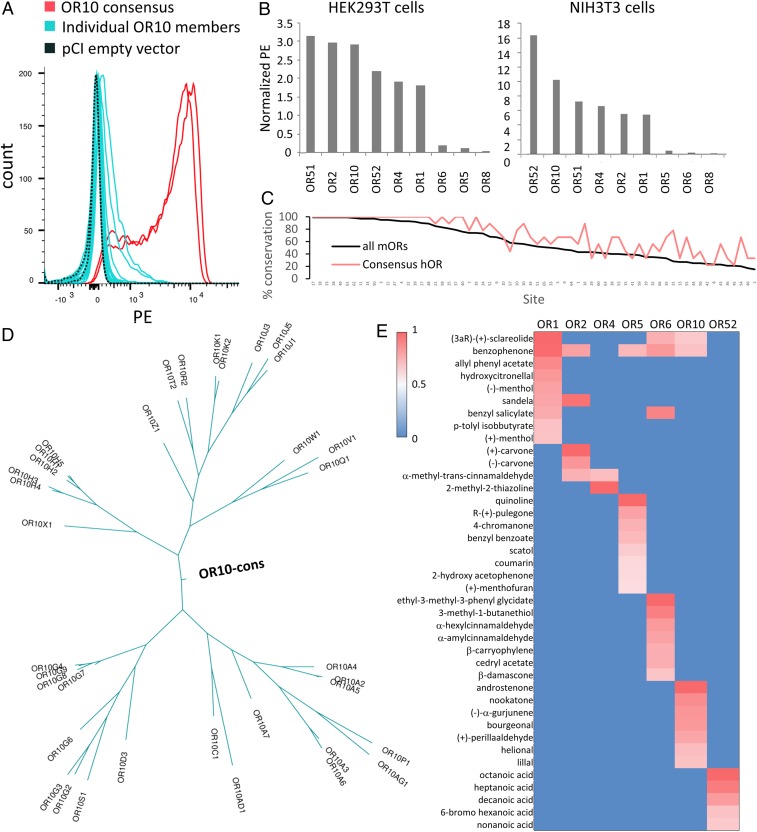
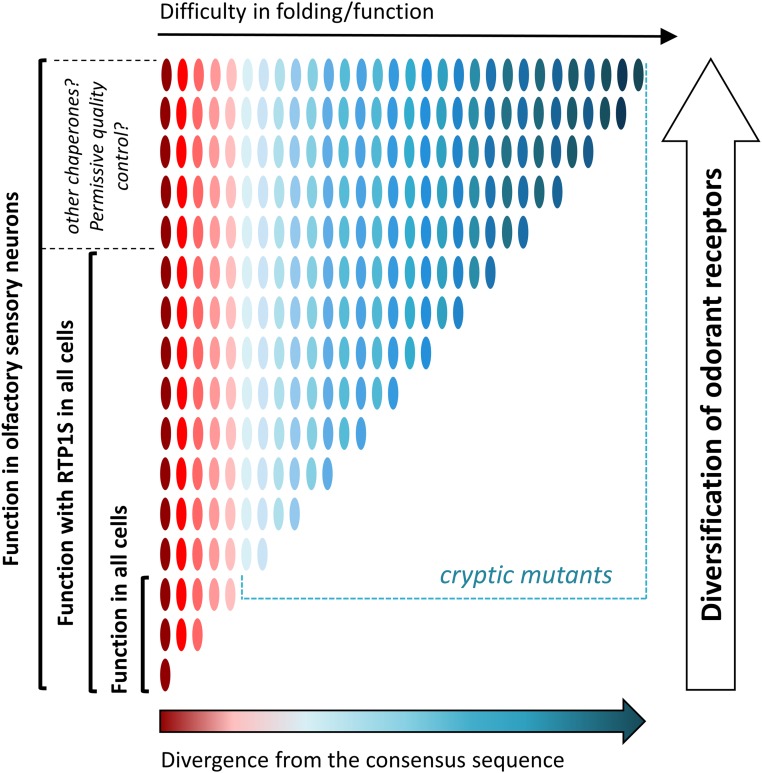
Mammalian odorant receptors are a diverse and rapidly evolving set of G protein-coupled receptors expressed in olfactory cilia membranes. Most odorant receptors show little to no cell surface expression in nonolfactory cells due to endoplasmic reticulum retention, which has slowed down biochemical studies. Here we provide evidence that structural instability and divergence from conserved residues of individual odorant receptors underlie intracellular retention using a combination of large-scale screening of odorant receptors cell surface expression in heterologous cells, point mutations, structural modeling, and machine learning techniques. We demonstrate the importance of conserved residues by synthesizing consensus odorant receptors that show high levels of cell surface expression similar to conventional G protein-coupled receptors. Furthermore, we associate in silico structural instability with poor cell surface expression using molecular dynamics simulations. We propose an enhanced evolutionary capacitance of olfactory sensory neurons that enable the functional expression of odorant receptors with cryptic mutations.

Keywords: GPCR; olfaction; protein trafficking.


Conflict of interest statement

Competing interest statement: K.I., C.A.d.M., M.H.N., and H.M. filed a provisional patent application relevant to this work. H.M. receives royalties from Chemcom. The remaining authors declare no competing interests.

Figures

Fig. 1.
Fig. 1.
G1614.53 and V2165.47 are critical to the cell surface expression of Olfr539 and Olfr541. (A) Olfr539 robustly but Olfr541 poorly expresses in the cell surface in heterologous cells in the absence of RTP1 and RTP2. The expression is evaluated by flow cytometry with OR S6 and pCI as positive and negative controls, respectively, by recording the frequency of PE fluorescence (Methods). (B) Alignment of protein sequences of Olfr539 (Top) and Olfr541 (Bottom). Ninety percent of the amino acid residues are shared between the two ORs and are shown in red boxes. Ballesteros-Weinstein 50 residue for each TM domain is boxed in green (33). G/C1614.53 and G/V2165.47 are highlighted in cyan boxes. (C–F) (Left) Designs of chimeric ORs and (Right) cell surface expression results (normalized PE). (C) Chimeric ORs created by replacing parts of Olfr539 (red) with those of Olfr541 (blue). (D) Single amino acid mutants created by substituting amino acids of Olfr539 in regions 2 and 3 for those of Olfr541. (E) Reciprocal Olfr541 mutants created by substituting single or double amino acids of Olfr541 with those of Olfr539. (F) Olfr539 mutants created by substituting G1614.53 with S, T, A, or N, which are altogether conserved in almost 30% of the mouse ORs, lose cell surface expression. (G) G4.53S mutants of RTP-independent ORs (Olfr449, Olfr539, Olfr1508, Olfr1362, Olfr1239, and Olfr168) (blue) show less cell surface expression levels compared with the WT (red) in the absence of RTP1 and RTP2.
Fig. 2.
Fig. 2.
In silico structural stability of ORs correlates with the cell surface expression level. (A) A 3D homology model of Olfr539. TM4 (yellow) and TM5 (orange) are represented in colored tubes, and the remaining structure is in white. G1544.53 and V2095.47 are developed in pink licorice. (B) Superposed images of triplicate WT (Left) Olfr539 and (Right) Olfr539 G161C4.53 models after 500 ns MD simulations in an explicit model of plasma membrane (white). (C) RMSDs of six individual MD simulations of (Left) Olfr539 systems (WT, L162A4.54 G161C4.53, and V216G5.47) and (Right) Olfr541 systems (WT, C154G4.53, and C154G4.53/G209V5.47). The models are placed in descending order based on cell surface expression levels for Olfr539 systems and in ascending order for Olfr541 systems. (D) Plots of the variance of mean RMSDs (left axis, red plots) and the cell surface expression levels (right axis, blue plots) of (Left) Olfr539 systems and (Right) Olfr541 systems. (E) Plots of the variance of RMSDs (left axis, red plots) and the cell surface expression levels (right axis, blue plots) of Olfr pairs sharing a high sequence identity but showing different cell surface expression levels (high in green, low in gray). (F) Plots of the RHM (left axis, blue plots) and the cell surface expression levels (right axis, blue plots) of Olfr pairs sharing a high sequence identity but showing different cell surface expression levels (high in green, low in gray).
Fig. 3.
Fig. 3.
Cell surface expression analyses for a large repertoire of mouse ORs in heterologous cells in the absence of RTP1 and RTP2. (A) Histogram of cell surface expression levels of 76 oORs (red) and 134 uORs (blue). The vertical line at 0.144 is a cutoff for positive/negative cell surface expression. (B) Phylogenetic tree of protein sequences of mouse ORs. Red, black, and gray indicate RTP-independent ORs, RTP-dependent ORs, and the other ORs, respectively. (C) Snake plot of the consensus protein sequence of mouse ORs. The 66 sites with less diverse residues in RTP-independent ORs (P < 0.05, Bonferroni corrected) are colored in red. (D) RTP dependence of tested ORs is predicted using SVM-based classifiers based on amino acid properties in 10-fold cross-validation, and the accuracy is validated by the ROC curves. The SVM-based classifier has been built using the 66 sites of interest, 66 random amino acid positions, and the entire 307 amino acid positions in the tested ORs. (E) Usage rate of consensus residues at the 66 sites. RTP-independent ORs more frequently use consensus residues than RTP-dependent ORs at 58 out of 66 sites.
Fig. 4.
Fig. 4.
Potential of consensus ORs for robust cell surface expression in the absence of RTP1S. (A) Thirty-two human OR10 subfamily members (cyan) and the consensus OR (red, duplicate) were transfected into HEK293T cells, and their cell surface expression levels were measured by flow cytometry. (B) Cell surface expression levels of 9 consensus ORs (OR1, OR2, OR4, OR5, OR6, OR8, OR10, OR51, and OR52) were evaluated in HEK293T or NIH/3T3 cells. The PE fluorescence is normalized by setting Olfr539 response to 1 and Olfr541 to 0. (C) Usage rate of consensus residues at the 66 sites for consensus human ORs (consensus hOR; red) and all mouse ORs (black). (D) Ancestral tree of OR10 family member including OR10 consensus. (E) Heat map of ORs’ responses to 50 µM of odorants selected from a previously screened panel of 320 compounds. Luciferase activity was normalized for each OR by setting 1.0 as the highest response value and 0 as the lowest response value. Consensus OR1, OR2, OR4, OR5, OR6, OR10, and OR52 are functionally expressed in Hana3A cells.
Fig. 5.
Fig. 5.
Improvement of OR expression by mutations in TM1 and helix 8. (A) Homology model of OR10. Each TM is highlighted in a colored tube, and residues D511.60, S521.61, H531.62, and E294H8 are represented in licorice (pink). (B) Zoom on the residues 1.60, 1.61, 1.62, H8 mutated for OR1 (red), OR10 (blue), OR51 (green), and OR52 (pink). Ionic interactions between the residues are shown by dotted lines. (C) Expression analysis of OR1, OR10, OR51, OR52, and their mutants and the muscarinic receptor 3 (M3) at 1, 10, and 100 pg/µL of DNA in the transfection mix. (D) Dose–response curve of OR10 and OR52 and their mutants at different DNA concentration (from 0.001 to 100 in pg/µL of transfection mix) to androstenone and nonanoic acid, respectively. The y axis represents the luciferase luminescence normalized to the basal activity of each DNA concentration.
Fig. 6.
Fig. 6.
Proposed model. RTPs are evolutionary capacitors involved in enhanced diversification of ORs. OR genes are represented in oval shapes colored from dark red (ORs that are more aligned with the consensus) to dark blue (ORs that are more divergent from the consensus). Divergence of ORs from the consensus sequence results in difficulties in OR folding and function. Cryptic OR mutants are functional in the OSNs with RTPs and other capacitors. OR diversification and rapid evolution rely on the presence of olfactory-specific evolutionary capacitors.

References

    1. Buck L., Axel R., A novel multigene family may encode odorant receptors: A molecular basis for odor recognition. Cell 65, 175–187 (1991). - PubMed
    1. Niimura Y., Matsui A., Touhara K., Extreme expansion of the olfactory receptor gene repertoire in African elephants and evolutionary dynamics of orthologous gene groups in 13 placental mammals. Genome Res. 24, 1485–1496 (2014). - PMC - PubMed
    1. Firestein S., How the olfactory system makes sense of scents. Nature 413, 211–218 (2001). - PubMed
    1. Saraiva L. R., et al. , Combinatorial effects of odorants on mouse behavior. Proc. Natl. Acad. Sci. U.S.A. 113, E3300–E3306 (2016). - PMC - PubMed
    1. Adipietro K. A., Mainland J. D., Matsunami H., Functional evolution of mammalian odorant receptors. PLoS Genet. 8, e1002821 (2012). - PMC - PubMed

Publication types

Substances

LinkOut - more resources