. 2020 Feb 11;117(6):3301-3306.
doi: 10.1073/pnas.1913003117. Epub 2020 Jan 23.

Genome-scale transcriptional dynamics and environmental biosensing

Affiliations

Genome-scale transcriptional dynamics and environmental biosensing

Garrett Graham et al. Proc Natl Acad Sci U S A. .

Abstract

Genome-scale technologies have enabled mapping of the complex molecular networks that govern cellular behavior. An emerging theme in the analyses of these networks is that cells use many layers of regulatory feedback to constantly assess and precisely react to their environment. The importance of complex feedback in controlling the real-time response to external stimuli has led to a need for the next generation of cell-based technologies that enable both the collection and analysis of high-throughput temporal data. Toward this end, we have developed a microfluidic platform capable of monitoring temporal gene expression from over 2,000 promoters. By coupling the "Dynomics" platform with deep neural network (DNN) and associated explainable artificial intelligence (XAI) algorithms, we show how machine learning can be harnessed to assess patterns in transcriptional data on a genome scale and identify which genes contribute to these patterns. Furthermore, we demonstrate the utility of the Dynomics platform as a field-deployable real-time biosensor through prediction of the presence of heavy metals in urban water and mine spill samples, based on the the dynamic transcription profiles of 1,807 unique Escherichia coli promoters.

Keywords: E. coli transcriptomics; biosensor; dynamics; explainable AI; high-throughput microfluidics.


Conflict of interest statement

Competing interest statement: W.H.M., M.F., S.C., and J.H. have a financial interest in Quantitative BioSciences. Quantitative BioSciences has an exclusive license to IP stemming from this work, which is owned by the University of California San Diego.

Figures
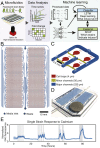
Fig. 1.
Fig. 1.
The Dynomics platform. (A) Fluorescent strain libraries are loaded onto large-scale microfluidic devices that can be fully captured in a single image using custom optics. Parallel cultures of E. coli are subjected to multiple exposures of different stimuli with time series and fold changes used to quantify responsive strains. Machine-learning algorithms are trained on preprocessed data to enable real-time stimulus detection. (B) Design of the Dynomics 2,176-strain microfluidic device with cell traps in red and media channels in blue and yellow. (C) Detailed schematic of four cell traps with arrows showing direction of media flow. (D) View of the full Dynomics chip. (E) Mean fluorescence (solid blue) and SD (shaded blue) of the E. coli zntA promoter driving GFP to repeated cadmium inductions (gray bars) with periods increasing from left to right (30 min, 2 h, 4 h, and 8 h).
Fig. 2.
Fig. 2.
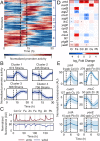
Dynomics as a screening tool for heavy metal responsive promoters in E. coli. (A) Fluorescence response of an E. coli promoter library during a 4-h 50-ppb Zn induction (dashed window). Each row represents the promoter activity, normalized between 0 and 1, of a single strain, with 1,995 total strains represented. Four clusters from agglomerative clustering are labeled on the right. (B) Four clusters of strains calculated from agglomerative clustering from the data in A. The mean (dark blue line) ±1 SD (dark blue shading) of all strains in each cluster is plotted. The dashed window denotes when zinc was present. (C) Responsive strains over the duration of a Dynomics experiment. Normalized fluorescence for two strains is plotted over the duration of one experiment, with 4-h heavy metal inductions (gray bars) occurring once daily. (D) Fold change for top responding strains to all metals. Log2 of the average fold change is shown for the top responding strains to each heavy metal. *P = 0.05, **P = 0.01, ***P = 0.001, respectively. (E) Significant single-strain normalized fluorescence response (blue line) ±1 SD (blue shading) across all inductions for a given metal (dashed window).
Fig. 3.
Fig. 3.
Machine learning on heavy metal exposures. (A) Confusion matrix showing the recall (true positive rate) of the LSTM-RNN classifier in predicting six metals across all experimental data (14,332 time points). (B) LSTM-RNN classifier applied to time series data for all six detectable metals in two different experiments. Both experiments have a row for the true media condition and the predicted condition. In the case of correct classification, the color in the predicted row would match the color in the top row, whose color represents which metal was actually present at that time point. An easy way to tell if there has been a misclassification is by seeing if there are any regions flagged with red below the predicted row. Red indicates time points where the prediction does not match the ground truth. (C) Feature (blue) and SHAP (orange) time trajectories for individual promoters during metal exposures. Solid lines show the mean value over all inductions for that metal and the shaded region around lines represents SD. Dashed black lines represent metal exposure window. While some promoters are responsive to many different metals, additional information from other promoters helps the classifier to differentiate each metal. Many promoters with noisy and subtle metal responses also contribute to classifier performance.
Fig. 4.
Fig. 4.
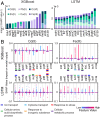
XAI offers insights into the E. coli transcriptional dynamics contributing to metal classification. (A) Bar plot showing the cumulative contribution based on the SHAP values of 15 top promoters and a negative control (promoterless strain U139) to the prediction of each metal for both XGBoost and LSTM-RNN classifiers. Colored bars for each metal represent the mean absolute SHAP value over all experimental time points. (B) SHAP values shown for 10 top promoters and a negative control (promoterless strain U139) for Cd(II) and Fe(III) for XGBoost and LSTM-RNN. Each point represents the feature value (normalized first derivative) at a given time point. Positive SHAP values suggest that a given metal is present while negative values suggest its absence. Up-regulated promoters (zntA, codB) give high SHAP values when feature values are high. Promoters are annotated with prominent gene ontology terms enriched between the two datasets.
Fig. 5.
Fig. 5.
Dynomics and machine learning on environmental samples. (A) LSTM-RNN classification of cadmium contamination in five different urban water sources. Each city has a row for the true media condition, the predicted condition, and whether the time points are misclassified (red). The colors correspond to the metals in B, Inset. (B) Multiclass, multilabel classification of water samples from the San Juan River during the 2015 Gold King Mine waste water spill. Independent probabilities of each class are determined by the sigmoid activation function. The plot shows the sum of the classifier probabilities, averaged across triplicate sample exposures (addition and removal at vertical black lines). Inset bar chart shows the concentration of detectable metals in San Juan River samples as determined by ICP-MS. The colors of predicted toxins correspond to the metals plotted in Inset.

Similar articles

Cited by

References

    1. Kholodenko B., Yaffe M. B., Kolch W., Computational approaches for analyzing information flow in biological networks. Sci. Signal. 5, re1 (2012). - PubMed
    1. Milo R., et al. , Network motifs: Simple building blocks of complex networks. Science 298, 824–827 (2002). - PubMed
    1. Jacob F., Monod J., Genetic regulatory mechanisms in the synthesis of proteins. J. Mol. Biol. 3, 318–356 (1961). - PubMed
    1. Gardner T. S., Cantor C. R., Collins J. J., Construction of a genetic toggle switch in Escherichia coli. Nature 403, 339–342 (2000). - PubMed
    1. Krupp M., et al. , RNA-Seq Atlas-a reference database for gene expression profiling in normal tissue by next-generation sequencing. Bioinformatics 28, 1184–1185 (2012). - PubMed

Publication types

MeSH terms

LinkOut - more resources