. 2020 Jan 23;11(1):462.
doi: 10.1038/s41467-019-14266-z.

Dissecting transcriptomic signatures of neuronal differentiation and maturation using iPSCs

Affiliations

Dissecting transcriptomic signatures of neuronal differentiation and maturation using iPSCs

Emily E Burke et al. Nat Commun. .

Abstract

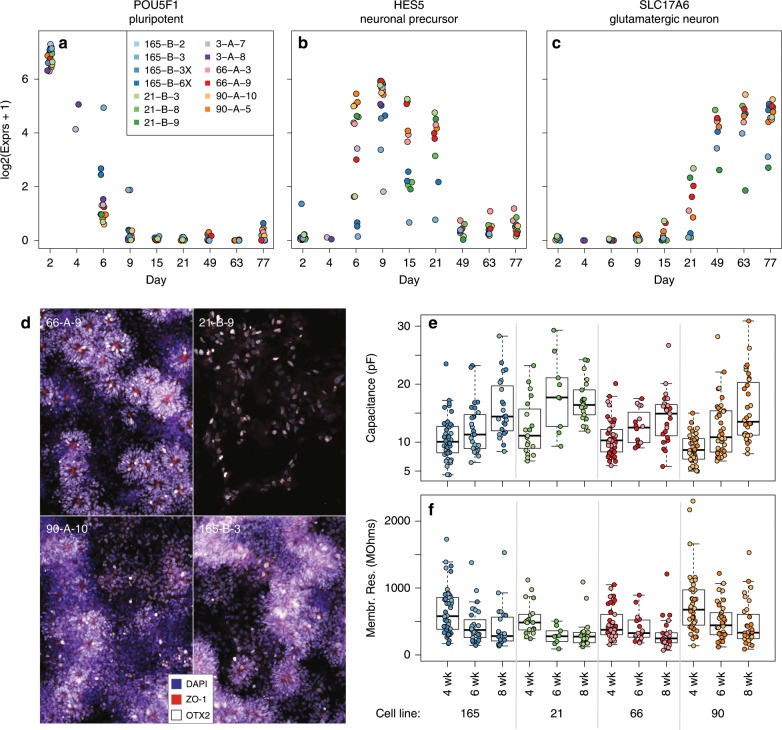
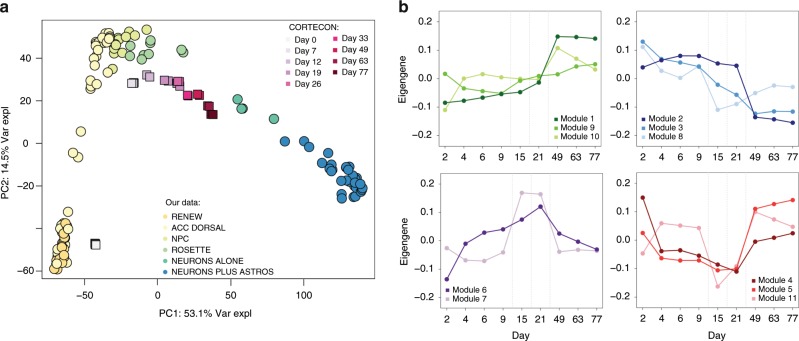
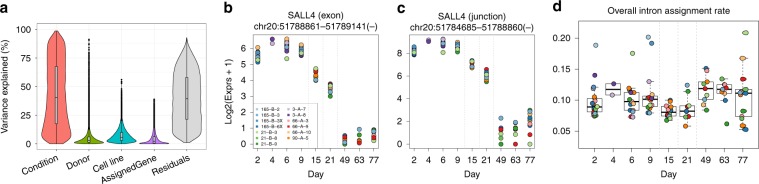
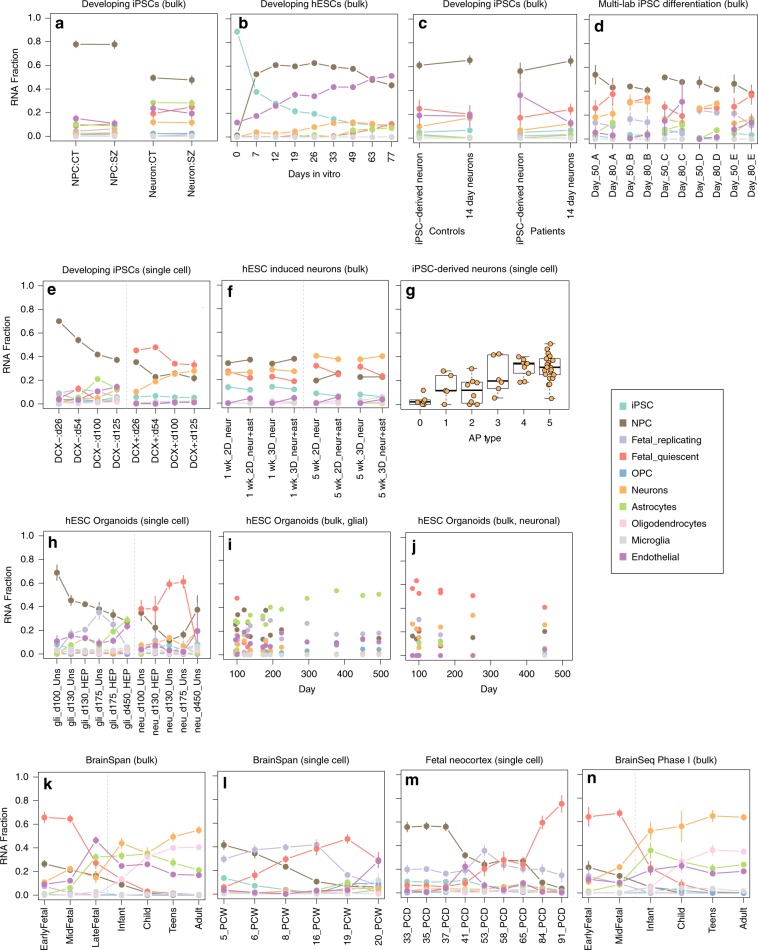
Human induced pluripotent stem cells (hiPSCs) are a powerful model of neural differentiation and maturation. We present a hiPSC transcriptomics resource on corticogenesis from 5 iPSC donor and 13 subclonal lines across 9 time points over 5 broad conditions: self-renewal, early neuronal differentiation, neural precursor cells (NPCs), assembled rosettes, and differentiated neuronal cells. We identify widespread changes in the expression of both individual features and global patterns of transcription. We next demonstrate that co-culturing human NPCs with rodent astrocytes results in mutually synergistic maturation, and that cell type-specific expression data can be extracted using only sequencing read alignments without cell sorting. We lastly adapt a previously generated RNA deconvolution approach to single-cell expression data to estimate the relative neuronal maturity of iPSC-derived neuronal cultures and human brain tissue. Using many public datasets, we demonstrate neuronal cultures are maturationally heterogeneous but contain subsets of neurons more mature than previously observed.


Conflict of interest statement

R.W.B., A.J.C. and N.J.B. were full-time employees and shareholders of AstraZeneca at the time these studies were conducted. No other authors have competing interests.

Figures

Fig. 1
Fig. 1. Differentiating hiPSCs follow expected trajectories of neuronal development.
Normalized expression levels from RNA-seq showing the expected temporal behavior of canonical marker genes through differentiation: a the loss of pluripotency gene POU5F1/OCT4, b the expression of HES5 through NPC differentiation, and c the gain of SLC17A6/VGLUT2 through neural maturation. d Presence of self-aggregating neural rosettes using representative images from one subclonal line across four donors. Lines clockwise from top left: 66-A-9, 21-B-9, 165-B-3, and 90-A-10. Blue—DAPI; red—ZO-1; white—OTX2. Electrophysiology measurements across neuronal maturation show e increasing capacitance and f decreasing membrane resistance.
Fig. 2
Fig. 2. Global expression comparison to CORTECON.
a PCA of gene expression levels showing PC1 (53.1% of variance explained) representing corticogenesis and PC2 (14.5% of variance explained) separating samples in the NPC stage from self-renewing and neuronal cells, as well as the conservation of these components of variability in the CORTECON dataset. b Eigengenes of the 11 WGCNA modules created from the RNA-seq data of 25,466 expressed genes (with 3284 genes in the unassigned module), grouped by dynamic expression pattern: genes that are more highly expressed in mature neurons, those that are more lowly expressed in mature neurons (related to loss of pluripotency), those that rise in NPCs and then fall, and those that fall in NPCs and then rise again in neurons.
Fig. 3
Fig. 3. Feature-level differential expression.
a The contribution of variance in expression models at the gene level. b An example of a differentially expressed exon across conditions from SALL4, a gene thought to play a role in the development of motor neurons, as well as expression of the neighboring exon–exon junction (c). d Percent of aligned reads assigned to intronic sequences across all samples and timepoints, with a significant overall gain in intronic assignment rate between NPCs/rosettes (days 15 and 21) and differentiated neurons (days 49–77) in line with previous research.
Fig. 4
Fig. 4. Astrocyte coculturing.
a Volcano plot showing the differential expression between human neurons cultured alone and human neurons cocultured with rat astrocytes, as well as the enrichment b of the 3214 genes differentially expressed at FDR < 5%, split by direction of change. c, d Analogous results of differential expression analysis quantified against the rat genome, comparing rat astrocytes alone with rat astrocytes cocultured with human neurons.
Fig. 5
Fig. 5. Deconvoluting RNA from the underlying cell types across differentiation.
a The mean standardized expression in the single-cell reference data of the 131 genes that were found to distinguish iPSCs (25 genes), NPCs (25 genes), fetal replicating neurons (11 genes), fetal quiescent neurons (25 genes), adult neurons (24 genes), and adult endothelial cells (21 genes). b The mean standardized expression of our time-course data across these 131 genes, showing expected higher expression of iPSC genes in the earlier time-course samples, and higher adult neuronal genes in the samples of neurons on astrocytes. c Boxplots of the standardized expression in both the single-cell reference data and time-course data of two genes, SNAP25 and SCN2A, that distinguish adult neurons. d The RNA fraction of cell types of our bulk data estimated by the deconvolution algorithm, showing the fall of iPSCs and the rise of fetal quiescent and adult neurons.
Fig. 6
Fig. 6. Deconvoluting RNA fractions from publicly available RNA-seq data.
We assessed the robustness of our deconvolution algorithm by applying it to various public RNA-seq datasets, including several bulk and single-cell iPSC-derived neuronal (ag) and organoid (hj) datasets, which included assessing neuronal fractions in a multi-lab study (d) and in a Patch-seq dataset with paired electrophysiology data (g). We further applied the deconvolution algorithm to multiple studies of human brain tissue (kn) comprising fetal through adult samples. Dots represent the mean proportions, while the vertical ticks show standard deviation.

References

    1. Shi Y, Inoue H, Wu JC, Yamanaka S. Induced pluripotent stem cell technology: a decade of progress. Nat. Rev. Drug Discov. 2017;16:115–130. doi: 10.1038/nrd.2016.245. - DOI - PMC - PubMed
    1. Linda K, Fiuza C, Nadif Kasri N. The promise of induced pluripotent stem cells for neurodevelopmental disorders. Prog. Neuropsychopharmacol. Biol. Psychiatry. 2018;84:382–391. doi: 10.1016/j.pnpbp.2017.11.009. - DOI - PubMed
    1. Zhang X, et al. Cell-type-specific alternative splicing governs cell fate in the developing cerebral cortex. Cell. 2016;166:1147–1162.e15. doi: 10.1016/j.cell.2016.07.025. - DOI - PMC - PubMed
    1. BrainSeq Consortium. Brainseq: neurogenomics to drive novel target discovery for neuropsychiatric disorders. Neuron. 2015;88:1078–1083. doi: 10.1016/j.neuron.2015.10.047. - DOI - PubMed
    1. Li M, et al. A human-specific AS3MT isoform and BORCS7 are molecular risk factors in the 10q24.32 schizophrenia-associated locus. Nat. Med. 2016;22:649–656. doi: 10.1038/nm.4096. - DOI - PubMed

Publication types