

Cancer staging at diagnosis data comparisons in South Australia
- PMID: 31974401
- PMCID: PMC6978520
- DOI: 10.1038/s41598-020-57704-5
Cancer staging at diagnosis data comparisons in South Australia
Abstract
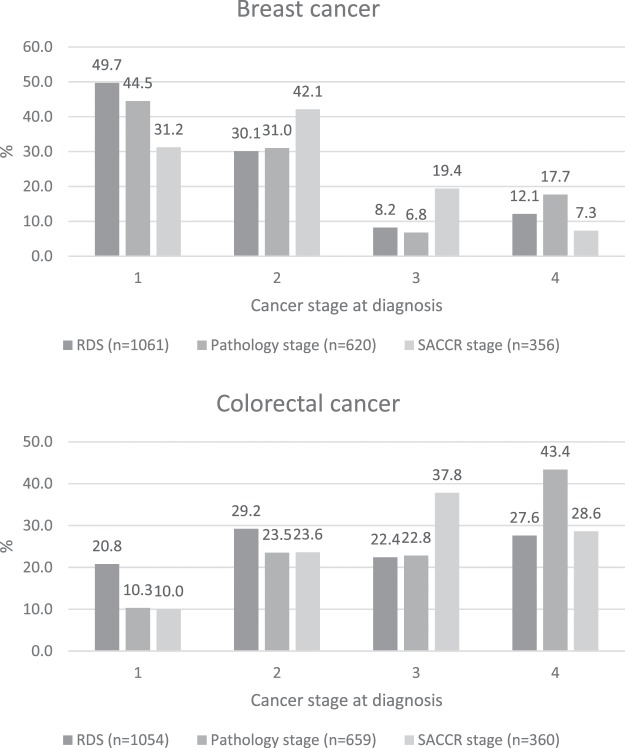
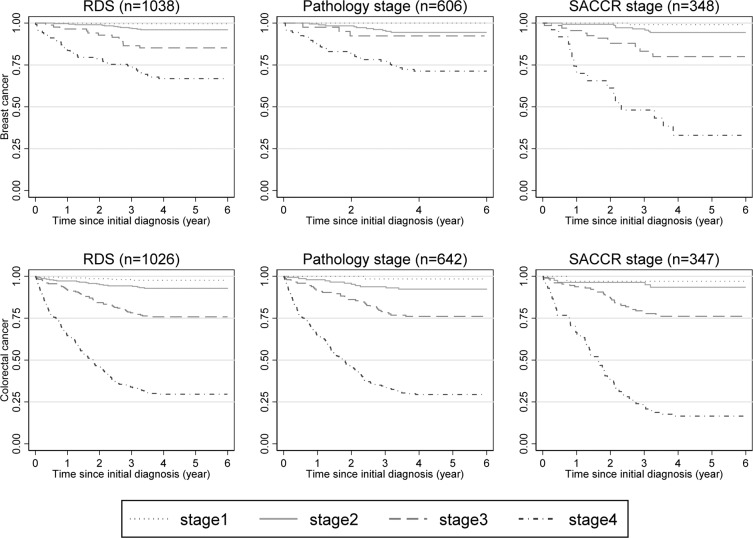
Cancer stage at diagnosis is an important gap for Australian population based cancer registries. The study aims to understand the quality and completeness of three different collections of cancer staging data. The South Australian Cancer Registry data collection for breast and colorectal cancer (CRC) cases diagnosed in 2011, was linked to Registry Derived Stage (RDS) data, pathology plus hospital metastasis codes (pathology stage), and the South Australian Clinical Cancer Registry Stage (SACCR stage). The agreement between staging systems was examined using kappa statistics. Kaplan-Meier curves and Cox regression were used to examine the difference in survival by staging methods. Among 2,530 breast and CRC cases 98.8% were stageable (n = 2,500) according to histology. Among stageable cases, 84.6% had RDS, 51.2% had pathology stage and 29.5% had SACCR stage. The kappa statistic for RDS and pathology stage was 0.930 for breast cancer and 0.973 for CRC, and 0.574 for RDS and SACCR stage for breast cancer and 0.632 for CRC. The agreement between pathology stage and SACCR stage was 0.430 for breast cancer and 0.528 for CRC. The distribution of stage was similar across staging methods, although more stage four cancers by pathology stage, and survival patterns were similar but not the same. The agreement was high between different staging systems. Pathology stage had a higher than expected stage 4 proportion. This study highlights an opportunity to collect stage information in a cost-effective manner, while collecting data that usefully represent stage at diagnosis across the population, for population based epidemiological analyses.
Conflict of interest statement
The authors declare no competing interests.
Figures
References
-
- Australian Institute of Health and Welfare. Australia’s Health 2018., (AIHW, Canberra, 2018).
MeSH terms
LinkOut - more resources
Full Text Sources
Medical
Miscellaneous
