. 2020 Jan 23;10(1):1049.
doi: 10.1038/s41598-020-58051-1.

Pifithrin-α alters p53 post-translational modifications pattern and differentially inhibits p53 target genes

Affiliations

Pifithrin-α alters p53 post-translational modifications pattern and differentially inhibits p53 target genes

Jiawei Zhu et al. Sci Rep. .

Abstract

Pifithrin-α (PFT-α) is a small molecule which has been widely used as a specific inhibitor of p53 transcription activity. However, its molecular mechanism of action remains unclear. PFT-α has also been described to display potent p53-independent activity in cells. In this study, we addressed the mechanism of action of PFT-α. We found that PFT-α failed to prevent the effects of Mdm2 inhibitor Nutlin-3 on cell cycle and apoptosis in several cancer cell lines. However, PFT-α rescued normal primary fibroblasts from growth inhibition by Nutlin-3. PFT-α displayed a very limited effect on p53-dependent transcription upon its activation by Nutlin-3. Moreover, PFT-α inhibitory effect on transcription was highly dependent on the nature of the p53 target gene. PFT-α attenuated post-translational modifications of p53 without affecting total p53 protein level. Finally, we found that PFT-α can decrease the level of intracellular reactive oxygen species through activation of an aryl hydrocarbon receptor (AHR)-Nrf2 axis in a p53-independent manner. In conclusion, PFT-α inhibits only some aspects of p53 function, therefore it should be used with extreme caution to study p53-dependent processes.


Conflict of interest statement

The authors declare no competing interests.

Figures

Figure 1
Figure 1
Effect of PFT-α on Nutlin-3-induced growth suppression. (A) Crystal violet staining of MCF7 and MCF7 p53KO cells after 10 µM Nutlin-3 with or without PFT-α (20 µM) treatment for 72 h. Relative quantification is indicated below the pictures. (B) Resazurin cell viability assay of BJ fibroblasts (wtp53 and shp53) upon 10 µM Nutlin-3 and PFT-α treatment for 72 h. The values are reported as relative cell viability normalized to DMSO treatment group and represent the mean ± SD of three replicates. (C) Resazurin cell viability assay and crystal violet staining of primary fibroblasts with Nutlin-3 (10 µM) and PFT-α treatment for 72 h. The values are reported as relative cell viability normalized to DMSO treatment group and represent the mean ± SD of three replicates.
Figure 2
Figure 2
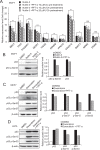
Effect of PFT-α on p53 transcriptional target genes and p53 PTMs. (A) qPCR for the detection of mRNA level of p53 transcriptional target genes in MCF7 cells upon Nutlin-3 (10 µM) with or without 12 h pre-treatment with 20 µM PFT-α. The values are reported as fold change relative to DMSO treatment group and represent the mean ± SD of three independent experiments performed in three replicates. (B) Western blot to detect the protein level of p53 and p53 p-Ser33 upon 8 h Nutlin-3 treatment (10 µM) with or without PFT-α (20 µM, 12 h pre-treatment) in MCF7 cells. Densitometric analysis of the bands was performed using ImageJ software, the ratio of p53, p53 p-Ser33/β-actin for DMSO, Nutlin-3 and Nutlin-3 plus PFT-α treatment was quantified and then normalized with Nutlin-3 treatment group. (C) Western blot to detect the protein level of p53, p53 p-Ser33 and p53 p-Ser15 upon 8 h doxorubicin treatment (1 µM) with or without PFT-α (20 µM, 12 h pre-treatment) in MCF7 cells. Densitometric analysis of the bands was performed using ImageJ software, the ratio of p53 p-Ser33/β-actin and p53 p-Ser15/β-actin for DMSO, doxorubicin and doxorubicin plus PFT-α treatment was quantified and then normalized with doxorubicin treatment group. (D) Same experiment as in C, performed in A375 cells.
Figure 3
Figure 3
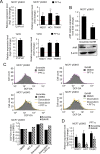
Antioxidant activity induced by PFT-α. (A) DCF-DA staining of ROS levels upon NAC (10 mM) and PFT-α (20 µM) treatment for 20 h in MCF7 cells (left panel), detected using flow cytometry. For quantification of ROS levels (right panel), the values are reported as percentage relative to DMSO treatment group and represent the mean ± SD of three independent experiments. (B) DCF-DA staining for ROS levels upon 20 h PFT-α treatment (20 µM) in MCF7 p53KO cells (upper left panel) and T47D cells (lower left panel). For quantification of ROS levels (right panels), the values are reported as percentage relative to DMSO treatment group and represent the mean ± SD of three independent experiments. (C) DCF-DA staining for ROS levels upon 8 h Doxorubicin (1 µM) with or without addition of PFT-α (20 µM, 12 h pre-treatment) in MCF7 p53KO cells. (D) Crystal violet staining to detect cell viability upon 48 h Doxorubicin treatment (1 µM)) in the presence or absence of PFT-α (20 µM) in both MCF7 and MCF7 p53KO cells.
Figure 4
Figure 4
Activation of AHR/Nrf2 pathway by PFT-α. (A) qPCR to detect mRNA level of CYP1A1, NQO1, HO1 and TRXR1 upon 20 h PFT-α treatment (20 µM) in MCF7 p53KO cells (upper part) and T47D cells (lower part). Relative expression level of CYP1A1 is shown in log2 scale; relative expression level of NQO1, HO1 and TRXR1 are shown as fold change, both normalized with DMSO treatment. All values represent the mean ± SD of two times independent experiments performed in three replicates. (B) Knock-down efficiency of AHR siRNA as detected by qPCR (upper part) and western blot (lower part). Relative expression level is shown as fold change normalized to scramble siRNA. All values represent the mean ± SD of two independent experiments performed in three replicates. (C) DCF-DA staining of ROS levels upon doxorubicin treatment (1 µM, 8 h) with or without PFT-α (20 µM, 12 h pre-treatment) in MCF7 p53KO cells transfected with scramble siRNA and siAHR. For quantification of ROS levels (lower panel), the values are reported as percentage relative to DMSO treatment group. (D) qPCR to detect mRNA level of Nrf2 targets NQO1, HO1 and TRXR1 upon 20 h PFT-α treatment (20 µM) in MCF7 p53KO cells transfected with scramble siRNA and siAHR.
Figure 5
Figure 5
Comparison of PFT-α and NAC on p53 PTMs. (A) qPCR for mRNA levels of BBC3, CDKN1A, MDM2 and PPM1D upon 8 h Nutlin-3 treatment (10 µM) in the presence of NAC (10 mM, 12 h pre-treatment) in MCF7 cells. Relative expression level is reported as fold change relative to DMSO treatment and represents the mean ± SD of three replicates. (B) Western blot to detect the protein level of p53 and p53 p-Ser33 upon 8 h Nutlin-3 treatment (10 µM) in MCF7 cells in the presence of PFT-α (20 µM, 12 h pre-treatment) or NAC (10 mM, 12 h pre-treatment). Densitometric analysis of the bands was performed using ImageJ software, the ratio of p53, p53 p-Ser33/β-actin is normalized to Nutlin-3 treatment group. (C) Resazurin cell viability assay of primary fibroblasts upon NAC or PFT-α treatment for 72 h. The values are reported as relative cell viability normalized to DMSO treatment group and represent the mean ± SD of three replicates.

References

    1. Vogelstein B, Lane D, Levine AJ. Surfing the p53 network. Nature. 2000;408:307–310. doi: 10.1038/35042675. - DOI - PubMed
    1. Haupt Y, Maya R, Kazaz A, Oren M. Mdm2 promotes the rapid degradation of p53. Nature. 1997;387:296–299. doi: 10.1038/387296a0. - DOI - PubMed
    1. Komarova EA. Transgenic mice with p53-responsive lacZ: p53activity varies dramatically during normal development and determines radiation and drug sensitivity invivo. EMBO J. 1997;16:1391–1400. doi: 10.1093/emboj/16.6.1391. - DOI - PMC - PubMed
    1. Komarov P. G. A Chemical Inhibitor of p53 That Protects Mice from the Side Effects of Cancer Therapy. Science. 1999;285(5434):1733–1737. doi: 10.1126/science.285.5434.1733. - DOI - PubMed
    1. Culmsee C, et al. A synthetic inhibitor of p53 protects neurons against death induced by ischemic and excitotoxic insults, and amyloid β-peptide. J. Neurochem. 2001;77:220–228. doi: 10.1046/j.1471-4159.2001.t01-1-00220.x. - DOI - PubMed

Publication types

MeSH terms