

ISOGO: Functional annotation of protein-coding splice variants
- PMID: 31974522
- PMCID: PMC6978412
- DOI: 10.1038/s41598-020-57974-z
ISOGO: Functional annotation of protein-coding splice variants
Abstract
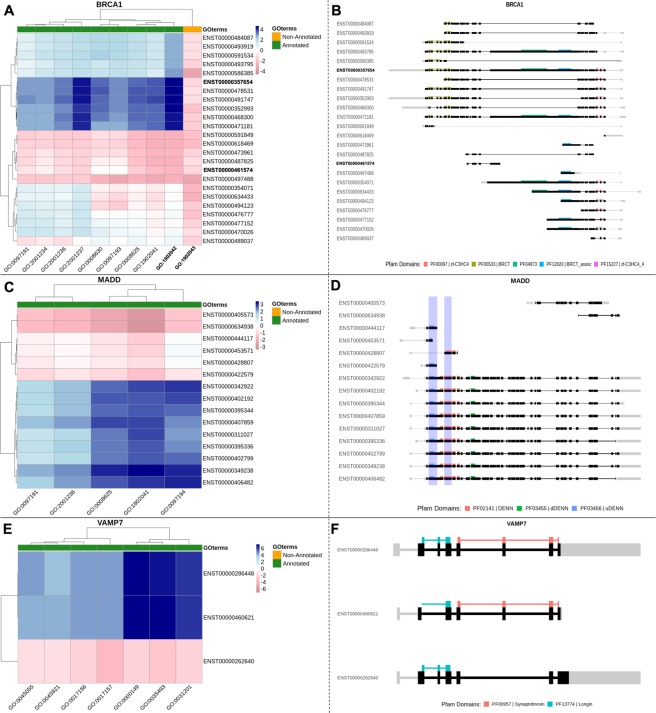
The advent of RNA-seq technologies has switched the paradigm of genetic analysis from a genome to a transcriptome-based perspective. Alternative splicing generates functional diversity in genes, but the precise functions of many individual isoforms are yet to be elucidated. Gene Ontology was developed to annotate gene products according to their biological processes, molecular functions and cellular components. Despite a single gene may have several gene products, most annotations are not isoform-specific and do not distinguish the functions of the different proteins originated from a single gene. Several approaches have tried to automatically annotate ontologies at the isoform level, but this has shown to be a daunting task. We have developed ISOGO (ISOform + GO function imputation), a novel algorithm to predict the function of coding isoforms based on their protein domains and their correlation of expression along 11,373 cancer patients. Combining these two sources of information outperforms previous approaches: it provides an area under precision-recall curve (AUPRC) five times larger than previous attempts and the median AUROC of assigned functions to genes is 0.82. We tested ISOGO predictions on some genes with isoform-specific functions (BRCA1, MADD,VAMP7 and ITSN1) and they were coherent with the literature. Besides, we examined whether the main isoform of each gene -as predicted by APPRIS- was the most likely to have the annotated gene functions and it occurs in 99.4% of the genes. We also evaluated the predictions for isoform-specific functions provided by the CAFA3 challenge and results were also convincing. To make these results available to the scientific community, we have deployed a web application to consult ISOGO predictions (https://biotecnun.unav.es/app/isogo). Initial data, website link, isoform-specific GO function predictions and R code is available at https://gitlab.com/icassol/isogo.
Conflict of interest statement
The authors declare no competing interests.
Figures


Similar articles
-
Genome-Wide Functional Annotation of Human Protein-Coding Splice Variants Using Multiple Instance Learning.J Proteome Res. 2016 Jun 3;15(6):1747-53. doi: 10.1021/acs.jproteome.5b00883. Epub 2016 May 9. J Proteome Res. 2016. PMID: 27142340
-
Isoform function prediction based on bi-random walks on a heterogeneous network.Bioinformatics. 2020 Jan 1;36(1):303-310. doi: 10.1093/bioinformatics/btz535. Bioinformatics. 2020. PMID: 31250882
-
APPRIS: annotation of principal and alternative splice isoforms.Nucleic Acids Res. 2013 Jan;41(Database issue):D110-7. doi: 10.1093/nar/gks1058. Epub 2012 Nov 17. Nucleic Acids Res. 2013. PMID: 23161672 Free PMC article.
-
Exploring the functional impact of alternative splicing on human protein isoforms using available annotation sources.Brief Bioinform. 2019 Sep 27;20(5):1754-1768. doi: 10.1093/bib/bby047. Brief Bioinform. 2019. PMID: 29931155 Free PMC article. Review.
-
Functional impact of splice isoform diversity in individual cells.Biochem Soc Trans. 2016 Aug 15;44(4):1079-85. doi: 10.1042/BST20160103. Biochem Soc Trans. 2016. PMID: 27528755 Free PMC article. Review.
Cited by
-
Genetic Variants in Transcription Factor Binding Sites in Humans: Triggered by Natural Selection and Triggers of Diseases.Int J Mol Sci. 2021 Apr 18;22(8):4187. doi: 10.3390/ijms22084187. Int J Mol Sci. 2021. PMID: 33919522 Free PMC article. Review.
-
Predicting the Structural Impact of Human Alternative Splicing.bioRxiv [Preprint]. 2023 Dec 24:2023.12.21.572928. doi: 10.1101/2023.12.21.572928. bioRxiv. 2023. PMID: 38187531 Free PMC article. Preprint.
-
FINER: enhancing the prediction of tissue-specific functions of isoforms by refining isoform interaction networks.NAR Genom Bioinform. 2021 Jun 22;3(2):lqab057. doi: 10.1093/nargab/lqab057. eCollection 2021 Jun. NAR Genom Bioinform. 2021. PMID: 34169280 Free PMC article.
-
Expression and splicing mediate distinct biological signals.BMC Biol. 2023 Oct 20;21(1):220. doi: 10.1186/s12915-023-01724-w. BMC Biol. 2023. PMID: 37858135 Free PMC article.
-
Transcriptomics in the era of long-read sequencing.Nat Rev Genet. 2025 Mar 28. doi: 10.1038/s41576-025-00828-z. Online ahead of print. Nat Rev Genet. 2025. PMID: 40155769 Review.
References
Publication types
MeSH terms
Substances
LinkOut - more resources
Full Text Sources
Other Literature Sources
Miscellaneous
