

Dynamics of strand slippage in DNA hairpins formed by CAG repeats: roles of sequence parity and trinucleotide interrupts
- PMID: 31974547
- PMCID: PMC7049705
- DOI: 10.1093/nar/gkaa036
Dynamics of strand slippage in DNA hairpins formed by CAG repeats: roles of sequence parity and trinucleotide interrupts
Abstract
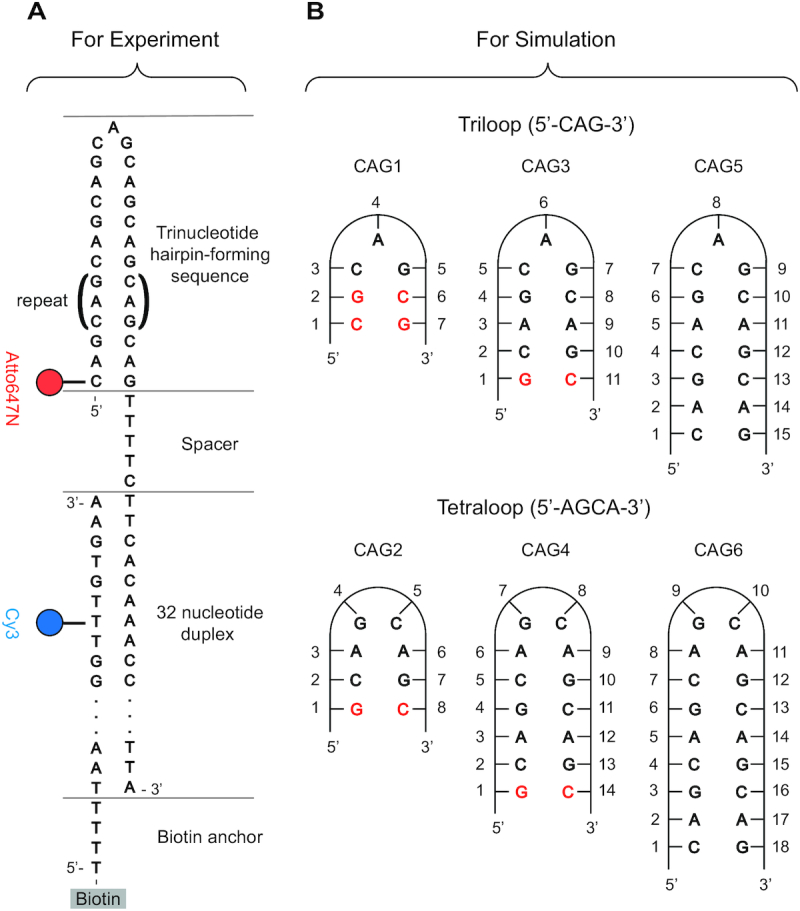
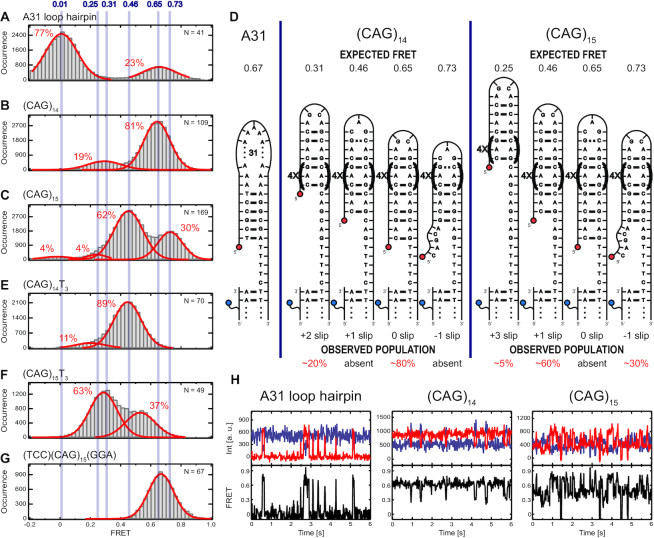
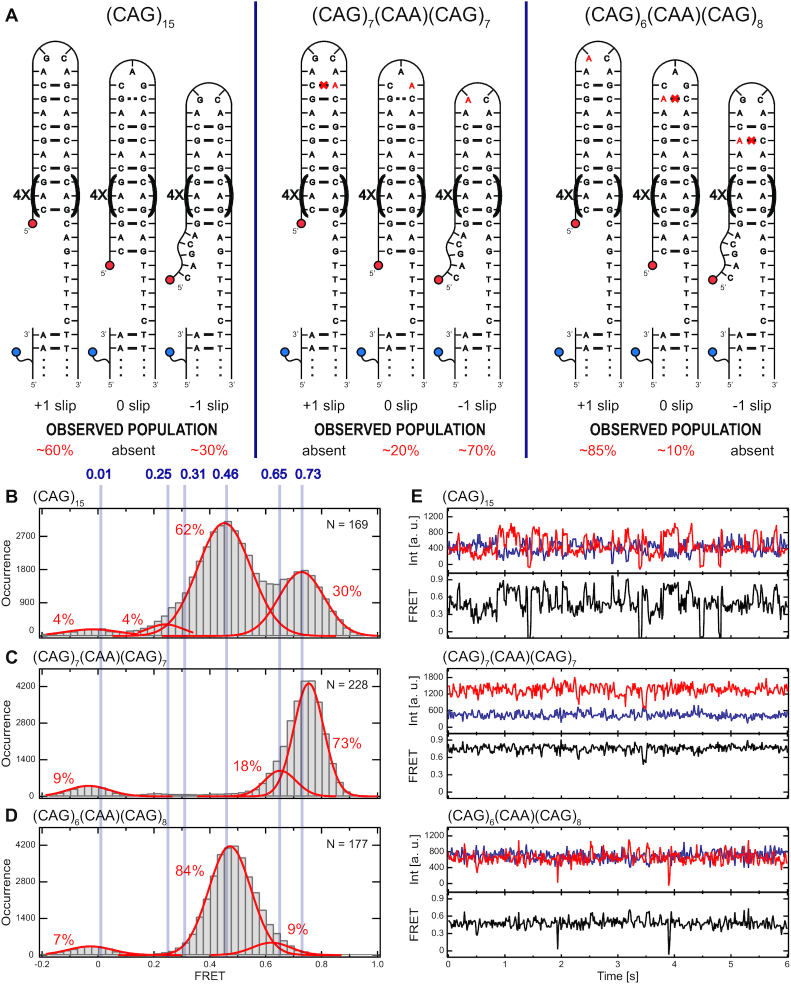
DNA trinucleotide repeats (TRs) can exhibit dynamic expansions by integer numbers of trinucleotides that lead to neurodegenerative disorders. Strand slipped hairpins during DNA replication, repair and/or recombination may contribute to TR expansion. Here, we combine single-molecule FRET experiments and molecular dynamics studies to elucidate slipping dynamics and conformations of (CAG)n TR hairpins. We directly resolve slipping by predominantly two CAG units. The slipping kinetics depends on the even/odd repeat parity. The populated states suggest greater stability for 5'-AGCA-3' tetraloops, compared with alternative 5'-CAG-3' triloops. To accommodate the tetraloop, even(odd)-numbered repeats have an even(odd) number of hanging bases in the hairpin stem. In particular, a paired-end tetraloop (no hanging TR) is stable in (CAG)n = even, but such situation cannot occur in (CAG)n = odd, where the hairpin is "frustrated'' and slips back and forth between states with one TR hanging at the 5' or 3' end. Trinucleotide interrupts in the repeating CAG pattern associated with altered disease phenotypes select for specific conformers with favorable loop sequences. Molecular dynamics provide atomic-level insight into the loop configurations. Reducing strand slipping in TR hairpins by sequence interruptions at the loop suggests disease-associated variations impact expansion mechanisms at the level of slipped hairpins.
© The Author(s) 2020. Published by Oxford University Press on behalf of Nucleic Acids Research.
Figures

Similar articles
-
Frustration Between Preferred States of Complementary Trinucleotide Repeat DNA Hairpins Anticorrelates with Expansion Disease Propensity.J Mol Biol. 2023 May 15;435(10):168086. doi: 10.1016/j.jmb.2023.168086. Epub 2023 Apr 5. J Mol Biol. 2023. PMID: 37024008 Free PMC article.
-
Structural and Dynamical Properties of Nucleic Acid Hairpins Implicated in Trinucleotide Repeat Expansion Diseases.Biomolecules. 2024 Oct 10;14(10):1278. doi: 10.3390/biom14101278. Biomolecules. 2024. PMID: 39456210 Free PMC article. Review.
-
Structure of even/odd trinucleotide repeat sequences modulates persistence of non-B conformations and conversion to duplex.Biochemistry. 2011 May 31;50(21):4441-50. doi: 10.1021/bi200397b. Epub 2011 May 4. Biochemistry. 2011. PMID: 21526744 Free PMC article.
-
Structure and dynamics in DNA looped domains: CAG triplet repeat sequence dynamics probed by 2-aminopurine fluorescence.Biochemistry. 2007 Sep 25;46(38):10756-66. doi: 10.1021/bi7005674. Epub 2007 Aug 25. Biochemistry. 2007. PMID: 17718541
-
Molecular conformations and dynamics of nucleotide repeats associated with neurodegenerative diseases: double helices and CAG hairpin loops.Comput Struct Biotechnol J. 2021 Apr 26;19:2819-2832. doi: 10.1016/j.csbj.2021.04.037. eCollection 2021. Comput Struct Biotechnol J. 2021. PMID: 34093995 Free PMC article. Review.
Cited by
-
Odd-even disparity in the population of slipped hairpins in RNA repeat sequences with implications for phase separation.Proc Natl Acad Sci U S A. 2023 Jun 13;120(24):e2301409120. doi: 10.1073/pnas.2301409120. Epub 2023 Jun 5. Proc Natl Acad Sci U S A. 2023. PMID: 37276412 Free PMC article.
-
Can MSH3 lowering stop HTT repeat expansion in its CAG tract?Mol Ther. 2023 Jun 7;31(6):1509-1511. doi: 10.1016/j.ymthe.2023.05.010. Epub 2023 May 25. Mol Ther. 2023. PMID: 37236185 Free PMC article. No abstract available.
-
Profiling human pathogenic repeat expansion regions by synergistic and multi-level impacts on molecular connections.Hum Genet. 2023 Feb;142(2):245-274. doi: 10.1007/s00439-022-02500-6. Epub 2022 Nov 7. Hum Genet. 2023. PMID: 36344696 Free PMC article.
-
Stability of the CAG Tract in the ATXN2 Gene Depends on the Localization of CAA Interruptions.Biomedicines. 2024 Jul 24;12(8):1648. doi: 10.3390/biomedicines12081648. Biomedicines. 2024. PMID: 39200113 Free PMC article.
-
Frustration Between Preferred States of Complementary Trinucleotide Repeat DNA Hairpins Anticorrelates with Expansion Disease Propensity.J Mol Biol. 2023 May 15;435(10):168086. doi: 10.1016/j.jmb.2023.168086. Epub 2023 Apr 5. J Mol Biol. 2023. PMID: 37024008 Free PMC article.
References
-
- Ellegren H. Microsatellites: simple sequences with complex evolution. Nat. Rev. Genet. 2004; 5:435–445. - PubMed
-
- Orr H.T., Zoghbi H.Y.. Trinucleotide repeat disorders. Annu. Rev. Neurosci. 2007; 30:575–621. - PubMed
-
- Giunti P., Sweeney M.G., Spadaro M., Jodice C., Novelletto A., Malaspina P., Frontali M., Harding A.E.. The trinucleotide repeat expansion on chromosome 6p (SCA1) in autosomal dominant cerebellar ataxias. Brain. 1994; 117:645–649. - PubMed
-
- Wells R.D., Warren S.T. Genetic Instabilities and Hereditary Neurological Diseases. 1998; San Diego, CA: Academic Press.
Publication types
MeSH terms
Substances
Grants and funding
LinkOut - more resources
Full Text Sources
