. 2020 Jun 11;71(11):3323-3339.
doi: 10.1093/jxb/eraa039.

Endomembrane architecture and dynamics during secretion of the extracellular matrix of the unicellular charophyte, Penium margaritaceum

Affiliations

Endomembrane architecture and dynamics during secretion of the extracellular matrix of the unicellular charophyte, Penium margaritaceum

David S Domozych et al. J Exp Bot. .

Abstract

The extracellular matrix (ECM) of many charophytes, the assemblage of green algae that are the sister group to land plants, is complex, produced in large amounts, and has multiple essential functions. An extensive secretory apparatus and endomembrane system are presumably needed to synthesize and secrete the ECM, but structural details of such a system have not been fully characterized. Penium margaritaceum is a valuable unicellular model charophyte for studying secretion dynamics. We report that Penium has a highly organized endomembrane system, consisting of 150-200 non-mobile Golgi bodies that process and package ECM components into different sets of vesicles that traffic to the cortical cytoplasm, where they are transported around the cell by cytoplasmic streaming. At either fixed or transient areas, specific cytoplasmic vesicles fuse with the plasma membrane and secrete their constituents. Extracellular polysaccharide (EPS) production was observed to occur in one location of the Golgi body and sometimes in unique Golgi hybrids. Treatment of cells with brefeldin A caused disruption of the Golgi body, and inhibition of EPS secretion and cell wall expansion. The structure of the endomembrane system in Penium provides mechanistic insights into how extant charophytes generate large quantities of ECM, which in their ancestors facilitated the colonization of land.

Keywords: Penium; Charophyte; Golgi body; endomembrane system; extracellular matrix; tomography.


Figures

Fig. 1.
Fig. 1.
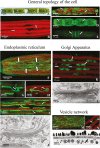
General topology of Penium as shown by differential interference contrast microscopy (A), confocal laser scanning microscopy (CLSM) (B–I), (K), (M), and (N), and TEM (J), (L), and (O). (A) A typical Penium cell highlighting its cylindrical shape, its nucleus (N) situated in the central isthmus zone and 2–4 chloroplasts (C). (B) Chlorophyll autofluorescence of the multilobed chloroplasts and the associated narrow cytoplasmic valleys (arrows). (C) CFDA labeling of the cytoplasm (arrows) in the valleys between the chloroplast lobes (in green). (D) Rhodamine–phalloidin labeling highlighting actin bundles (arrows) in the peripheral cytoplasm. (E) Anti-tubulin labeling revealing bands of microtubules (arrows) at the isthmus zone. (F) DIOC6(3) labeling of the endoplasmic reticulum (ER) (arrows) found in the cytoplasmic channels. (G) DIOC6(3) labeling showing the branched nature of the ER (arrow). (H) DIOC6(3) labeling showing the flattening of ER tubules into plate-like structures (arrow). (I) DIOC6(3) labeling revealing the close physical proximity of the ER (arrows) to the chloroplast (red). (J) The close proximity of the ER (arrows) to the chloroplast envelope (Cp) and cis (C) face of a Golgi body. The trans face (T) and trans-Golgi network (TGN) are also apparent. (K) MDY-64 labeling of Golgi bodies (arrows) found in cytoplasmic valleys created by the chloroplast lobes (red). (L) Golgi body showing the distinct cis (C), trans (T), and TGN regions. Golgi bodies measure 2–3 μm from cisternal stack edge to edge (line). (M) Lysotracker labeling of a pool of large vesicles (green) in the cortical cytoplasm. (N) Lysotracker labeling of the large fluorescent vesicles that occasionally contain an unstained punctate center (arrows). (O) The cortical cytoplasm revealing both large (white arrows) EPS-carrying vesicles and small (black arrow) vesicles. Note the unlabeled zones in several of the large vesicles.
Fig. 2.
Fig. 2.
The ultrastructure of the cell and endomembrane architecture. (A) Cell cross-section. The multilobed chloroplast with a pyrenoid (Py) and 16 cytoplasmic valleys (arrows), in which the ER and Golgi are positioned. (B) Magnified view of cytoplasmic valleys, each containing a mitochondrion (black arrows) at the base. Golgi bodies (*) positioned in the mid-valley regions and Golgi-derived vesicles (white arrows) in the cortical region. (C) Longitudinal view of a cell showing Golgi bodies (arrows) forming long networks in the cytoplasmic valleys. (D) Golgi body architecture, with a stack of 12–15 cisternae. The cis face cisternae (C) have wide unstained (i.e. little or osmium binding or electron density) lumens. The medial (M) and trans (T) face cisternae have narrow stained (notable osmium labeling) lumens.
Fig. 3.
Fig. 3.
TEM images showing ultrastructure of the endomembrane system. (A) The trans-Golgi network (TGN; white arrows) located at the trans face (T) of the Golgi body. The TGN appear to be derived from terminal trans cisternae that curl inward (black arrows). The cis (C) face is also apparent. (B) Magnified view of the TGN, with multiple coated (black arrows) and uncoated blebs (white arrows). (C) Magnified view of the medial–trans region of the cisternal stack. The electron-dense labeling of the peripheries (white arrows) are indicated. The TGN did not contain electron-dense label and had an open lumen (black arrow). (D) TGN removed from the trans face (T) of the Golgi body. The cis face (C) was also apparent. Scale bar=600 nm. (E) Surface view of a trans face cisterna (*). Swellings that are destined to bleb off as vesicles on the peripheral edges (arrows) of the cisterna are highlighted. (F) Emergence of large extracellular polysaccharide (EPS) vesicles (arrows) from one side of the Golgi bodies. (G) Magnified image of two Golgi bodies (Gb) in a cell producing EPS. The cisternae of the individual Golgi bodies are attached (arrows). (H) Surface view of cisternae from two different Golgi bodies (arrows) attached via a large vesicle (*). (I) The cortical cytoplasm showing large EPS vesicles (*), smaller vesicles (white arrows), and the interspersed microfilaments (black arrows) in the cortical cytoplasm. (J) Microfilament bundles (arrows) in the cortical cytoplasm.
Fig. 4.
Fig. 4.
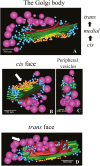
Electron tomography of the Golgi body. (A) Overview of a Golgi body. The Golgi body is surrounded by pools of small vesicles at the cisternal peripheries (blue) and at the cis face (yellow vesicles). Large extracellular polysaccharide (EPS) vesicles are present at the post-trans region and on one side (purple). Note that the EPS vesicles are found on one side of the Golgi body. (B) View of the cis face (arrow) showing the small vesicles (yellow) at the pre-cis area. These vesicles are transition vesicles that interface the Golgi body with the ER. (C) View of the periphery of a Golgi body producing large vesicles. (D) View of the trans face (arrow) showing the large number of large and small vesicles.
Fig. 5.
Fig. 5.
Immunogold labeling and TEM of the Golgi body. (A) Labeling of the Golgi body with an anti-arabinogalactan protein (AGP) mAb, JIM13. The label is seen throughout the Golgi, with a greater concentration of gold particles (black particles or arrows) at the trans face (T). The cis face (C) is also apparent. (B) JIM13 labeling of the trans-Golgi network (TGN, arrow). (C) Anti-rhamnogalacturonan (RG)-I mAb, INRA-RU1, labeling (arrows) of the cisternal peripheries and TGN. (D) Co-labeling of a Golgi body with JIM13 (black arrows) and INRA-RU1 (white arrows). (E) Anti-RG-I labeling with the CCRC-M80 mAb. The label (arrows) is more prevalent at the trans face (T). (F) Anti- extracellular polysaccharide (EPS) labeling of large Golgi-derived vesicles (arrows). (G) Control (primary antibody was omitted). (H) Anti-EPS labeling of large vesicles (arrows) in the cortical cytoplasm. (I) JIM13 labeling (arrow) of a small vesicle in the cortical cytoplasm. (J) INRA-RU1 labeling (arrow) of small vesicles in the cortical cytoplasm.
Fig. 6.
Fig. 6.
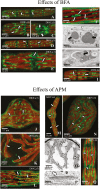
Experimental manipulation of the endomembrane system, as shown by CLSM (A–E), (I–J), (M), (N), and (Q), and TEM (G), (H), (O), and (P). (A) Disruption of the endoplasmic reticulum (ER) network after 2 h treatment with 1 μM brefeldin A (BFA), followed by DIOC6(3) labeling. The elongate tubules transformed into short segments (arrows). (B) Magnified view of the flattened segments of ER (arrows) in cells treated with 1 μM BFA for 2 h, followed by DIOC6(3) labeling. (C) 4 h of treatment with BFA resulted in complete disruption of the ER into small circular segments (arrows), visualized by DIOC6(3). (D) BFA treatment for 6 h resulted in small circular segments (arrows) filling the cytoplasmic valleys, visualized by DIOC6(3). Scale bar=12 μm. (E) After 4 h of recovery, the tubular elements of the ER began to reform (arrows), visualized by DIOC6(3). Scale bar=5.8 μm. (F) MDY-64 labeling of a cell treated with BFA for 2 h showing Golgi bodies transformed into irregular, curled entities (arrows). Scale bar=11 μm. (G) Golgi body in a cell treated for 2 h with BFA. The cis face (C) consisted of a few cisternae and subtended a network of cisternae/large vacuoles (arrows) at the trans face (T). Scale bar=700 nm. (H) Unusual membranous mass (arrow) found in the subcortical cytoplasm after a 2 h BFA treatment. Scale bar=700 nm. (I) Golgi bodies returning to a normal morphology and positioning in the cytoplasmic valleys after 2 h of recovery, visualized by MDY-64 (arrows). Scale bar=9.1 μm. (J) Disruption of the ER network into short segments of flattened tubules (arrows) in cells treated with APM for 12 h, visualized by DIOC6(3). Scale bar=7.7 μm. (K) Magnified view of altered ER segments (arrows) showing close proximity to the chloroplast envelope in a cell treated with APM for 24 h, visualized by DIOC6(3). Scale bar=6 μm. (L) Long ER tubules (arrows) reformed after 12 h of recovery, visualized by DIOC6(3). Scale bar=10 μm. (M) Swelling at the isthmus and Golgi bodies (green) still positioned in the cytoplasmic valleys after 12 h APM treatment, visualized by MDY-64. Scale bar=15 μm. (N) Irregularly positioned Golgi bodies (green) in the swollen isthmus zone after APM treatment for 24 h. Scale bar=12.75 μm. (O) Golgi body structure (arrowhead) showing close proximity to the chloroplast lobes in the swollen isthmus after APM treatment. Scale bar=2.8 μm. (P) Golgi body (arrowhead) showing similar architecture to untreated cells after APM treatment. Scale bar=420 nm. (Q) After 8 h of recovery, the cell reformed into its cylindrical shape and Golgi bodies position in the cytoplasmic valleys. Scale bar=12.7 μm.
Fig. 7.
Fig. 7.
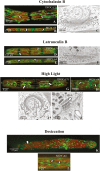
Experimental manipulation of the endomembrane system as shown by CLSM (A), (B), (D), (E), (G), (H), (K), and (L), and TEM (C), (F), (I), and (J). (A) Upon treatment with 5 μg ml–1 CB for 24 h, the endoplasmic reticulum (ER) network of long tubules (arrows) remains, as visualized by DIOC6(3). (B) CB treatment does not alter the morphology or positioning of Golgi bodies (arrows), visualized by MDY-64. (C) TEM image of a Golgi body from a cell treated with CB. (D) Treatment with 5 μM LatB did not result in a notably disturbed ER tubule network (arrows), visualized by DIOC6(3). (E) LatB treatment did not alter the positioning of Golgi bodies (arrows), visualized by MDY-64. (F) Unaltered Golgi body from a LatB-treated cell. (G) Flattened ER (arrows), which is absent in the vacuolar zone between the chloroplast and at the isthmus, in cells grown under high light, visualized by DIOC6(3). The positioning of parallel ER tubes is maintained. (H) High light treatment does not alter the positioning of the Golgi bodies (arrows) as shown by MDY-64 labeling. (I) Golgi body under high light conditions, showing notable curling but general preservation of architecture. (J) Golgi body under high light conditions, showing large swellings that yield extracellular polysaccharide (EPS) vesicles (arrows). (K) Under desiccation conditions, the ER network (arrows) transforms into small segments as seen using DIOC6(3). (L) Under desiccation conditions, the Golgi bodies (arrows) remained in the cytoplasmic valleys, visualized by MDY-64
Fig. 8.
Fig. 8.
(A) Venn diagram showing the number of hits and their overlap when searching the Penium protein database using AtRABF2a, AtRABG3b, or AtRAC10 as queries. The diagram was made using the online tool at: http://bioinformatics.psb.ugent.be/webtools/Venn/. (B) Summary of the number of predicted proteins in Penium with homologs in A. thaliana, associated with vesicle selection/docking and membrane fusion. Penium homologs in A. thaliana (AT) were identified based on queries in a local BLAST search (<1e-5) of GenBank (www.ncbi.nlm.nih.gov/genbank/). * indicates an overlap in the retrieved gene lists. ** indicates a cut-off of <1e-15, used due to the presence of a high proportion of repetitive sequence. The last column gives literature references for the number of members in the A. thaliana family.
Fig. 9.
Fig. 9.
Model of the secretory apparatus of Penium. A total of 150–200 Golgi bodies align in linear fields deep in the cytoplasmic valleys created by the chloroplast lobes. The Golgi bodies sit above endoplasmic reticulum (ER) that is closely associated with the chloroplast envelope. Elongate mitochondria are also present in this valley. Based on the immunogold labeling of this study, we believe that some Golgi bodies process wall precursors while others process the EPS. In EPS-producing Golgi bodies, EPS vesicle formation appears on only one side of the cisternal stack. In hypersecretion phases (e.g. cells grown under high light), Golgi bodies appear fused. Golgi-derived vesicles move to the cortical cytoplasm where they are transported around the cell via cytoplasmic streaming. The cortical cytoplasm contains large amounts of actin microfilament bundles. Wall precursor vesicles are ultimately delivered to the isthmus zone where bands of microtubules and microfilaments line the expansion zone. EPS vesicles are sent to various regions of the cell periphery for subsequent EPS release. These zones are transient and change in response to environmental cues.

Similar articles

Cited by

References

    1. Akkerman M, Overdijk EJ, Schel JH, Emons AM, Ketelaar T. 2011. Golgi body motility in the plant cell cortex correlates with actin cytoskeleton organization. Plant & Cell Physiology 52, 1844–1855. - PubMed
    1. Ali O, Traas J. 2016. Force-driven polymerization and turgor-induced wall expansion. Trends in Plant Science 21, 398–409. - PubMed
    1. Barlow LD, Dacks JB. 2018. Seeing the endomembrane system for the trees: evolutionary analysis highlights the importance of plants as models for eukaryotic membrane-trafficking. Seminars in Cell & Developmental Biology 80, 142–152. - PubMed
    1. Bashline L, Lei L, Li S, Gu Y. 2014. Cell wall, cytoskeleton, and cell expansion in higher plants. Molecular Plant 7, 586–600. - PubMed
    1. Becker B, Marin B. 2009. Streptophyte algae and the origin of embryophytes. Annals of Botany 103, 999–1004. - PMC - PubMed

Publication types

Substances