. 2020 Apr 6;48(6):e32.
doi: 10.1093/nar/gkaa042.

Measuring mRNA translation in neuronal processes and somata by tRNA-FRET

Affiliations

Measuring mRNA translation in neuronal processes and somata by tRNA-FRET

Bella Koltun et al. Nucleic Acids Res. .

Abstract

In neurons, the specific spatial and temporal localization of protein synthesis is of great importance for function and survival. Here, we visualized tRNA and protein synthesis events in fixed and live mouse primary cortical culture using fluorescently-labeled tRNAs. We were able to characterize the distribution and transport of tRNAs in different neuronal sub-compartments and to study their association with the ribosome. We found that tRNA mobility in neural processes is lower than in somata and corresponds to patterns of slow transport mechanisms, and that larger tRNA puncta co-localize with translational machinery components and are likely the functional fraction. Furthermore, chemical induction of long-term potentiation (LTP) in culture revealed up-regulation of mRNA translation with a similar effect in dendrites and somata, which appeared to be GluR-dependent 6 h post-activation. Importantly, measurement of protein synthesis in neurons with high resolutions offers new insights into neuronal function in health and disease states.


Figures

Figure 1.
Figure 1.
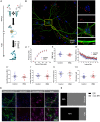
Differential distribution of tRNA in neurons and glial cells in cortical primary culture. (A–C). Neurons in cortical co-culture transfected with labeled tRNA maintain function and morphology. (A) Schematic illustration of introducing fluorescently labeled tRNA to cortical primary culture. Labeled tRNA (4 nM) was mixed with a transfection reagent (PolyJet™) and dripped onto cells after a short incubation period (15 min). tRNA distribution was viewed after 48 h under a microscope. (B) Viable neuronal culture transfected with labeled tRNA. Representative images of a neuronal-glial co-culture stained with Map2 antibody (green) and DAPI (blue) with magnification of (I) neuronal processes and (II) somata, demonstrating fluorescently-labeled tRNA (red). (C) Basic neuronal intrinsic properties are maintained following application of labeled tRNA. Several active and passive electrophysiological intrinsic properties were measured in brain slices transfected with fluorescently-labeled tRNA. No differences were observed between tRNA treated and control neurons in any of the properties examined. (I) Firing frequency during 500 ms-long pulses of depolarizing current injections; (II) RMP – resting membrane potential; (III) normalized instantaneous firing frequencies as a function of interspike interval for the first 38 interspike intervals; (IV) input resistance; (V) firing threshold; (VI) membrane time constant; (VII) Rheobase. n(tRNA treated cells) = 14, n(control cells) = 14 (both obtained from three mice). Data are represented as mean ± SEM (P > 0.05). The majority of labeled tRNA is co-localized with rER in glial cells but not in neurons in mouse primary co-culture. (D) Representative images of immunocytochemical staining for rough ER in neurons and glial cells. Immunostaining of neurons (Map2; green; top rowand glial cells (GFAP; green; top row) in cortical co-culture transfected with Cy3-tRNA with Calreticulin, a marker for rER E. Quantification of degree of co-localization between Cy3-tRNA and Calreticulin collected from images in (D), presented as bar diagrams.
Figure 2.
Figure 2.
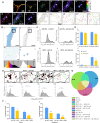
tRNA velocity in live primary cortical culture indicates slow transport rather than free diffusion as well as differential dynamics in somata and neuronal processes. (A) tRNA velocity in dendrites and axons is lower compared to somata and glia. Histograms of mean velocities (nm/s) of tRNA puncta in (I) somata, (II) dendrites and (III) glial cells, measured at 4 time points within constant ROIs in three representative monitored frames. t0 = 0–30 min, t1 = 30–60 min, t2 = 60–90 min, t3 = 90–120 min. Puromycin added at t1 and washed out at t2. (B) tRNA puncta dissociate following puromycin treatment as measured by light microscopy. Histograms of puncta size frequencies (measured as multiplications of the smallest detectable signal, termed signal units) in (I) somata, (II) dendrites and (III) glial cells, measured at 4 time points within constant ROIs in three representative monitored frames. t0 = 0–30 min, t1 = 30–60 min, t2 = 60–90 min, t3 = 90–120 min. Puromycin added at t1 and washed out at t2. Dotted line marks the number of puncta ≤2 signal units at t0 at each examined compartment (I’–III’). Magnifications of puncta size frequencies ≥8 signal units at t0 and t3 in somata, dendrites and glial cells, respectively. (B') tRNA puncta dissociate following puromycin treatment as measured by direct STochastic Optical Reconstruction Microscopy (dSTORM). (I–II) Histograms of tRNA puncta in somata (I) under basal conditions; mean = 9120.1 nm2, SD = 2.95 nm2, median = 4786.3 nm2, IQR 3981.1–19952.6 nm2; (II) following puromycin addition; mean = 5623.4 nm2, SD = 4.4 nm2, median = 5623.4 nm2, IQR 1995.3–15848.9 nm2; (III–IV) Histograms of tRNA puncta in dendrites (III) under basal conditions; mean = 7079.5 nm2, SD = 4.07 nm2, median = 6025.6 nm2, IQR 2398.8–19054.6 nm2; (IV) following puromycin addition; mean = 6606.9 nm2, SD = 4.6 nm2, median = 6760.8 nm2, IQR 1995–19952.6 nm2. Blue bars represent the distribution of the tRNA puncta sizes. Red vertical lines represent the median; plus signs indicate the mean of the distribution.
Figure 3.
Figure 3.
tRNA is bi-directionally transported in dendrites. (A) Still image capture of live neurons. Images of neuronal co-culture stained with NeuO NeuroFluor live neuronal dye and transfected with Cy3-tRNA (I – NeuO, II – Cy3-tRNA, III – merge). (B) tRNA is transported in dendrites. Kymograph of tRNA movement within dendrites over a 10-minute period. Images acquired at 6-second intervals. (C) tRNA in dendrites is transported in both anterograde and retrograde directions. (I–X) Representative captures of displacement of tRNA puncta in 1-minute intervals over a period of 10 min. tRNA puncta are represented in red or green, depending on the direction of movement along the dendrite. (XI) Overlay of images I–X.
Figure 4.
Figure 4.
A fraction of fluorescently labeled tRNA is associated with the assembled ribosome as measured in neurons by single molecule based localization microscopy (SMLM). (A) Nanoscale organization of translation. (I) Map2-positive neuron; (II) SMLM of rpS6 (red), rpL10a (green) and tRNA (blue); (III) magnification of ROI in a dendrite; (IV) rpS6; (V) rpL10a; (VI) tRNA; (VII–IX) Semi-automated detection of signals differently outlined for staining of rpS6, rpL10a, and tRNA; (X) 3-color overlay of the segments obtained in VII-IX; (XI-XIV) magnification of 4 ROI in picture X. (B) Ribosomal proteins can be separated into two sub-populations based on localization density. (I–II) Diffuse (I) and clustered (II) regions of rpL10a in a representative dendrite. (III–IV) Magnification of ROI of diffuse (III) and clustered (IV) rpL10a. (V–VI) Distribution diagrams of density of localizations of rpL10a labeling. Vertical lines define the boundaries of the diffuse (V) and clustered (VI) regions. Scale bars: 2 μm, 250 nm. Diffuse: ≤ 40 localizations per nm2; clustered: ≥40 localizations per nm2. (C) Puromycin treatment leads to a decrease in diffuse pools of rpL10a and rpS6(I) Distribution of localization density of rpL10a under basal conditions. Total number of counts = 1 268 723. (II) Puromycin treatment. Total number of counts = 536 530. (III) Distribution of localization density of rpS6 under basal conditions. Total number of counts = 2 056 885. (IV) Puromycin treatment. Total number of counts = 765 686. Loc = localizations (D). Puromycin treatment leads to decreased overlap of diffuse pools of rpL10a and rpS6 only. Fractional overlap between (I) clustered rpL10a and diffuse rpS6, and clustered rpS6 and diffuse rpL10a, and (II) clustered rpS6 and rpL10a, and diffuse rpS6 and rpL10a, under basal conditions and after addition of puromycin. n = 15 different captured regions from three biologically independent repeats. ** P < 0.01 (E). Larger tRNA puncta more commonly associate with L10a and rpS6 than smaller puncta. (I) ROIs of thresholded tRNA puncta. (II–IV) Transfer of ROIs from I to rpL10a, rpS6 and the overlapping regions of rpL10a and rpS6, respectively. Red = overlap, green = no overlap. Scale bar: 500 nm. (V) Logarithmic scale plot of total area of tRNA. Mean = 7079.5 nm2, SD = 4.07 nm2, median = 6025.6 nm2, IQR 2398.8–19054.6 nm2; (VI–IX) Logarithmic scale plots of total area of overlap in II–IV, respectively. (VI) Mean = 8317.6 nm2, SD = 4.07 nm2, median = 7585.8 nm2, IQR 2818.4–25118.8 nm2; (VII) Mean = 7943.3 nm2, SD = 4.17 nm2, median = 7244.4 nm2, IQR 2754.2–22387.2 nm2; (VIII) Mean = 10715.2 nm2, SD = 3.72 nm2, median = 11481.5 nm2, IQR 3981.1–25118.9 nm2. Blue bars = distribution of the tRNA puncta sizes. Red vertical lines = median; plus signs = mean of the distribution. (F) Puromycin treatment reduces the association of rpL10a, rpS6 and tRNA. Fractional overlap of rpL10a and rpS6 alone and together with tRNA puncta in (I) somata and (II) dendrites under basal conditions and following puromycin application. n = 22 different captured regions (somata) and 14 different captured regions (dendrites) from three biologically independent repeats. * P < 0.05; ** P < 0.01; *** P < 0.001 (G). A schematic summary of results. Diffuse fractions of rpL10a and rpS6 are found to overlap with each other as well as with large tRNA puncta, whereas clustered regions of rpL10a and rpS6, as well as small tRNA puncta, are not found to be in co-localization.
Figure 5.
Figure 5.
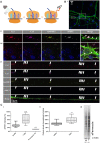
Levels of mRNA translation are negatively correlated with ex vivo developmental stage of neuronal primary culture. (A) Schematic diagram of monitoring active mRNA translation. The FRET method utilizes tRNA pairs labeled as FRET donor (Cy3) and acceptor (Cy5) pairs and exploits the proximity of the tRNA molecules in the ribosomal A and P sites, as well as the temporal overlap, which are obligatory for the reaction to take place and enable monitoring active translation. (B) mRNA translation takes place throughout the neuron. Representative image of (I) a Map2-positive neuron transfected with Cy3- and Cy5-labeled tRNA. (II) Magnification of a representative dendrite. (III) Magnification of the soma. (IV) Representative image of an axon infected with 488-CTX. White arrows indicate locations of active translation reported as FRET events. (C) mRNA translation levels are higher in young culture. (I) cFRET signal intensity is higher in neurons in young culture (7 DIV) compared to mature culture (14 DIV). The signal was reduced below baseline after application of 50 μM puromycin for 10 min. **** P < 0.0001; n = 50–80 neurons per condition. (II) Puromycin incorporation levels are higher in young culture compared to mature culture. (III) Representative western blot of whole cell lysates of young and mature culture. ** P < 0.01; n = 3.
Figure 6.
Figure 6.
cLTP activation induces mRNA translation up-regulation in neuronal processes and somata. (A) Arc-dVenus detection after 6 hours reports successful induction of cLTP. Representative images of an Arc-dVenus positive neuron stained with Map2 6 h post activation. (B) cLTP induces mRNA translation up-regulation both in soma and dendrites. Summary of cFRET intensity at baseline, 4 and 6 h following cLTP activation, as well as 6 h post-activation after application of GluR antagonists 30 min prior to activation, in neuronal somata and dendrites. Up-regulation detected at 6 h post activation. All comparisons are to t = 0 h. **** P < 0.0001; n ≥ 585 cells per condition. (C) Level of cFRET intensity in somata and dendrites remains unchanged over all time points and following application of GluR antagonists. Ratio of cFRET intensity in soma and dendrites at baseline, 4 and 6 h following cLTP activation, as well as 6 h post-activation after application of GluR antagonists 30 min prior to activation.

References

    1. Holt C.E., Schuman E.M.. The central dogma decentralized: new perspectives on RNA function and local translation in neurons. Neuron. 2013; 80:648–657. - PMC - PubMed
    1. Kapur M., Monaghan C.E., Ackerman S.L.. Regulation of mRNA translation in neurons—a matter of life and death. Neuron. 2017; 96:616–637. - PMC - PubMed
    1. Rangaraju V., tom Dieck S., Schuman E.M.. Local translation in neuronal compartments: how local is local. EMBO Rep. 2017; 18:693–711. - PMC - PubMed
    1. Tahmasebi S., Khoutorsky A., Mathews M.B., Sonenberg N.. Translation deregulation in human disease. Nat. Rev. Mol. Cell Biol. 2018; 19:791–807. - PubMed
    1. Klann E., Dever T.E.. Biochemical mechanisms for translational regulation in synaptic plasticity. Nat. Rev. Neurosci. 2004; 5:931–942. - PubMed

Publication types

Grants and funding