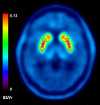
Quantification methods comparison in brain 18F-FDOPA PET
- PMID: 31976157
- PMCID: PMC6971484
Quantification methods comparison in brain 18F-FDOPA PET
Abstract
18F-FDOPA PET is one of the most widely used molecular imaging techniques to assess presynaptic dopaminergic activity. A variety of analytical methods have been developed to quantify 18F-FDOPA PET images and in most, the striatal-to-occipital ratio (SOR) is used as a quantitative parameter. A manual strategy is typically used for quantification purposes, which can have some caveats, being time-consuming and having some inter-rater variability. In the present study we aimed to test whether automated quantification methods can provide an efficient alternative to manual quantification to overcome its limitations and compare each method's capacity to discriminate between normal and abnormal subjects. 18F-FDOPA PET images of 60 subjects were analyzed and quantified with one manual and two automated methods. SUVRs were obtained for caudate and putamen nucleus in both cases. We were able to reach the same level of discrimination with manual and automated strategies, and a threshold for normal/abnormal discrimination could be obtained. We believe automated strategies for VOI quantification can help molecular imaging physicians in the process of interpretation of studies, making the process faster, yet reliable and objective.
Keywords: 18F-FDOPA PET; PET quantification methods; parkinsonism; quantification.
AJNMMI Copyright © 2019.
Conflict of interest statement
None.
Figures


References
-
- Lee CS, Samii A, Sossi V, Ruth TJ, Schulzer M, Holden JE, Wudel J, Pal PK, de la Fuente-Fernandez R, Calne DB, Stoessl AJ. In vivo positron emission tomographic evidence for compensatory changes in presynaptic dopaminergic nerve terminals in Parkinson’s disease. Ann Neurol. 2000;47:493–503. - PubMed
-
- Takikawa S, Dhawan V, Chaly T, Robeson W, Dahl R, Zanzi I, Mandel F, Spetsieris P, Eidelberg D. Input functions for 6-[fluorine-18] fluorodopa quantitation in parkinsonism: comparative studies and clinical correlations. J Nucl Med. 1994;35:955–963. - PubMed
-
- Dhawan V, Ma Y, Pillai V, Spetsieris P, Chaly T, Belakhlef A, Margouleff C, Eidelberg D. Comparative analysis of striatal FDOPA uptake in Parkinson’s disease: ratio method versus graphical approach. J Nucl Med. 2002;43:1324–1330. - PubMed
-
- Jokinen P, Helenius H, Rauhala E, Brück A, Eskola O, Rinne JO. Simple ratio analysis of 18F-fluorodopa uptake in striatal subregions separates patients with early parkinson disease from healthy controls. J Nucl Med. 2009;50:893–899. - PubMed
-
- Logan J, Fowler JS, Volkow ND, Wang GJ, Ding YS, Alexoff DL. Distribution volume ratios without blood sampling from graphical analysis of PET data. J Cereb Blood Flow Metab. 1996;16:834–840. - PubMed
LinkOut - more resources
Full Text Sources
