. 2020 May;55(5):310-317.
doi: 10.1097/RLI.0000000000000642.

Temperature-Sensitive Frozen-Tissue Imaging for Cryoablation Monitoring Using STIR-UTE MRI

Affiliations

Temperature-Sensitive Frozen-Tissue Imaging for Cryoablation Monitoring Using STIR-UTE MRI

Junichi Tokuda et al. Invest Radiol. 2020 May.

Abstract

Purpose: The aim of this study was to develop a method to delineate the lethally frozen-tissue region (temperature less than -40°C) arising from interventional cryoablation procedures using a short tau inversion-recovery ultrashort echo-time (STIR-UTE) magnetic resonance (MR) imaging sequence. This method could serve as an intraprocedural validation of the completion of tumor ablation, reducing the number of local recurrences after cryoablation procedures.

Materials and methods: The method relies on the short T1 and T2* relaxation times of frozen soft tissue. Pointwise Encoding Time with Radial Acquisition, a 3-dimensional UTE sequence with TE = 70 microseconds, was optimized with STIR to null tissues with a T1 of approximately 271 milliseconds, the threshold T1. Because the T1 relaxation time of frozen tissue in the temperature range of -40°C < temperature < -8°C is shorter than the threshold T1 at the 3-tesla magnetic field, tissues in this range should appear hyperintense. The sequence was evaluated in ex vivo frozen tissue, where image intensity and actual tissue temperatures, measured by thermocouples, were correlated. Thereafter, the sequence was evaluated clinically in 12 MR-guided prostate cancer cryoablations, where MR-compatible cryoprobes were used to destroy cancerous tissue and preserve surrounding normal tissue.

Results: The ex vivo experiment using a bovine muscle demonstrated that STIR-UTE images showed regions approximately between -40°C and -8°C as hyperintense, with tissues at lower and higher temperatures appearing dark, making it possible to identify the region likely to be above the lethal temperature inside the frozen tissue. In the clinical cases, the STIR-UTE images showed a dark volume centered on the cryoprobe shaft, Vinner, where the temperature is likely below -40°C, surrounded by a doughnut-shaped hyperintense volume, where the temperature is likely between -40°C and -8°C. The hyperintense region was itself surrounded by a dark volume, where the temperature is likely above -8°C, permitting calculation of Vouter. The STIR-UTE frozen-tissue volumes, Vinner and Vouter, appeared significantly smaller than signal voids on turbo spin echo images (P < 1.0 × 10), which are currently used to quantify the frozen-tissue volume ("the iceball"). The ratios of the Vinner and Vouter volumes to the iceball were 0.92 ± 0.08 and 0.29 ± 0.07, respectively. In a single postablation follow-up case, a strong correlation was seen between Vinner and the necrotic volume.

Conclusions: Short tau inversion-recovery ultrashort echo-time MR imaging successfully delineated the area approximately between -40°C and -8°C isotherms in the frozen tissue, demonstrating its potential to monitor the lethal ablation volume during MR-guided cryoablation.


Conflict of interest statement

Conflicts of Interest

The PETRA sequence was provided by Siemens Healthineers as a work-in-progress (WIP) package. JT has received research funding from Siemens Healthineers for an unrelated study.

Figures

Fig. 1.
Fig. 1.
Estimated T1 relaxation time in soft-tissue (muscle) in frozen and unfrozen conditions at 0.5 Tesla, 1.0 Tesla, 1.5 Tesla, and 3.0 Tesla based on equations and parameters provided in reference . We computed the T1 relaxation times for these field strengths since the original work did not include a 3 Tesla plot. Arrows and the horizontal dotted lines indicate the lower and upper temperatures where the T1 at 3T is 271 ms. Note that the freezing temperature in soft-tissue is depressed by 5 to 10 degrees, relative to bulk water, due to surface tension.
Fig. 2.
Fig. 2.
The apparatus used in the ex vivo tissue experiment. A dry-ice pack was placed on top of a stack of ex vivo swine muscle slices in a Styrofoam container. Five thermocouples embedded in carbon-fiber tubes were inserted into the tissues at different layers. The thermocouples were connected to a data acquisition device (DAQ) located outside the MRI room via cables with attached ferrites. The dry-ice pack gradually cooled down the tissue sample from the top down, forming a temperature gradient within the tissue.
Fig. 3.
Fig. 3.
STIR-TSE (TI=198ms) (left) and STIR-UTE (TI=80ms) (center) images of T1-mapping phantoms consisting of nine vials containing gels with different concentrations. The mean signal intensity in each vial is plotted against the T1 relaxation time for both images (right). The T1 relaxation times, which are shown below each vial on the images, were calculated by fitting the T1 relaxation model to the STIR-TSE images obtained at multiple TIs. The plot indicates that the signal intensity would become zero on both STIR-TSE and STIR-UTE near the expected T1 (T1, −40°C= 271 ms), but that TSE cannot be used to image frozen tissue, since its TE is too long. The null point for TSE with a TI of 198 ms is expected to be T1 = 198 / ln (2) = 286 ms.
Fig 4.
Fig 4.
STIR-UTE (left) and TSE (right) images of the tissue sample (swine muscle) were acquired approximately 40 minutes after the dry ice was placed on top of the sample (see Figure 2 for the configuration). The dry ice created a layer of frozen tissue above the unfrozen layer. The frozen layer is shown as a signal void on the TSE image, while the STIR-UTE image shows a band of hyperintensity between lower temperature and upper temperature boundaries (approximately −40°C
Fig. 5.
Fig. 5.
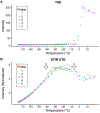
Image intensities in frozen and un-frozen muscle tissue on TSE (A) and STIR UTE (B), as a function of temperature. Images are plotted against temperature, measured with thermocouples embedded into the tissue. Arrows indicate lower (−40°C) and upper (−8°C) temperatures where T1 was expected to be 271ms, which were selected notch temperatures. Note that image intensities below and above these temperatures were attenuated.
Fig. 6.
Fig. 6.
(Left) Representative intraprocedural multi-slice T2-weighted TSE image acquired after 10 minutes of freezing (upper row) and the corresponding 3D STIR-UTE image (lower row) from Case 1. Original images were acquired in the axial plane (left column) and reformatted along the coronal (middle column) and sagittal planes (right column). Two cryoprobes were placed in parallel to the coronal plane, as indicated by the dotted lines. The STIR-UTE images show a doughnut-shaped hyperintense area within the iceball, approximately representing the −8 °C (outer edge) and −40 °C (inner edge) isotherms. (Right) Three-dimensional renderings of Vouter (Light Blue and Purple) and Vinner (Purple alone) reconstructed from the STIR-UTE images are also shown, along with models of the prostate gland, the cryoprobes, and the urethral warming catheter. The coronal STIR-UTE image and the 3D renderings clearly demonstrate the “synergistic effect”, obtained when iceballs, created by the two cryoprobes, fuse together, thus providing a larger low-temperature region.
Fig. 7.
Fig. 7.
(Left) Multi-slice T2-weighted (upper row) and 3D STIR-UTE (lower row) images acquired after 12 minutes of freezing from Case 11. (Right) Three-dimensional renderings of Vouter and Vinner reconstructed from the STIR-UTE image are shown, along with models of the prostate gland, cryoprobes, and urethral warming catheter (same notations as in Fig. 6). A large portion of the prostate gland involving the urethra was ablated with five cryoablation probes, resulting in a large signal void on the T2-weighted images. The STIR-UTE images show a hypointense region around the urethra (white arrows), indicating a higher tissue temperature, which is because of the catheter with circulating warm water that was placed within the urethra to protect it from cryoinjury.
Fig. 8.
Fig. 8.
For case 2, Intraprocedural TSE (left), and STIR-UTE (middle) images near the end of the freezing cycle and a postprocedural contrast-enhanced (CE) MRI (right) at corresponding slice locations. The postprocedural CE MRI was acquired in a separate session, and was aligned to the intraprocedural images manually. The boundaries near the −8 °C isotherm (white broken line) and the −40 °C isotherm (blue solid line) contoured on the STIR-UTE image were superimposed on all the images. Additionally, the cryo-ablated zone, estimated from the unenhanced area on the postprocedural CE image (dotted orange line) was also superimposed. The volume of the ablated zone was 6.20 cc, while the maximum volumes within the boundary near the −40 °C isotherm on the STIR-UTE was 5.08 cc.

References

    1. Siegel RL, Miller KD, Jemal A. Cancer statistics, 2019. CA Cancer J. Clin 2019;69(1):7–34. - PubMed
    1. Roy S, Hyndman ME, Danielson B, et al. Active treatment in low-risk prostate cancer: a population-based study. Curr. Oncol 2019;26(4):e535–e540. - PMC - PubMed
    1. Gandaglia G, Albers P, Abrahamsson P-A, et al. Structured Population-based Prostate-specific Antigen Screening for Prostate Cancer: The European Association of Urology Position in 2019. Eur. Urol 2019;76(2):142–150. - PubMed
    1. Ilic D, Djulbegovic M, Jung JH, et al. Prostate cancer screening with prostate-specific antigen (PSA) test: a systematic review and meta-analysis. BMJ. 2018;362:k3519. - PMC - PubMed
    1. Fenton JJ, Weyrich MS, Durbin S, et al. Prostate-Specific Antigen-Based Screening for Prostate Cancer: Evidence Report and Systematic Review for the US Preventive Services Task Force. JAMA. 2018;319(18):1914–1931. - PubMed

Publication types