. 2020 Jan 24;18(1):e3000600.
doi: 10.1371/journal.pbio.3000600. eCollection 2020 Jan.

Optogenetics reveals Cdc42 local activation by scaffold-mediated positive feedback and Ras GTPase

Affiliations

Optogenetics reveals Cdc42 local activation by scaffold-mediated positive feedback and Ras GTPase

Iker Lamas et al. PLoS Biol. .

Abstract

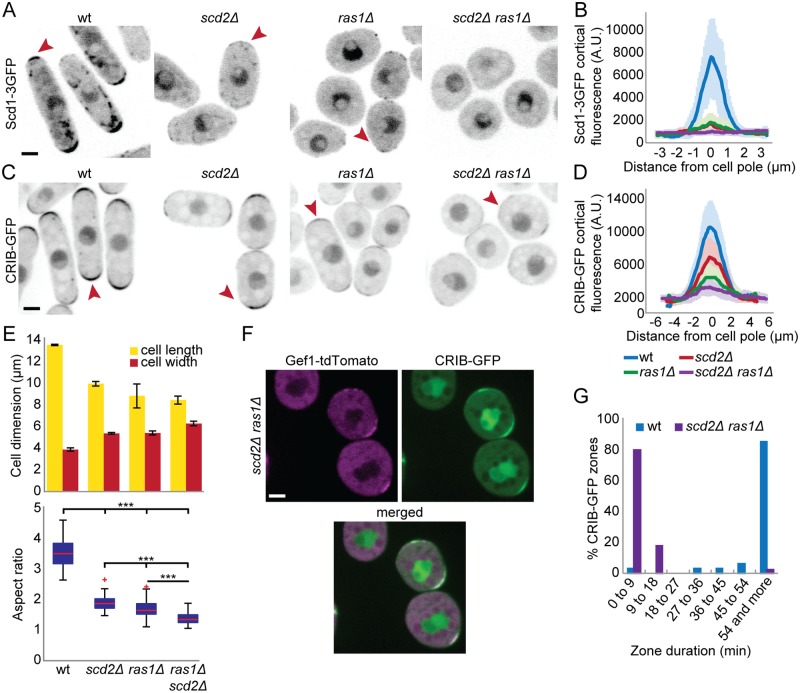
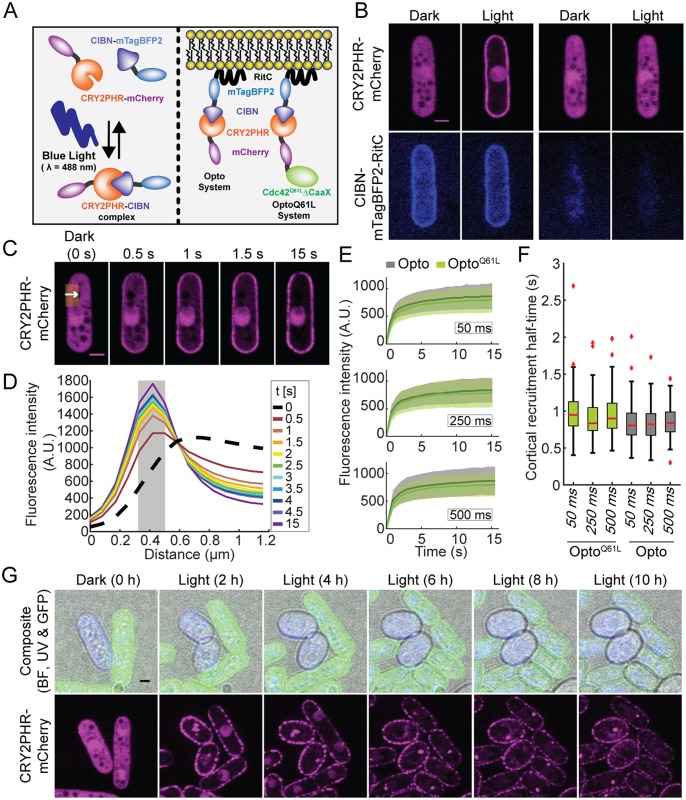
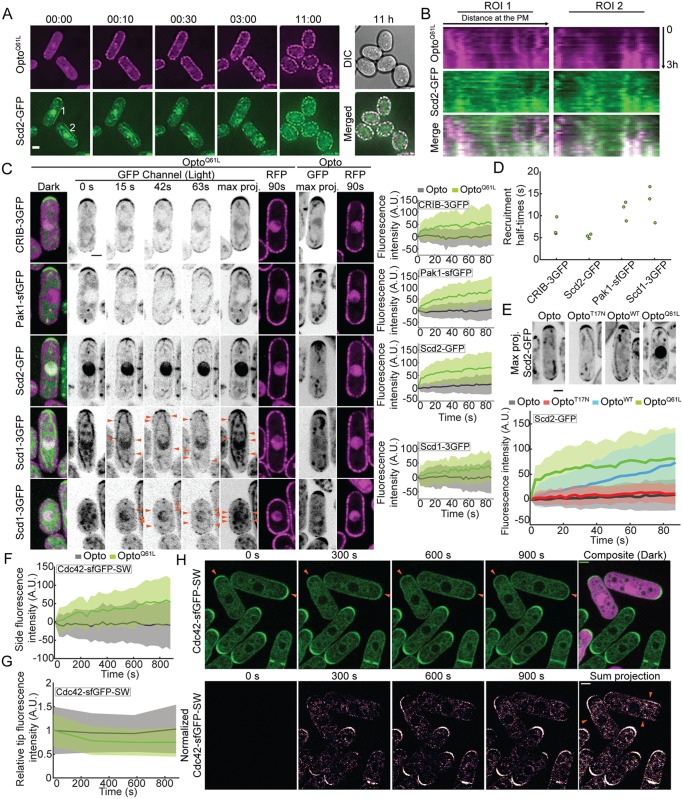
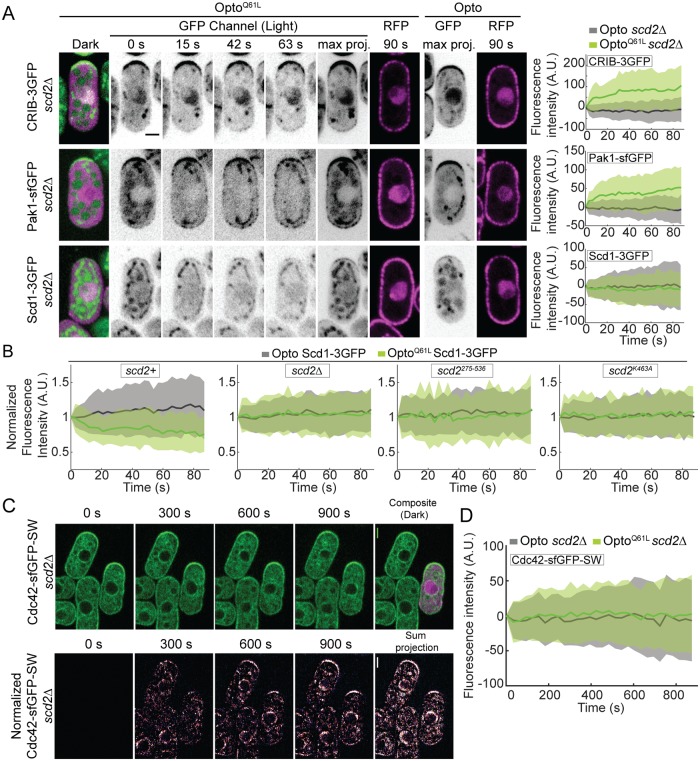
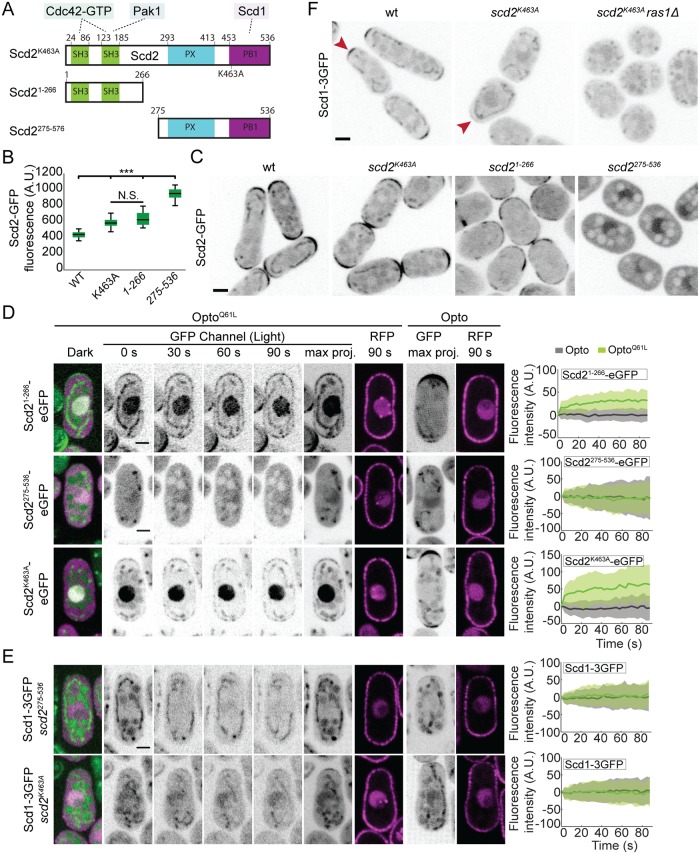
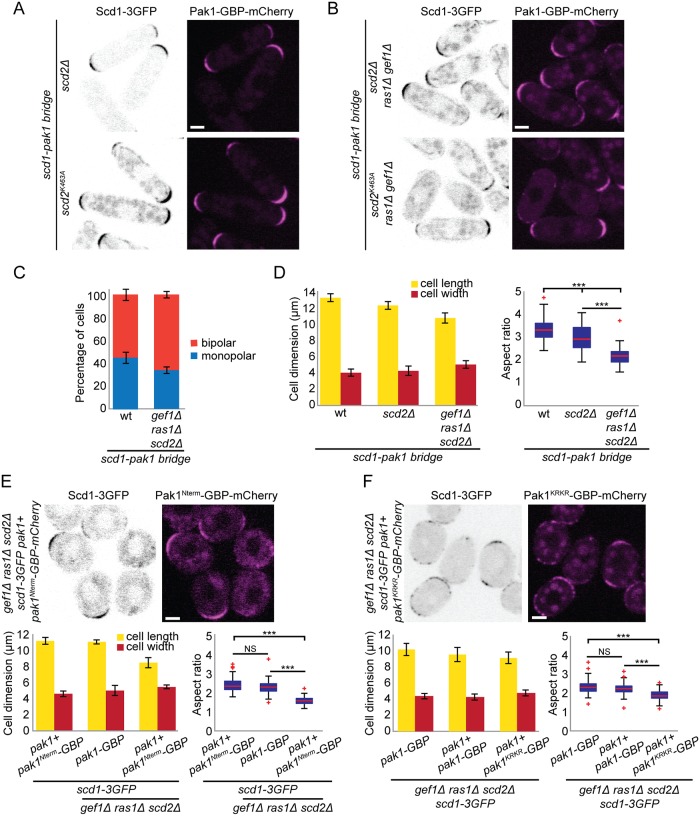
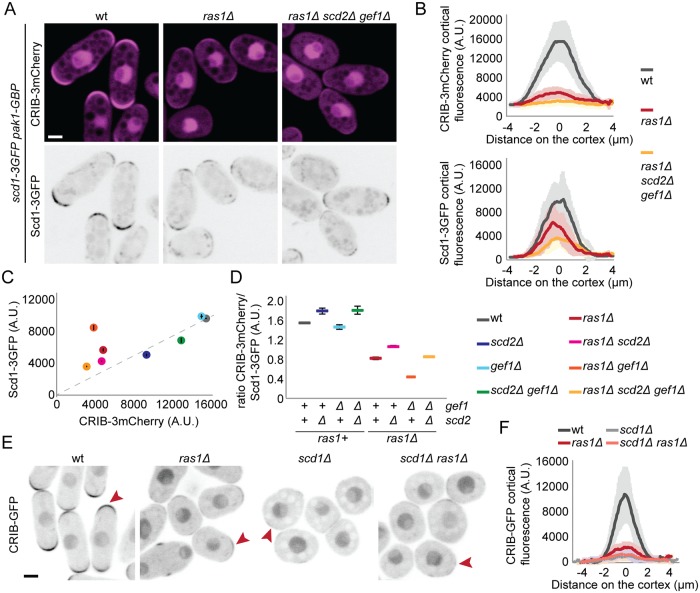
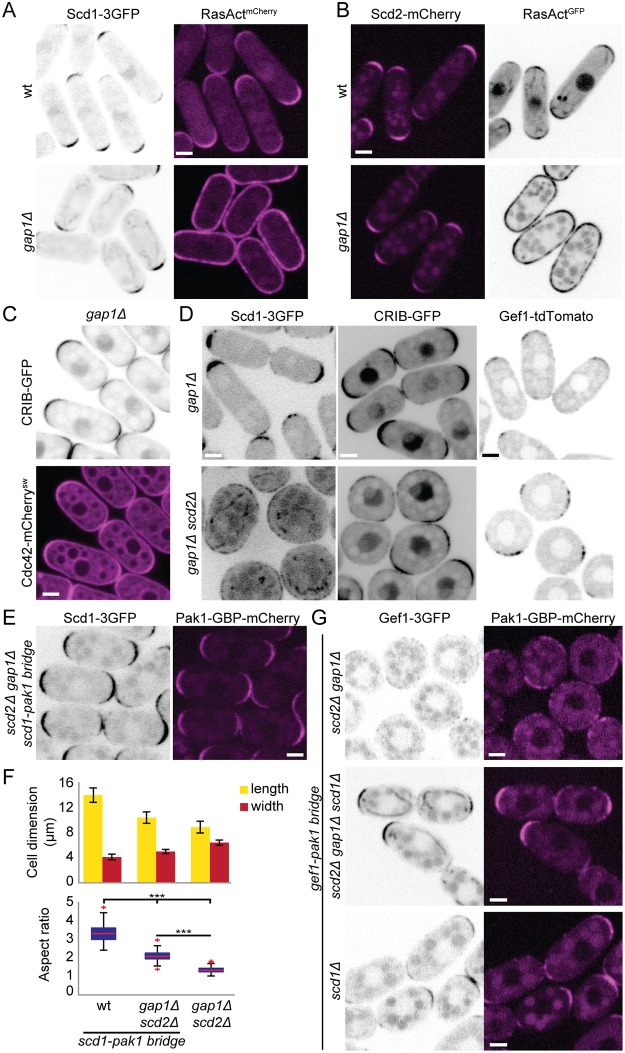
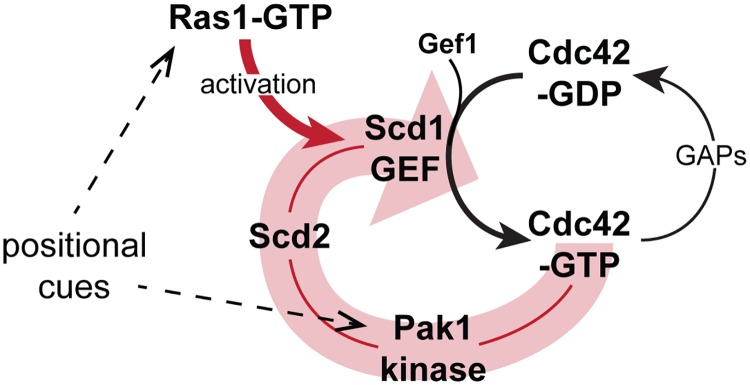
Local activity of the small GTPase Cdc42 is critical for cell polarization. Whereas scaffold-mediated positive feedback was proposed to break symmetry of budding yeast cells and produce a single zone of Cdc42 activity, the existence of similar regulation has not been probed in other organisms. Here, we address this problem using rod-shaped cells of fission yeast Schizosaccharomyces pombe, which exhibit zones of active Cdc42-GTP at both cell poles. We implemented the CRY2-CIB1 optogenetic system for acute light-dependent protein recruitment to the plasma membrane, which allowed to directly demonstrate positive feedback. Indeed, optogenetic recruitment of constitutively active Cdc42 leads to co-recruitment of the guanine nucleotide exchange factor (GEF) Scd1 and endogenous Cdc42, in a manner dependent on the scaffold protein Scd2. We show that Scd2 function is dispensable when the positive feedback operates through an engineered interaction between the GEF and a Cdc42 effector, the p21-activated kinase 1 (Pak1). Remarkably, this rewired positive feedback confers viability and allows cells to form 2 zones of active Cdc42 even when otherwise essential Cdc42 activators are lacking. These cells further revealed that the small GTPase Ras1 plays a role in both localizing the GEF Scd1 and promoting its activity, which potentiates the positive feedback. We conclude that scaffold-mediated positive feedback, gated by Ras activity, confers robust polarization for rod-shape formation.


Conflict of interest statement

The authors have declared that no competing interests exist.

Figures

Fig 1
Fig 1. Ras1 and Scd2 cooperate for Scd1 recruitment to cell poles.
(A-D) Localization of Scd1-3GFP (A-B) and CRIB-GFP (C-D) in wt, ras1Δ, scd2Δ, and ras1Δ, scd2Δ cells. (A) and (C) show representative B/W inverted images; (B) and (D) show cortical tip profiles of Scd1-3GFP and CRIB-GFP fluorescence; n = 24 and 26 cells, respectively. Thick line = average; shaded area = standard deviation. (E) Mean cell length and width at division (top) and aspect ratio (bottom) of strains as in (C) (n > 30 for 3 independent experiments). Bar graph error bars show standard deviation; box plots show the ratio between cell length and cell width. On each box, the central mark indicates the median; the bottom and the top edges indicate the 25th and 75th percentiles, respectively; the whiskers extend to the most extreme data points not considering outliers, which are plotted individually using the red “+” symbol. *** indicates 2.8e-90p ≤ 1.9e-10. (F) Colocalization of CRIB-GFP and Gef1-tdTomato in ras1Δ scd2Δ double-mutant cells. Bar = 2 μm. (G) Lifetime of CRIB-GFP cortical zones over 1 h, in wt and ras1Δ scd2Δ cells (n = 32 and 39 zones respectively). All underlying numerical values are available in S1 Data. A.U., arbitrary units; B/W, black and white; wt, wild type.
Fig 2
Fig 2. Acute cortical recruitment of protein by optogenetics.
(A) Principle of the blue light–dependent CRY2PHR-CIBN complex formation (left) and configuration of heterologous synthetic proteins implemented in S. pombe (right). (B) Blue light–and CIBN-dependent cortical recruitment of CRY2PHR-mCherry. Note that mixtures of sample and control cells were used for this and all optogenetic experiments (see S3 Fig and Methods). The left panels center on a cell expressing both CIBN and CRY2PHR. The right panels center on a cell expressing only CRY2PHR. (C) Plasma-membrane recruitment of the Opto system in response to periodic 50-ms blue-light (λ = 488 nm, 30 cycles) stimulation. The white arrow within the yellow ROI (≈1.25 μm by 3 μm) indicates the region quantified in (D). (D) Profiles extracted from the ROI highlighted in (C); the gray area indicates the plasma-membrane position, defined as the 3 pixels surrounding the peak fluorescence intensity at the end of the time lapse. These pixel values were averaged and displayed over time to display the plasma-membrane recruitment dynamics shown in (E). (E) Plasma-membrane recruitment dynamics (extracted from the signal in the gray area in (C)) of Opto (gray) and OptoQ61L (green) in response to periodic 50 ms (top), 250 ms (middle), and 500 ms (bottom) blue light (λ = 488 nm) pulses (N = 3, n = 30 cells per experiment). Thick line = average; shaded area = standard deviation. (F) Plasma-membrane recruitment half-times for the Opto and OptoQ61L systems. On each box, the central mark indicates the median; the bottom and the top edges indicate the 25th and 75th percentiles, respectively; the whiskers extend to the most extreme data points not considering outliers, which are plotted individually using the red “+” symbol. (G) Blue light–dependent induction of isotropic growth in OptoQ61L (blue), but not OptoWT (green) cells photoactivated at 10-min interval (GFP, RFP, and BF channels were acquired every 10 min; UV channel every 1 h). Note that the patchy appearance of CRY2PHR-mCherry is likely due to the clustering properties of this protein [45]. Bars = 2 μm. All underlying numerical values are available in S2 Data. A.U., arbitrary units; BF, bright-field; ROI, region of interest.
Fig 3
Fig 3. Visualizing the positive feedback triggered by Cdc42-GTP.
(A) Blue light–dependent Scd2-GFP relocalization to OptoQ61L foci during the transition from polar to isotropic growth (GFP, RFP, and DIC channels were acquired every 10 min). ROIs (2 pixel width) highlight cortical regions from where kymographs shown in (B) were generated. Time is shown in hh:mm. (B) Kymographs generated from ROIs shown in (A) over the first 3 h of time-lapse acquisition. x-axes of kymographs represent distance at the cell side and y-axes represent time. (C) OptoQ61L-induced cell-side relocalization of CRIB-3GFP probe and endogenously tagged Pak1-sfGFP, Scd2-GFP, and Scd1-3GFP in otherwise wt cells (B/W inverted images). Merged color images on the left show the dark, inactive state of OptoQ61L cells. The GFP max projection (“max proj.”) images show GFP maximum-intensity projections of 30 time points over 90 s and illustrate best the side recruitment of GFP-tagged probes. Orange arrowheads point to lateral Scd1-3GFP signal. RFP images show the cortical recruitment of CRY2PHR-mCherry-Cdc42Q61L (OptoQ61L) and CRY2PHR-mCherry (Opto) at the end of the time lapse. Quantification of GFP signal intensity at cell sides is shown on the right. N = 3; n > 20 cells per experiment; pCRIB-3GFP = 2.9e-13; pPak1-sfGFP = 4.8e-22; pScd2-GFP = 3.1e-18; pScd1-3GFP = 1.4e-04. For Scd1-3GFP (bottom 2 rows), 2 different examples of normal-sized (top) and small cells (bottom) are shown. The internal globular and filamentous signal is due to cellular autofluorescence (see S3B Fig for examples of unlabeled cells imaged in the same conditions). (D) Cell-side relocalization half-times of CRIB-3GFP, Scd2-GFP, Scd1-3GFP, and Pak1-sfGFP. Average half-times derived from 3 independent experimental replicates are plotted. (E) Relocalization to cell sides requires Cdc42 activity. (Top) Max projection images of Scd2-GFP (B/W inverted images) over 90-s illumination in Opto, OptoT17N, OptoWT, and OptoQ61L cells. (Bottom) Scd2-GFP relocalization dynamics at the sides of Opto, OptoT17N, OptoWT, and OptoQ61L cells. N = 3 experiments; n > 20 cells per experiment, except for the Opto sample, in which N = 6 independent experiments (1 × N = 3 in parallel to OptoQ61L and OptoWT, and 1 × N = 3 for OptoT17N). The OptoQ61L trace is the same as in (C). (F) OptoQ61L-induced cell-side accumulation of endogenous Cdc42-sfGFPSW in otherwise wt cells. N = 3; n > 20 cells per experiment; p = 4.2e-09. (G) OptoQ61L-induced decrease in Cdc42-sfGFPSW tip signal over time (pOptoQ61LVsOpto = 0.037). Note that measurements were performed at every 5-min time point only. (H) OptoQ61L-induced relocalization of endogenous Cdc42-sfGFPSW in otherwise wt cells. (Top) Mixtures of OptoQ61L (purple) and GFP control cell expressing Cdc42-sfGFPSW. Note tip accumulation Cdc42-sfGFPSW at t0, which is lost over time in OptoQ61L cells (arrowheads). (Bottom) Time lapse as in top row, but normalized by subtraction of initial time-point signal and pseudocolored. Note side signal in OptoQ61L cells (arrowheads), which represents gain of fluorescence intensity in respect to the initial time point (see Methods). The strong signal at the tips of wt cells is due to cell growth. In all graphs, thick line = average; shaded area = standard deviation. Bars = 2 μm. All underlying numerical values are available in S3 Data. A.U., arbitrary units; B/W, black and white; DIC, differential interference contrast; PM, plasma membrane; ROI, region of interest; wt, wild type.
Fig 4
Fig 4. Scd2 is essential for the Cdc42-GTP-triggered positive feedback.
(A) In scd2Δ cells, OptoQ61L induces CRIB and Pak1 recruitment but fails to recruit its GEF Scd1. Data layout as in Fig 3C. N = 3; n > 20 cells per experiment; pCRIB-3GFP = 1.4e-18; pPak1-sfGFP = 8.4e-15; pScd1-3GFP = 0.2. (B) Scd1-3GFP signal at cell tips over time in OptoQ61L and Opto scd2+ (p = 1.6e-09), scd2Δ (p = 0.5), scd2275-536 (p = 0.1), and scd2K463A cells (p = 0.8). N = 3; n > 15 cells. (C) Mixtures of scd2Δ OptoQ61L (purple) and scd2Δ control cell expressing Cdc42-sfGFPSW. Data presented as in Fig 3H. Note that there is little change in Cdc42-sfGFPSW distribution in scd2Δ OptoQ61L cells. (D) OptoQ61L fails to induce cell-side accumulation of endogenous Cdc42-sfGFPSW in scd2Δ cells. N = 3; n > 20 cells per experiment; p = 0.32. Bars = 2 μm. All underlying numerical values are available in S4 Data. A.U., arbitrary units; max proj., maximum projection.
Fig 5
Fig 5. Structure-function dissection of Scd2 in positive feedback.
(A) Schematics of Scd2 showing interaction domains with Cdc42-GTP (SH3 1 and 2), Pak1 (SH3 2), and Scd1 (PB1) [37, 38, 46], with point mutation used to block Scd1 binding (top; Scd2K463A; [50]) and N- and C-terminal Scd21-266 and Scd275-536 fragments (bottom). The PX domain likely binds phosphoinositides [51, 52]. (B) Quantification of Scd2-GFP total fluorescence in strains as in (C). (C) Localization of Scd2-GFP (B/W inverted images) in cells expressing different alleles integrated at the endogenous scd2 locus: scd2wt, scd2K463A, scd21-266, and scd2275-536. (D) OptoQ61L induces the relocalization of Scd21-266 and Scd2K463A but fails to recruit Scd2275-536. Data layout as in Fig 3C. N = 3; n > 20 cells; pscd2(1–266)-eGFP = 3.9e-23, pscd2(275–536)-eGFP = 0.69 and pScd2K463A-eGFP = 4.4e-21. (E) OptoQ61L fails to recruit its own GEF Scd1 in scd2275-536 and scd2K463A mutants. Data layout as in Fig 3A. N = 3; n > 20 cells; in scd2275-536, pScd1-3GFP = 0.2; in scd2K463A, pScd1-3GFP = 0.3. (F) Localization of Scd1-3GFP (B/W inverted images) in wt, scd2K463A, and scd2K463A ras1Δ cells. In all graphs, thick line = average; shaded area = standard deviation. Bars = 2 μm. All underlying numerical values are available in S5 Data. A.U., arbitrary units; B/W, black and white; max proj., maximum projection; N.S., not significant; PB1, Phox and Bem1 domain; SH3, Src-homology 3; wt, wild type.
Fig 6
Fig 6. An artificial Scd1-Pak1 bridge is sufficient to sustain bipolar growth.
(A-B) Localization of Scd1-3GFP (B/W inverted images) and Pak1-GBP-mCherry (magenta) in scd2Δ and scd2K463A cells (A) or in scd2Δ ras1Δ gef1Δ and scd2K463A ras1Δ gef1Δ cells (B). (C) Mean percentage of bipolar septated cells of strains with indicated genotypes. N = 3 experiments with n > 30 cells. (D) Mean cell length and width at division (left) and aspect ratio (right) of wt, scd2Δ, and scd2Δ ras1Δ gef1Δ strains expressing the scd1-pak1 bridge. N = 3 experiments with n > 30 cells. ***3.5e-48p ≤ 2e-7. (E-F) Localization of Scd1-3GFP (B/W inverted images) and Pak1Nterm-GBP-mCherry (magenta) (E) and Scd1-3GFP (B/W inverted images) and Pak1KRKR-GBP-mCherry (magenta) in scd2Δ ras1Δ gef1Δ strains (top) and mean cell length and width at division (bottom left), and aspect ratio (bottom right), of strains with indicated genotypes. N = 3 experiments with n > 30 cells. ***1.72e-50p ≤ 4.2e-44 (E) and 1.17e-27p ≤ 5.8e-23 (F). Bar graph error bars show standard deviation; box plots indicate median, 25th and 75th percentiles, and most extreme data points not considering outliers, which are plotted individually using the red “+” symbol. Bars = 2 μm. All underlying numerical values are available in S6 Data. B/W, black and white; GBP, GFP-binding protein; NS, not significant; wt, wild type.
Fig 7
Fig 7. Ras1 promotes the activation of the Cdc42 GEF Scd1.
(A) Localization of Scd1-3GFP (B/W inverted images) and CRIB-3mCherry (magenta) in wt, ras1Δ and scd2Δ ras1Δ gef1Δ cells expressing the scd1-pak1 bridge. (B) Cortical tip profiles of CRIB-3mCherry (top) and Scd1-3GFP (bottom) fluorescence in strains as in (A); n = 30 cells. (C) Plot of CRIB-3mCherry versus Scd1-3GFP fluorescence at the cell tip in strains of indicated genotypes expressing the scd1-pak1 bridge and CRIB-3mCherry as in (A) and S9A Fig. (D) Ratio of CRIB-3mCherry and Scd1-3GFP fluorescence at the cell tip of strains as in (C). (E) Localization of CRIB-GFP in wt, ras1Δ, scd1Δ, and ras1Δ scd1Δ cells (B/W inverted images). (F) Cortical tip profiles of CRIB-GFP fluorescence in strains as in (E); n = 25 cells. In (B) and (F), thick line = average; shaded area = standard deviation. Bars = 2 μm. All underlying numerical values are available in S7 Data. A.U., arbitrary units; B/W, black and white; wt, wild type.
Fig 8
Fig 8. Scaffold-mediated positive feedback restricts Cdc42 activity to cell tips when Ras1 activity is delocalized.
(A-B) Localization of Scd1-3GFP (B/W inverted images) and RasActmCherry (magenta) (A) or Scd2-mCherry (magenta) and RasActGFP (B/W inverted images) (B) in wt and gap1Δ cells. (C) Localization of Cdc42-mCherrysw (magenta) and CRIB-GFP (B/W inverted images) in gap1Δ cells. (D) Localization of Scd1-3GFP, CRIB-GFP, and Gef1-tdTomato (B/W inverted images) in gap1Δ (top) and gap1Δ scd2Δ (bottom) cells. (E) Localization of Scd1-3GFP (B/W inverted images) and Pak1-GBP-mCherry (magenta) in gap1Δ scd2Δ cells expressing the Scd1-Pak1 bridge. (F) Mean cell length and width at division (top), and aspect ratio (bottom), of strains with indicated genotypes. N = 3 experiments with n > 30 cells. ***9.55e-72p ≤ 4.6e-52. (G) Localization of Gef1-3GFP (B/W inverted images) and Pak1-GBP-mCherry (magenta) in scd2Δ gap1Δ, scd2Δ gap1Δ scd1Δ, and scd1Δ cells. Note that scd2Δ gap1Δ cells are round, whereas scd2Δ gap1Δ scd1Δ cells are rod-shaped. Bar graph error bars show standard deviation; box plots indicate the median, 25th and 75th percentiles, and most extreme data points not considering outliers, which are plotted individually using the red “+” symbol. Bars = 2 μm. All underlying numerical values are available in S8 Data. B/W, black and white; GBP, GFP-binding protein; wt, wild type.
Fig 9
Fig 9. Ras1 constrains Cdc42 activity when Scd2 is delocalized from cell tips.
(A) Calcofluor (left) and Scd2-GFP (right) images of wt and gap1Δ cells expressing pREP81-scd2-GFP-CAAX plasmid imaged 18 h after thiamine depletion for mild expression of Scd2-GFP-CAAX. (B) Mean cell length and width at division (left), and aspect ratio (right), of strains as in (A). N = 3 experiments with n > 30 cells. ***p = 9.7e-45. (C) Calcofluor (left) and Scd2-sfGFP (right) images of wt and gap1Δ cells expressing pREP81-scd2-sfGFP-RitC plasmid imaged 48 h after thiamine depletion for mild expression of Scd2-sfGFP-RitC. (D) Mean cell length and width at division (left), and aspect ratio (right), of strains as in (C). N = 3 experiments with n = 30 cells. ***p = 3.21e-50. Bar graph error bars show standard deviation; box plots indicate the median, 25th and 75th percentiles, and most extreme data points not considering outliers, which are plotted individually using the red “+” symbol. Bars = 2 μm. All underlying numerical values are available in S9 Data. wt, wild type.
Fig 10
Fig 10. Model of scaffold-mediated positive-feedback regulation of Cdc42 activity gated by Ras1 GTPase.
The schematics shows the Scd2 scaffold-mediated positive feedback on Cdc42 activation (wide, pale red arrow) and input by Ras1-GTP. By promoting Scd1 activity, Ras1-GTP amplifies the positive feedback. Positional cues on Cdc42 are transmitted through both Ras1-GTP and Pak1. GAP, GTPase activating protein; GEF, guanine nucleotide exchange factor.

Similar articles

Cited by

References

    1. Pichaud F, Walther RF, Nunes de Almeida F. Regulation of Cdc42 and its effectors in epithelial morphogenesis. J Cell Sci. 2019;132(10). 10.1242/jcs.217869 . - DOI - PubMed
    1. Etienne-Manneville S. Cdc42—the centre of polarity. J Cell Sci. 2004;117(Pt 8):1291–300. 10.1242/jcs.01115 . - DOI - PubMed
    1. Chiou JG, Balasubramanian MK, Lew DJ. Cell Polarity in Yeast. Annu Rev Cell Dev Biol. 2017;33:77–101. 10.1146/annurev-cellbio-100616-060856 - DOI - PMC - PubMed
    1. Martin SG, Arkowitz RA. Cell polarization in budding and fission yeasts. FEMS microbiology reviews. 2014;38(2):228–53. 10.1111/1574-6976.12055 . - DOI - PubMed
    1. Tatebe H, Nakano K, Maximo R, Shiozaki K. Pom1 DYRK regulates localization of the Rga4 GAP to ensure bipolar activation of Cdc42 in fission yeast. Curr Biol. 2008;18(5):322–30. 10.1016/j.cub.2008.02.005 . - DOI - PMC - PubMed

Publication types

MeSH terms

Substances