Observational Study
. 2020 Jan 24;17(1):e1003012.
doi: 10.1371/journal.pmed.1003012. eCollection 2020 Jan.

Dysregulation of multiple metabolic networks related to brain transmethylation and polyamine pathways in Alzheimer disease: A targeted metabolomic and transcriptomic study

Affiliations
Observational Study

Dysregulation of multiple metabolic networks related to brain transmethylation and polyamine pathways in Alzheimer disease: A targeted metabolomic and transcriptomic study

Uma V Mahajan et al. PLoS Med. .

Erratum in

Abstract

Background: There is growing evidence that Alzheimer disease (AD) is a pervasive metabolic disorder with dysregulation in multiple biochemical pathways underlying its pathogenesis. Understanding how perturbations in metabolism are related to AD is critical to identifying novel targets for disease-modifying therapies. In this study, we test whether AD pathogenesis is associated with dysregulation in brain transmethylation and polyamine pathways.

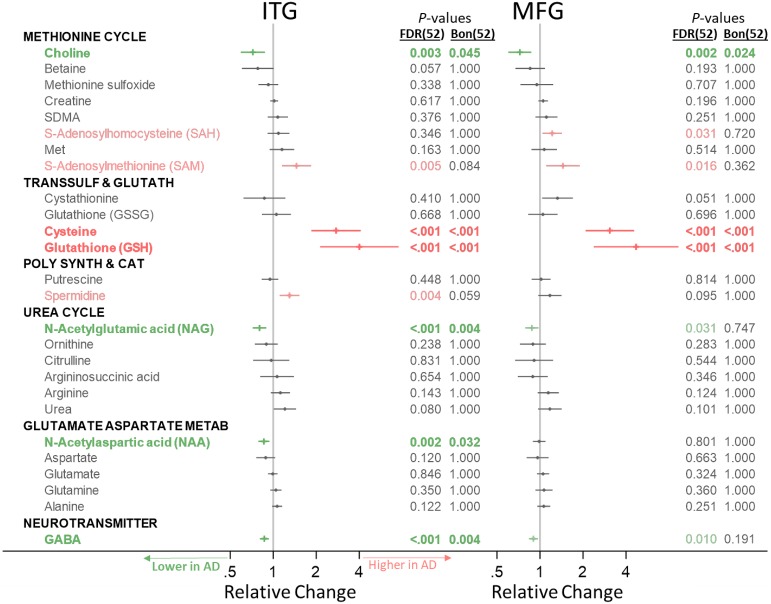
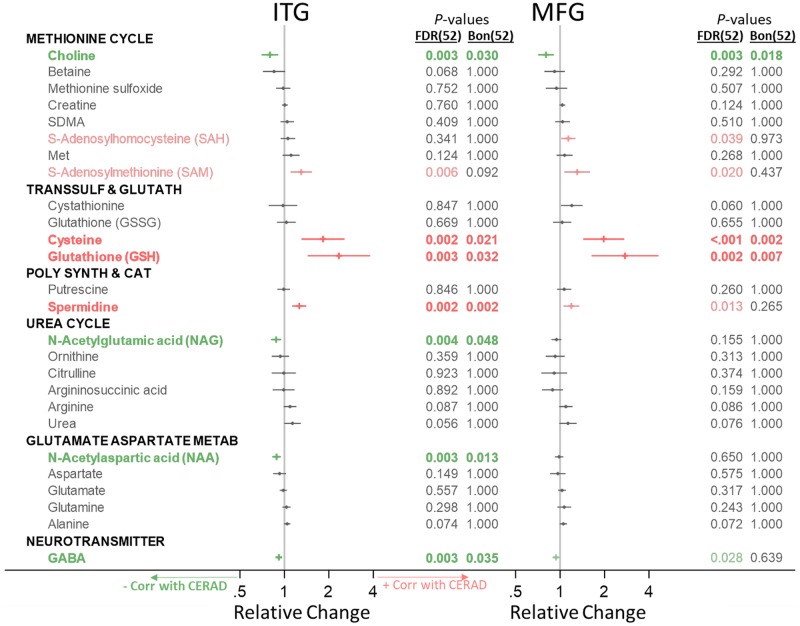
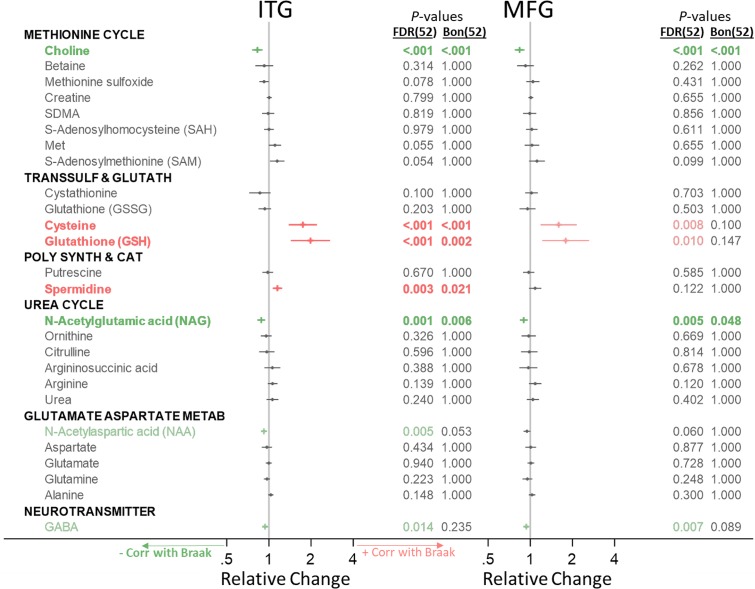
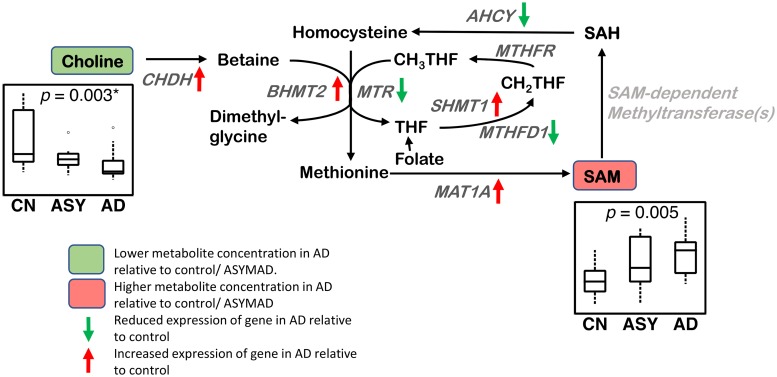
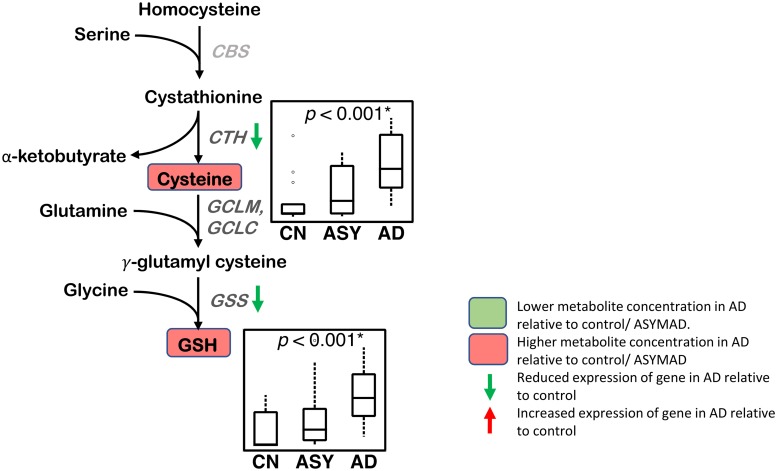
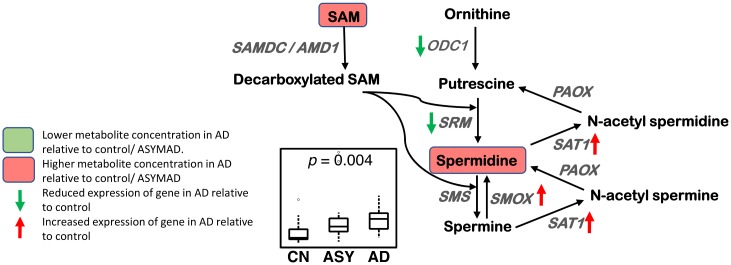
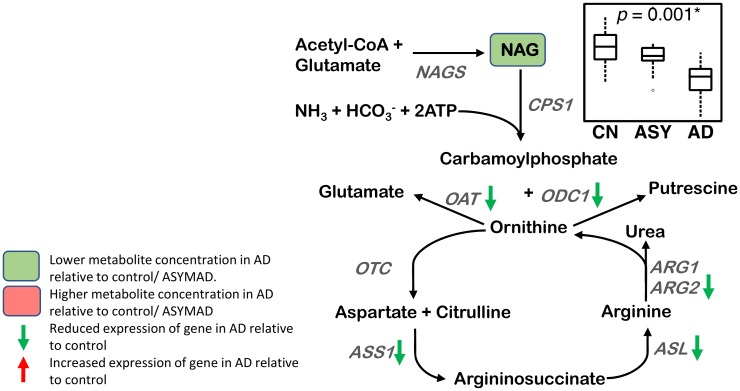
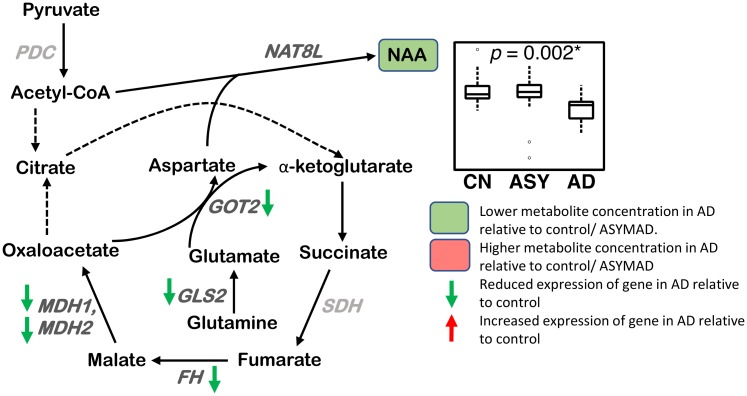
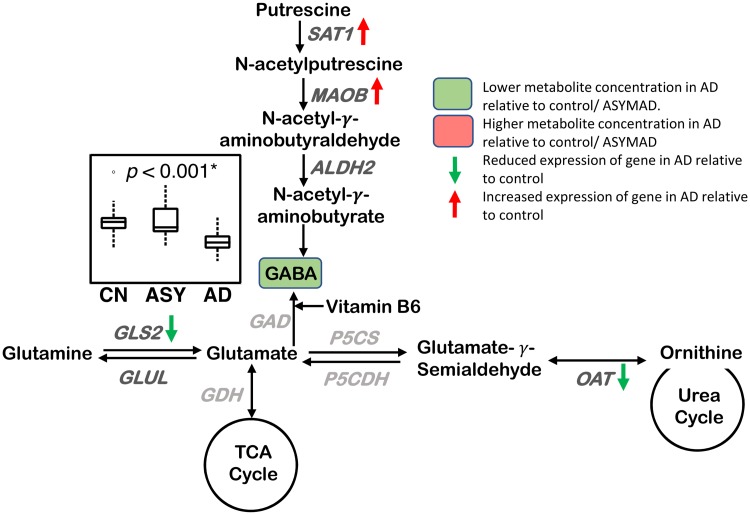
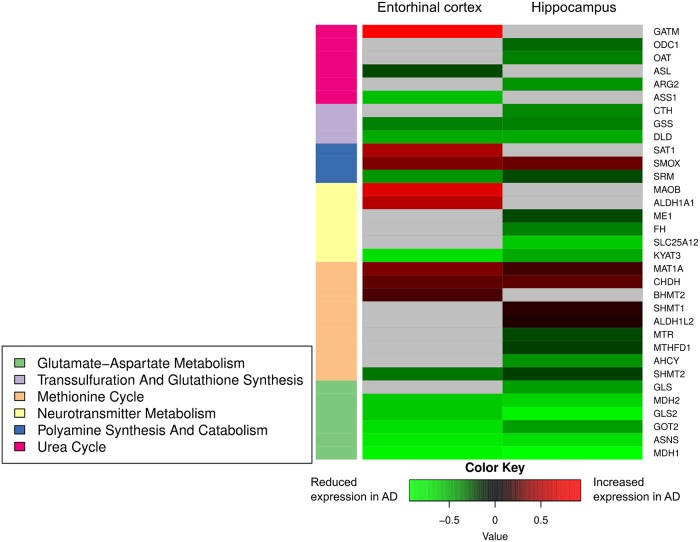
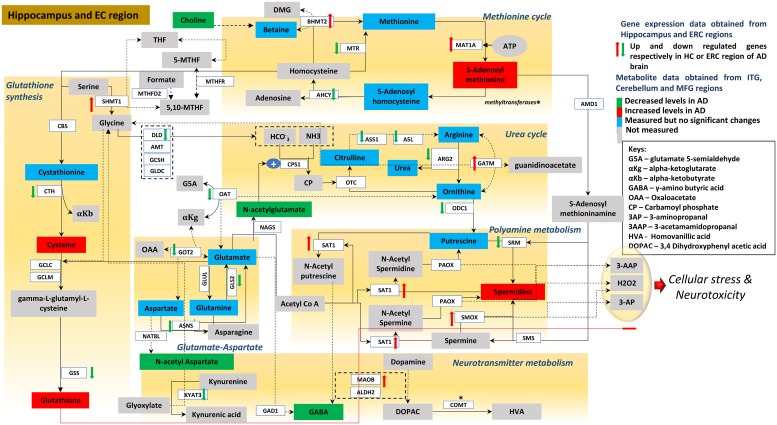
Methods and findings: We first performed targeted and quantitative metabolomics assays using capillary electrophoresis-mass spectrometry (CE-MS) on brain samples from three groups in the Baltimore Longitudinal Study of Aging (BLSA) (AD: n = 17; Asymptomatic AD [ASY]: n = 13; Control [CN]: n = 13) (overall 37.2% female; mean age at death 86.118 ± 9.842 years) in regions both vulnerable and resistant to AD pathology. Using linear mixed-effects models within two primary brain regions (inferior temporal gyrus [ITG] and middle frontal gyrus [MFG]), we tested associations between brain tissue concentrations of 26 metabolites and the following primary outcomes: group differences, Consortium to Establish a Registry for Alzheimer's Disease (CERAD) (neuritic plaque burden), and Braak (neurofibrillary pathology) scores. We found significant alterations in concentrations of metabolites in AD relative to CN samples, as well as associations with severity of both CERAD and Braak, mainly in the ITG. These metabolites represented biochemical reactions in the (1) methionine cycle (choline: lower in AD, p = 0.003; S-adenosyl methionine: higher in AD, p = 0.005); (2) transsulfuration and glutathione synthesis (cysteine: higher in AD, p < 0.001; reduced glutathione [GSH]: higher in AD, p < 0.001); (3) polyamine synthesis/catabolism (spermidine: higher in AD, p = 0.004); (4) urea cycle (N-acetyl glutamate: lower in AD, p < 0.001); (5) glutamate-aspartate metabolism (N-acetyl aspartate: lower in AD, p = 0.002); and (6) neurotransmitter metabolism (gamma-amino-butyric acid: lower in AD, p < 0.001). Utilizing three Gene Expression Omnibus (GEO) datasets, we then examined mRNA expression levels of 71 genes encoding enzymes regulating key reactions within these pathways in the entorhinal cortex (ERC; AD: n = 25; CN: n = 52) and hippocampus (AD: n = 29; CN: n = 56). Complementing our metabolomics results, our transcriptomics analyses also revealed significant alterations in gene expression levels of key enzymatic regulators of biochemical reactions linked to transmethylation and polyamine metabolism. Our study has limitations: our metabolomics assays measured only a small proportion of all metabolites participating in the pathways we examined. Our study is also cross-sectional, limiting our ability to directly test how AD progression may impact changes in metabolite concentrations or differential-gene expression. Additionally, the relatively small number of brain tissue samples may have limited our power to detect alterations in all pathway-specific metabolites and their genetic regulators.

Conclusions: In this study, we observed broad dysregulation of transmethylation and polyamine synthesis/catabolism, including abnormalities in neurotransmitter signaling, urea cycle, aspartate-glutamate metabolism, and glutathione synthesis. Our results implicate alterations in cellular methylation potential and increased flux in the transmethylation pathways, increased demand on antioxidant defense mechanisms, perturbations in intermediate metabolism in the urea cycle and aspartate-glutamate pathways disrupting mitochondrial bioenergetics, increased polyamine biosynthesis and breakdown, as well as abnormalities in neurotransmitter metabolism that are related to AD.


Conflict of interest statement

The authors have declared that no competing interests exist.

Figures

Fig 1
Fig 1. Group differences in category-specific metabolite concentrations.
Metabolites in green or red (not bold) were significant after FDR correction for 52 comparisons; metabolites in green or red (bold) were also significant after Bonferroni correction for 52 comparisons. Differences in metabolite concentration across groups were tested using linear mixed-effects models for each metabolite category. AD, Alzheimer disease; Bon, Bonferroni; FDR, false discovery rate; Glutamate Aspartate Metab, glutamate-aspartate metabolism; ITG, inferior temporal gyrus; MFG, medial temporal gyrus; Poly Synth & Cat, polyamine synthesis and catabolism; Transsulf and Glutath, transsulfuration and glutathione synthesis.
Fig 2
Fig 2. Associations between category-specific metabolites and neuritic plaque burden (CERAD).
Metabolites in green or red (not bold) were significant after FDR correction for 52 comparisons; metabolites in green or red (bold) were also significant after Bonferroni correction for 52 comparisons. Associations with pathology were tested using linear mixed-effects models for each metabolite category. Bon, Bonferroni; CERAD, Consortium to Establish a Registry for Alzheimer’s Disease; FDR, false discovery rate; Glutamate Aspartate Metab, glutamate-aspartate metabolism; ITG, inferior temporal gyrus; MFG, medial temporal gyrus; Poly Synth & Cat, polyamine synthesis and catabolism; Transsulf and Glutath, transsulfuration and glutathione synthesis.
Fig 3
Fig 3. Associations between category-specific metabolites and neurofibrillary pathology (Braak).
Metabolites in green or red (not bold) were significant after FDR correction for 52 comparisons; metabolites in green or red (bold) were also significant after Bonferroni correction for 52 comparisons. Associations with pathology were tested using linear mixed-effects models for each metabolite category. Bon, Bonferroni; CERAD, Consortium to Establish a Registry for Alzheimer’s Disease; FDR, false discovery rate; Glutamate Aspartate Metab, glutamate-aspartate metabolism; ITG, inferior temporal gyrus; MFG, medial temporal gyrus; Poly Synth & Cat, polyamine synthesis and catabolism; Transsulf and Glutath, transsulfuration and glutathione synthesis.
Fig 4
Fig 4. Methionine cycle.
Differential brain concentrations of metabolites and differential gene expression of enzymatic regulators are observed in the methionine cycle in AD. Lower concentration of choline and higher concentration of SAM are observed in AD in the ITG. CHDH, BHMT2, SHMT1, and MAT1A genes have increased expression and MTR, AHCY, and MTHFD1 genes have reduced expression in the hippocampus/ERC in AD compared to CN. Sample size: AD = 17, ASY = 13, CN = 13; p-values indicate significance after FDR correction for multiple comparisons. Genes in light gray indicate expression data were not available. An asterisk (*) indicates metabolite was also significant after Bonferroni correction. AD, Alzheimer disease; AHCY, adenosylhomocysteinase; ASY, asymptomatic AD; BHMT2, betaine-homocysteine s-methyltransferase 2; CHDH, choline dehydrogenase; CN, Control; ERC, entorhinal cortex; FDR, false discovery rate; ITG, inferior temporal gyrus; MAT1A, methionine adenosyltransferase 1A; MTHFD1, methylenetetrahydrofolate dehydrogenase, cyclohydrolase, and formyltetrahydrofolate synthetase 1; MTHFR, methylenetetrahydrofolate reductase; MTR, 5-methyltetrahydrofolate-homocysteine methyltransferase; SAH, S-adenosyl homocysteine; SAM, S-adenosyl methionine; SHMT1, serine hydroxymethyltransferase 1.
Fig 5
Fig 5. Transsulfuration and glutathione synthesis.
Higher concentrations of cysteine and GSH are observed in AD in the ITG. Differential gene expression of enzymatic regulators of transsulfuration and glutathione synthesis are observed in the hippocampus/ERC in AD relative to controls. CTH and GSS genes have reduced expression in the hippocampus/ERC in AD compared to CN. Sample size: AD = 17, ASY = 13, CN = 13; p-values indicate significance after FDR correction for multiple comparisons. An asterisk (*) indicates metabolite was also significant after Bonferroni correction. AD, Alzheimer disease; ASY, asymptomatic AD; CBS, cystathione β-synthase; CN, Control; CTH, cystathionase; ERC, entorhinal cortex; FDR, false discovery rate; GCLC, γ-glutamyl cysteine ligase; GCLM, glutamate-cysteine ligase modifier subunit; GSH, reduced glutathione; GSS, GSH synthetase; ITG, inferior temporal gyrus.
Fig 6
Fig 6. Polyamine synthesis and catabolism.
A higher concentration of spermidine is observed in AD in the ITG. The polyamine catabolic genes SAT1 and SMOX have increased expression, and the polyamine synthesis genes SRM and ODC1 have reduced expression in the hippocampus/ERC in AD compared to CN. Sample size: AD = 17, ASY = 13, CN = 13; p-values indicate significance after FDR correction for multiple comparisons. AD, Alzheimer disease; ASY, asymptomatic AD; CN, Control; ERC, entorhinal cortex; FDR, false discovery rate; ITG, inferior temporal gyrus; ODC1, ornithine decarboxylase 1; PAOX, peroxisomal N(1)-acetyl-spermine/spermidine oxidase; SAM, S-adenosyl methionine; SAMDC/AMD1, S-adenosylmethionine decarboxylase proenzyme/adenosylmethionine decarboxylase 1; SAT1, spermidine/spermine N1-acetyltransferase 1; SMOX, spermine oxidase; SMS, spermine synthase; SRM, spermidine synthase.
Fig 7
Fig 7. Urea cycle.
A lower concentration of NAG is observed in AD in the ITG. The genes ARG2, ASL, ASS1, OAT, and ODC1 have reduced expression in the hippocampus/ERC in AD compared to CN. Sample size: AD = 17, ASY = 13, CN = 13; p-values indicate significance after FDR correction for multiple comparisons. An asterisk (*) indicates metabolite was also significant after Bonferroni correction. AD, Alzheimer disease; ARG1, arginase 1; ARG2, arginase 2; ASL, argininosuccinate lyase; ASS, argininosuccinate synthase; ASY, asymptomatic AD; CN, Control; CPS1, carbamoyl phosphate synthetase I; ERC, entorhinal cortex; FDR, false discovery rate; ITG, inferior temporal gyrus; NAGS, N-acetylglutamate synthase; OAT, ornithine aminotransferase; ODC1, ornithine decarboxylase 1; OTC, ornithine transcarbamylase; NAG, N-acetyl glutamate.
Fig 8
Fig 8. Glutamate-aspartate metabolism.
A lower concentration of NAA is observed in AD in the ITG. The genes FH, MDH1, MDH2, GLS2, and GOT2 have reduced expression in the hippocampus/ERC in AD compared to CN. Sample size: AD = 17, ASY = 13, CN = 13; p-values indicate significance after FDR correction for multiple comparisons. Genes in light gray indicate expression data were not available. An asterisk (*) indicates metabolite was also significant after Bonferroni correction. Genes in light gray indicate expression data were not available. AD, Alzheimer disease; ASY, asymptomatic AD; CN, Control; CoA, coenzyme A; ERC, entorhinal cortex; FDR, false discovery rate; FH, fumarase; GLS2, glutaminase 2; GOT2, aspartate aminotransferase; ITG, inferior temporal gyrus; MDH1, malate dehydrogenase 1; MDH2, malate dehydrogenase 2; NAA, N-acetyl aspartate; NAT8L, N-acetyltransferase 8 like; PDH, pyruvate dehydrogenase complex; SDH, succinate dehydrogenase.
Fig 9
Fig 9. Neurotransmitter metabolism.
A lower concentration of GABA is observed in AD in the ITG. The GABA synthesis genes, SAT1 and MAOB, have increased expression, and the genes GLS2 and OAT have reduced expression in the hippocampus/ERC in AD compared to CN. Sample size: AD = 17, ASY = 13, CN = 13; p-values indicate significance after FDR correction for multiple comparisons. An asterisk (*) indicates metabolite was also significant after Bonferroni correction. Genes in light gray indicate expression data were not available. AD, Alzheimer disease; ALDH2, aldehyde dehydrogenase 2; ASY, asymptomatic AD; CN, Control; ERC, entorhinal cortex; FDR, false discovery rate; GAD, glutamate decarboxylase; GDH, glutamate dehydrogenase; GLS2, glutaminase 2; GLUL, glutamate-ammonia ligase; ITG, inferior temporal gyrus; MAOB, monoamine oxidase B; OAT, ornithine aminotransferase; P5CDH, delta-1-pyrroline-5-carboxylate dehydrogenase; P5CS, delta-1-pyrroline-5-carboxylate synthase; SAT1, spermidine/spermine N1-acetyltransferase 1/diamine N-acetyltransferase; TCA, tricarboxylic acid cycle.
Fig 10
Fig 10. Differential gene expression within ERC and hippocampus.
Summary of genes differentially expressed in the hippocampus/ERC in AD compared to controls across all six categories of biochemical reactions related to transmethylation and polyamine metabolism. Gray shading indicates gene expression was not significantly different between AD and control. AD, Alzheimer disease; CN, Control; ERC, entorhinal cortex.
Fig 11
Fig 11. Integrated summary of alterations in metabolite concentrations and gene expression within metabolic pathways linked to transmethylation and polyamine synthesis/catabolism.
Reactions within each of the six categories related to transmethylation and polyamine metabolism are shown within brown boxes [–95]. Metabolites whose concentrations are increased in the AD ITG relative to controls are shown in red boxes; those that are reduced in AD are shown in green boxes. Metabolites whose concentrations were measured but did not differ between AD and control are indicated in blue boxes; metabolites whose concentrations were not assayed are shown in gray boxes. Red up and green down arrows indicate significantly increased and reduced gene expression in the ERC/hippocampus, respectively. AD, Alzheimer disease; AHCY, adenosylhomocysteinase; ALDH2, aldehyde dehydrogenase 2; AMD1, adenosylmethionine decarboxylase 1; AMT, aminomethyltransferase; ARG2, arginase 2; ASL, argininosuccinate lyase; ASNS, asparagine synthetase; ASS1, argininosuccinate synthase 1; BHMT2, betaine homocysteine s-methyltransferase 2; CBS, cystathionine beta synthase; CN, Control; COMT, catechol-o-methyltransferase; CPS1, carbamoyl phosphate synthase 1; CTH, cystathionine gamma-lyase; DLD, dihydrolipoamide dehydrogenase; ERC, entorhinal cortex; GAD1, glutamate decarboxylase 1; GATM, glycine amidino transferase; GCLC, glutamate cysteine ligase catalytic; GCLM, glutamate cysteine ligase modifier; GCSH, glycine cleavage system protein H; GLDC, glycine decarboxylase; GLS2, glutaminase 2; GLUL, glutamine synthetase; GOT2, glutamic oxaloacetic transaminase 2; GSS, GSH synthetase; HC, hippocampus; ITG, inferior temporal gyrus; KYAT3, kynurenine aminotransferase 3; MAT1A, methionine adenosyltransferase 1A; MFG, middle frontal gyrus; MOAB, monoamine oxidase B; MTHFD2, methylenetetrahydrofolate dehydrogenase 2; MTHFR, methylenetetrahydrofolate reductase; MTR, methyltransferase; NAT8L, n-acetyltransferase 8 like; OAT, ornithine aminotransferase; ODC1, ornithine decarboxylase 1; OTC, ornithine carbamoyltransferase; PAOX, polyamine oxidase; SAT1, spermidine/spermine n1-acetyltransferase 1; SHMT1, serine hydroxymethyl transferase 1; SMOX, spermine oxidase; SMS, spermine synthase; SRM, spermidine synthase.

References

    1. Xu J, Begley P, Church SJ, Patassini S, Hollywood KA, Jullig M, et al. Graded perturbations of metabolism in multiple regions of human brain in Alzheimer’s disease: Snapshot of a pervasive metabolic disorder. Biochim Biophys Acta. 2016;1862(6):1084–92. Epub 2016/03/10. 10.1016/j.bbadis.2016.03.001 - DOI - PMC - PubMed
    1. Liu P, Fleete MS, Jing Y, Collie ND, Curtis MA, Waldvogel HJ, et al. Altered arginine metabolism in Alzheimer’s disease brains. Neurobiol Aging. 2014;35(9):1992–2003. Epub 2014/04/22. 10.1016/j.neurobiolaging.2014.03.013 - DOI - PubMed
    1. Inoue K, Tsutsui H, Akatsu H, Hashizume Y, Matsukawa N, Yamamoto T, et al. Metabolic profiling of Alzheimer’s disease brains. Sci Rep. 2013;3:2364 Epub 2013/08/07. 10.1038/srep02364 - DOI - PMC - PubMed
    1. Morrison LD, Smith DD, Kish SJ. Brain S-adenosylmethionine levels are severely decreased in Alzheimer’s disease. J Neurochem. 1996;67(3):1328–31. Epub 1996/09/01. 10.1046/j.1471-4159.1996.67031328.x - DOI - PubMed
    1. Cedernaes J, Schioth HB, Benedict C. Efficacy of antibody-based therapies to treat Alzheimer’s disease: just a matter of timing? Exp Gerontol. 2014;57:104–6. Epub 2014/05/20. 10.1016/j.exger.2014.05.002 - DOI - PubMed

Publication types