. 2020 Jan 24;15(1):e0227684.
doi: 10.1371/journal.pone.0227684. eCollection 2020.

Non-Invasive Functional-Brain-Imaging with an OPM-based Magnetoencephalography System

Affiliations

Non-Invasive Functional-Brain-Imaging with an OPM-based Magnetoencephalography System

Amir Borna et al. PLoS One. .

Abstract

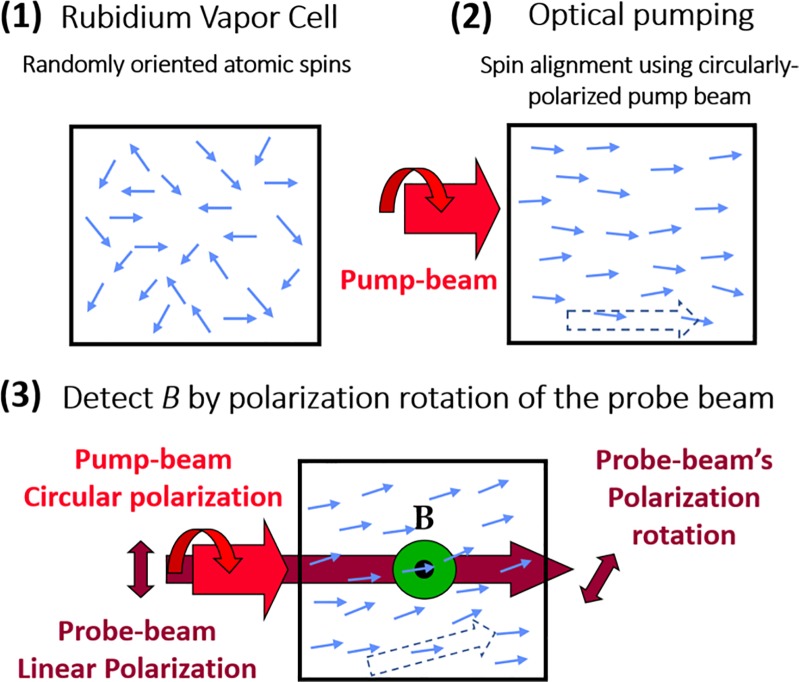
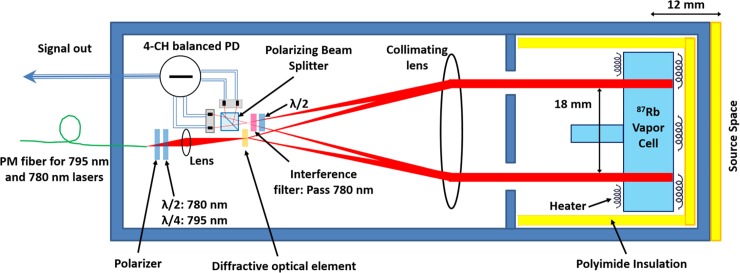
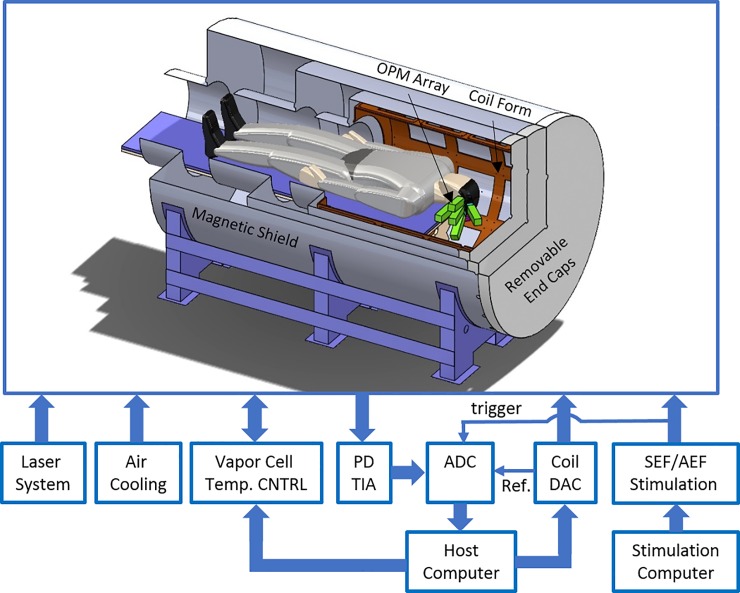
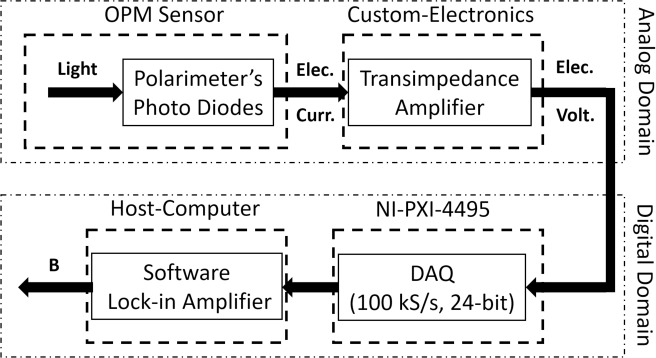
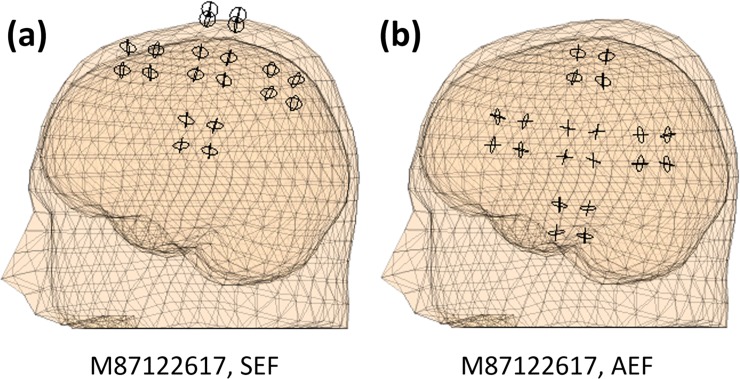
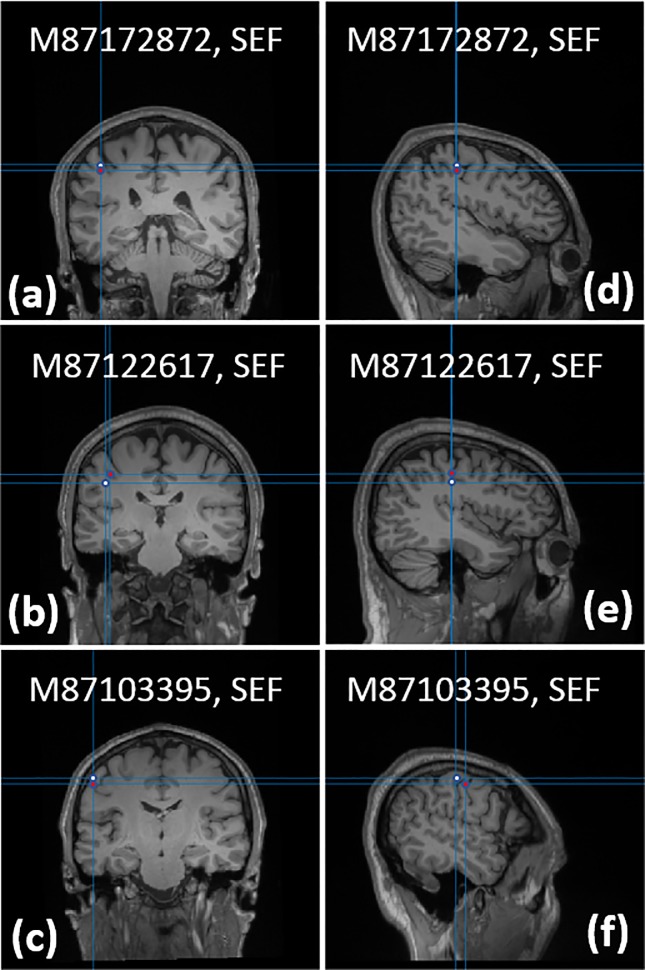
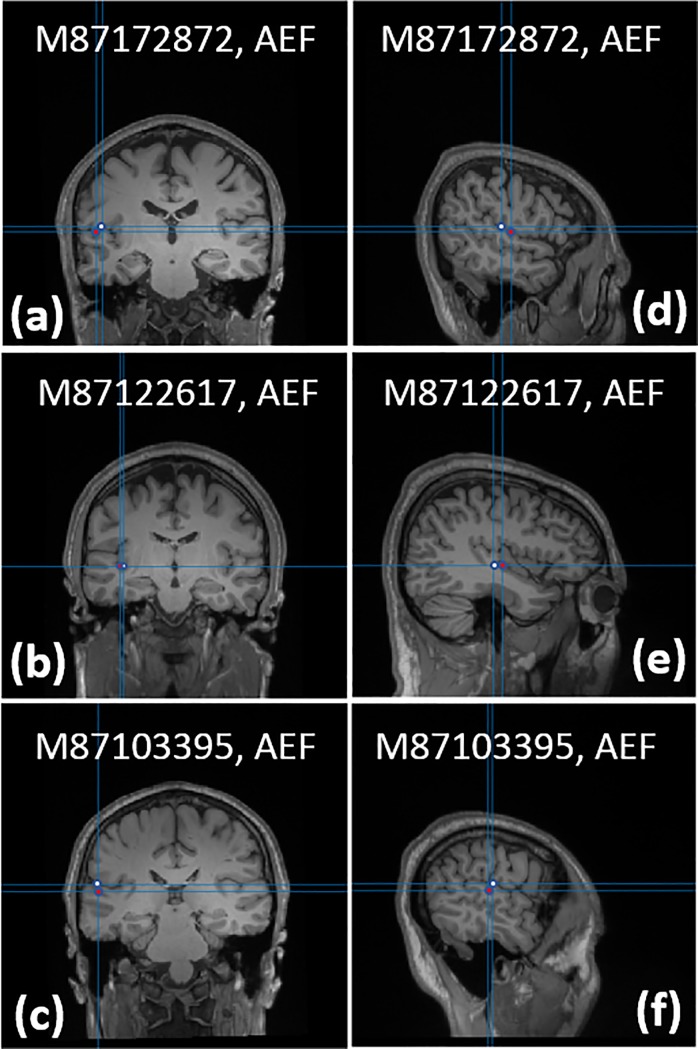
A non-invasive functional-brain-imaging system based on optically-pumped-magnetometers (OPM) is presented. The OPM-based magnetoencephalography (MEG) system features 20 OPM channels conforming to the subject's scalp. We have conducted two MEG experiments on three subjects: assessment of somatosensory evoked magnetic field (SEF) and auditory evoked magnetic field (AEF) using our OPM-based MEG system and a commercial MEG system based on superconducting quantum interference devices (SQUIDs). We cross validated the robustness of our system by calculating the distance between the location of the equivalent current dipole (ECD) yielded by our OPM-based MEG system and the ECD location calculated by the commercial SQUID-based MEG system. We achieved sub-centimeter accuracy for both SEF and AEF responses in all three subjects. Due to the proximity (12 mm) of the OPM channels to the scalp, it is anticipated that future OPM-based MEG systems will offer enhanced spatial resolution as they will capture finer spatial features compared to traditional MEG systems employing SQUIDs.


Conflict of interest statement

Our collaboration with Candoo System and StimScience does not alter our adherence to PLOS ONE policies on sharing data and materials. Mr. James (Jim) McKay of Candoo System in British Columbia, Canada, has technical contribution to system simulation, sensor calibration, and localization algorithms. Dr. Michael Weisend, currently with StimScience, has decades of experience in electrophysiological data analysis and system design. For the presented work, Dr. Weisend has conducted MEG data analysis of SQUID-based MEG system.

Figures

Fig 1
Fig 1. Optically-pumped-magnetometer’s principle of operation.
(1) The rubidium atoms of the vapor cell have randomly oriented atomic spins. (2) Using the circularly polarized pump-laser (795 nm), the spins are oriented in the propagation direction of the pump-laser, generating a macroscopic magnetization of Rb vapor (dotted arrow). (3) Due to an external magnetic field (B) the atomic spins precess, causing the magnetization vector of the ensemble of atoms to have a constant angle relative to the pump beam axis approximately proportional to B. Through rotation of the probe beam polarization due to the Faraday effect, one can deduce the component of magnetization along the pump/probe beam axis.
Fig 2
Fig 2. The OPM sensor’s schematic [8].
PBS: polarizing beam splitter; PM: polarization maintaining, PD: photodiode, λ/2: half wave plate, λ/4: quarter wave plate.
Fig 3
Fig 3. The MEG system block diagram [14].
PD TIA: the transimpedance amplifier which amplifies the currents from the sensors’ photo diodes; temp. CNTRL: temperature control; ADC: analog-to-digital converter; DAC: digital-to-analog converter; SEF/AEF Stimulation: somatosensory/auditory stimulation; Ref.: 1 kHz reference for the software lock-in amplifier.
Fig 4
Fig 4. The MEG system’s signal path: the probe beam’s polarization is converted into electrical current by the sensor’s polarimeter; the amplified electrical current is digitized by a sampling rate of 100 kS/s and a resolution of 24-bit using commercial data acquisition cards; using a custom-designed software lock-in amplifier (LIA) the sensed magnetic flux density is calculated and stored on the host computer’s hard drive.
Fig 5
Fig 5. Stabilizing the gain and sense-angle.
The sense-angle is measured over the course of two hours using single- and double-pump-laser systems. The single-pump-laser system has reduced the sense angle variation by more than an order of magnitude.
Fig 6
Fig 6
OPM array characterization: the histograms of (a) gain across channels, and (b) channels average noise density estimated between 10–44 Hz.
Fig 7
Fig 7
Time-domain waveforms of head position indicator (HPI) coils: (a) the raw waveform of a single channel for all the four individually activated HPI coils, and (b) channel amplitude for a single activated HPI coil.
Fig 8
Fig 8. MEG-MRI co-registration.
(a) SEF and (b) AEF experiments. The circles pertain to the location of OPM channels. For each MEG experiment the OPM array covers the cortex of interest.
Fig 9
Fig 9. ICA components of the somatosensory evoked magnetic fields.
(a) the first six components of the independent component analysis are noisy components and have no contribution to the SEF response. The MEG data will be reconstructed by removing these unwanted components entirely; and (b) noise density comparison of the raw data versus ICA-cleaned data.
Fig 10
Fig 10. Evoked response due to median nerve stimulation showing both the horizontal and vertical field components from all 20 channels.
(a) the raw data including the suspected shield artifact, and (b) the SEF data cleaned by ICA where the large 100 ms component is removed from the data. The inset in (b) depicts the N20m and N30m components. Filter: bandpass 0.1 Hz to 150 Hz.
Fig 11
Fig 11. Time-domain, time-locked MEG data.
(a-c) SEF and (d-f) AEF. The stimulus is presented at 0 s which its onset is indicated with the black markers.
Fig 12
Fig 12
Spatial topographies of SEF (a-c) and AEF (d-f) for all three subjects. N20m and N100m peaks are used to create the field-maps for SEF (at ~20 ms latency) and AEF (at ~100 ms latency), respectively. The field-maps show the measured magnetic flux density (fT). [V]: Vertical axis measurement, [H]: Horizontal axis measurement. A cubic interpolation method is used to interpolate between channels.
Fig 13
Fig 13
Localization of the SEF’s N20m response using equivalent current dipole fitting: (a-c) Coronal and (d-f) Sagittal planes of the dipole location. The white dot shows the dipole location yielded by the OPM-based MEG system and the red dot shows that of the commercial SQUID-based MEG system.
Fig 14
Fig 14
Localization of the AEF’s N100m response using equivalent current dipole fitting: (a-c) Coronal and (d-f) Sagittal planes of the dipole location. The white dot shows the dipole location yielded by the OPM-based MEG system and the red dot shows that of the commercial SQUID-based MEG system.

References

    1. Hämäläinen M, Hari R, Ilmoniemi RJ, Knuutila J, Lounasmaa OV. Magnetoencephalography—theory, instrumentation, and applications to noninvasive studies of the working human brain. Rev Mod Phys. 1993;65(2):413–97.
    1. Aydin U, Vorwerk J, Dumpelmann M, Kupper P, Kugel H, Heers M, et al. Combined EEG/MEG Can Outperform Single Modality EEG or MEG Source Reconstruction in Presurgical Epilepsy Diagnosis. Plos One. 2015;10(3):29. - PMC - PubMed
    1. Hari R, Puce A. MEG-EEG Primer: Oxford University Press; 2007.
    1. Taulu S, Simola J. Spatiotemporal signal space separation method for rejecting nearby interference in MEG measurements. Physics in Medicine and Biology. 2006;51(7):1759–68. 10.1088/0031-9155/51/7/008 - DOI - PubMed
    1. Taulu S, Kajola M. Presentation of electromagnetic multichannel data: The signal space separation method. Journal of Applied Physics. 2005;97(12).

Publication types

MeSH terms