. 2020 Jun 1;152(6):e201912498.
doi: 10.1085/jgp.201912498.

Wheat germ agglutinin-conjugated fluorescent pH sensors for visualizing proton fluxes

Affiliations

Wheat germ agglutinin-conjugated fluorescent pH sensors for visualizing proton fluxes

Lejie Zhang et al. J Gen Physiol. .

Abstract

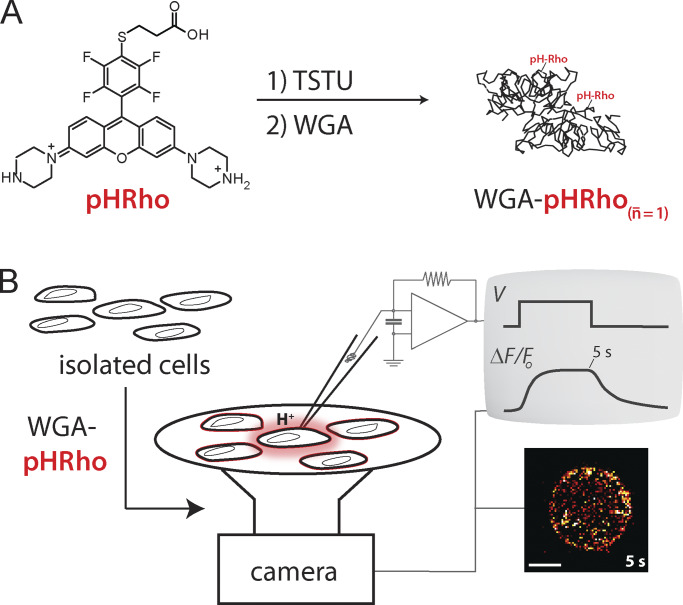
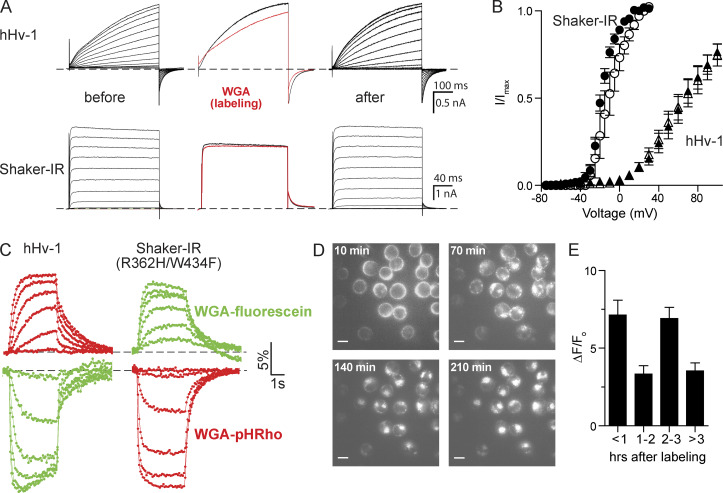
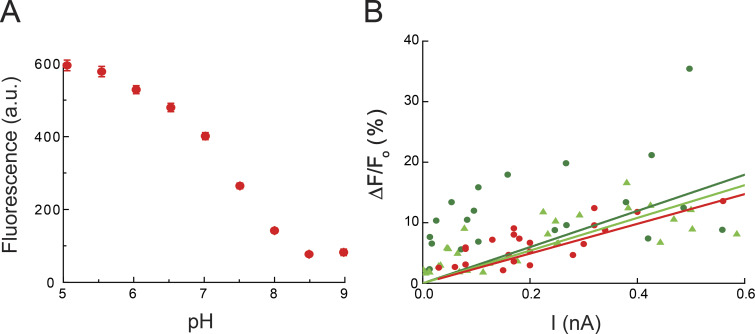
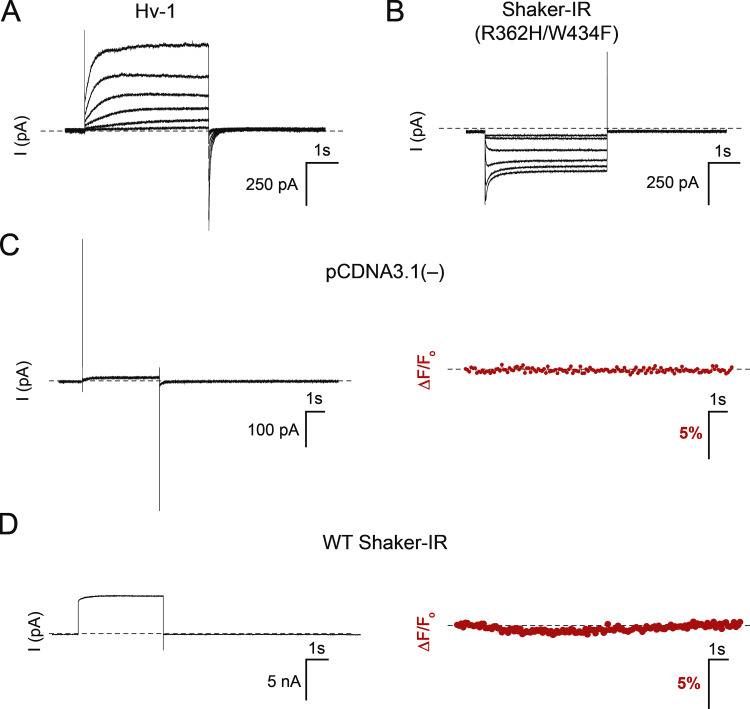
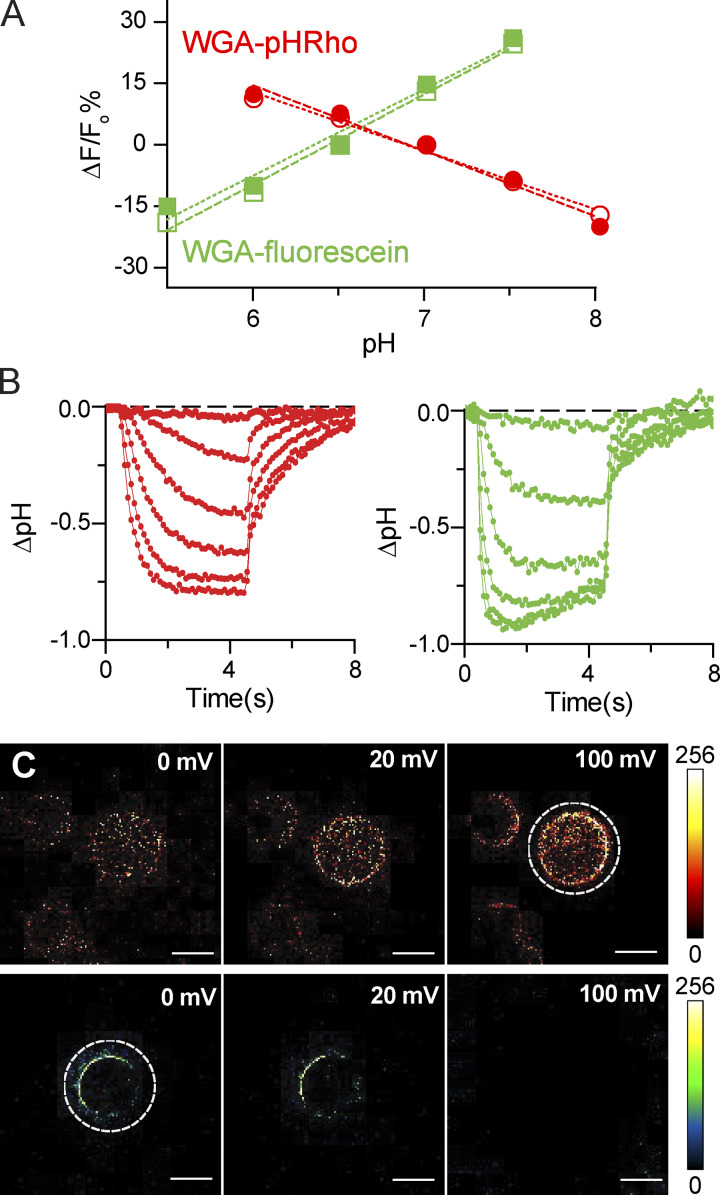
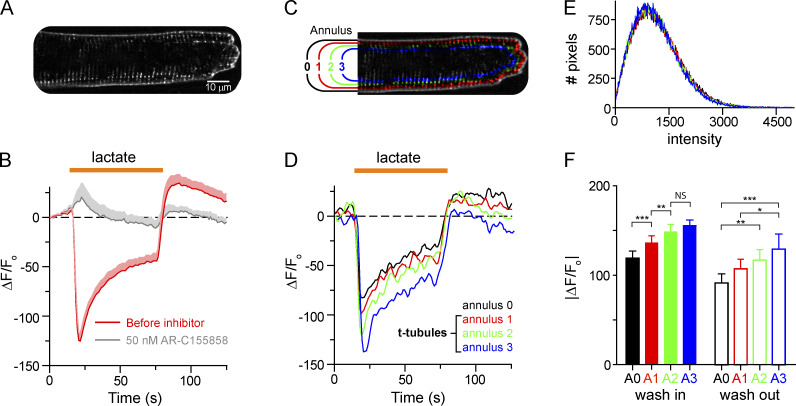
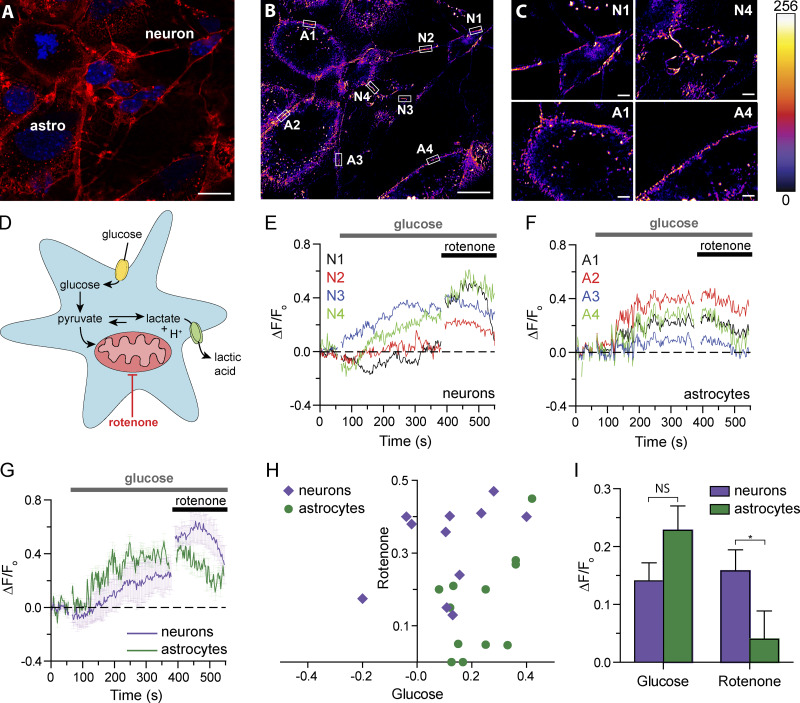
Small-molecule fluorescent wheat germ agglutinin (WGA) conjugates are routinely used to demarcate mammalian plasma membranes, because they bind to the cell's glycocalyx. Here, we describe the derivatization of WGA with a pH-sensitive rhodamine fluorophore (pHRho; pKa = 7) to detect proton channel fluxes and extracellular proton accumulation and depletion from primary cells. We found that WGA-pHRho labeling was uniform and did not appreciably alter the voltage gating of glycosylated ion channels, and the extracellular changes in pH correlated with proton channel activity. Using single-plane illumination techniques, WGA-pHRho was used to detect spatiotemporal differences in proton accumulation and depletion over the extracellular surface of cardiomyocytes, astrocytes, and neurons. Because WGA can be derivatized with any small-molecule fluorescent ion sensor, WGA conjugates should prove useful to visualize most electrogenic and nonelectrogenic events on the extracellular side of the plasma membrane.


Figures

Figure 1.
Figure 1.
Derivatization of WGA with a small-molecule fluorescent pH sensor and cell surface labeling to visualize plasma membrane proton fluxes. (A) Synthetic scheme of WGA-pHRho. Using the degree of labeling equation (Materials and methods) on average, one WGA monomer is labeled with one pHRho molecule that is activated with N,N,N′,N′-tetramethyl-O-(N-succinimidyl) uronium tetrafluoroborate (TSTU). The doubly labeled WGA homodimer is shown. (B) Cartoon depiction of the whole-cell patch-clamp fluorometry approach to visualize proton fluxes with WGA-pHRho.
Figure 2.
Figure 2.
WGA labeling and voltage-clamp fluorometry of CHO cells expressing voltage-gated channels. (A) hHv-1 (top) and Shaker-IR (bottom) currents were recorded before (left) and after (right) WGA labeling (50 µg/ml). Middle panels are currents before (black) and after (red) WGA wash-in at 60 mV. Cells were held at −80 mV, hHv-1 depolarized for 0.5 s from −50 to 100 in 10-mV increments, and Shaker-IR depolarized for 0.2 s from −70 to 60 mV in 10-mV increments. (B) G-V curves of hHv-1 (V0.5 = 68 ± 6 mV, n = 8, triangles) and Shaker-IR (V0.5 = −18 ± 1 mV, n = 5, circles) before (closed) and after (open) WGA treatment. hHv-1: V0.5 = 67 ± 8 mV, n = 9; Shaker-IR: V0.5 = −11 ± 1 mV, n = 6. (C) Voltage-clamp fluorometry traces from cells labeled with WGA-pHRho (red) and homemade WGA-fluorescein (green). hHv-1 (left) was held at −80 mV, and changes in fluorescence were elicited from 4-s depolarizations from 0 to 100 mV in 20-mV increments. Shaker-IR R362H (right) was held at 30 mV, and fluorescence was elicited from 4-s command voltages from −120 to −20 mV in 20-mV increments. (D) Representative fluorescent images of CHO cells 10–210 min after labeling with WGA-pHRho for 30 min; scale bars represent 10 µm. (E) Bar graph of ΔF/F0 from hHv-1 expressing cells after a 4-s 80-mV depolarization versus time after WGA-pHRho labeling. n = 3 experiments. Error bars represent SEM.
Figure S1.
Figure S1.
Characterization of pH-sensitive WGA conjugates, related to Fig. 2. (A) Fluorescence-pH plot of WGA-pHRho in solution; excitation wavelength, 550 nm. a.u., arbitrary units. (B) ΔF/F0-I plot of WGA-pHRho (red), homemade WGA-fluorescein (dark green), and WGA-fluorescein from Vector Laboratories (light green).
Figure S2.
Figure S2.
Changes in WGA-pHRho fluorescence requires exogenous expression of proton channels in CHO cells. Related to Fig. 2. (A and B) Current–voltage relationships for (A) Hv-1 and (B) Shaker-IR (R362H/W434F) expressed in CHO cells. Hv-1 was held at −80 mV, and currents were elicited from 4-s command voltages from 0 to 100 mV in 20-mV increments; Shaker-IR (R362H/W434F) was held at 30 mV, and the currents were elicited from 4-s command voltages from −120 to −20 mV in 20-mV increments. (C and D) Voltage-clamp fluorometry of CHO cells transfected with either (C) pCDNA3.1(−) or (D) WT Shaker-IR controls. The cells were held at −80 mV and depolarized to for 4 s; pCDNA3.1(−), 100 mV; WT Shaker-IR, 20 mV. An outward pH gradient (pHo/pHi = 7.5/6.0) was used in A and C, and an inward pH gradient (pHo/pHi = 6.0/7.5) was used in B and D. The buffer (HEPES) capacity was 0.1 mM for all experiments.
Figure 3.
Figure 3.
Cell surface pH calibration of WGA-pHRho and WGA-fluorescein. (A) CHO cells were labeled with either WGA-fluorescein or WGA-pHRho, and the change of fluorescence (ΔF/F0%) was plotted using pH standards (HEPES; 1 mM, open symbols; 10 mM, closed symbols); Fo was chosen to be at the approximate pKa of each sensor (pH 7.0 for WGA-pHRho and pH 6.5 for WGA-fluorescein). The linear fits for WGA-pHRho were pH = 6.99 − 0.06 × [ΔF/F0] and pH = 6.91 − 0.07 × [ΔF/F0] for 1 and 10 mM, respectively; the linear fits for WGA-fluorescein were pH = 6.51 + 0.05 × [ΔF/F0] and pH = 6.52 + 0.05 × [ΔF/F0] for 1 and 10 mM, respectively. (B) Conversion of ΔF/F0 (%) to CHO cells expressing hHv-1 were held at −80 mV, and changes in fluorescence were elicited from 4-s depolarizations from 0 to 100 mV in 20-mV increments and converted into ΔpH using the calibration curves in A; WGA-pHRho, red; WGA-fluorescein, green. (C) ΔF/F0 images of cells expressing hHv-1 taken at 4 s shown in B. Top: WGA-pHRho; bottom: WGA-fluorescein. Dotted white circles indicate the voltage-clamped cell. White scale bars represent 10 μm.
Figure 4.
Figure 4.
Structured light microscopy of lactate-stimulated proton transport in rat ventricular myocytes labeled with WGA-pHRho. (A) A ∼750-nm illuminated z-plane of a WGA-pHRho–labeled ventricular myocyte ∼2 μm above the coverslip focal plane. (B) Time course of 10 mM lactate perfusion before (red) and after addition of 50 nM AR-C155858 (gray). Plotted data are mean + SEM (shading) for clarity (n = 6 cells); data were collected at 1 Hz. (C) Pseudocolor image depicting the eroding pixel (5 px) analysis to generate the four annuli. (D) Changes of ΔF/F0 before, during, and after perfusion of 10 mM lactate at each annulus (A0–A3). (E) Pixel intensity histogram of the four annuli (area normalized) for cell shown in A. (F) Average maximal |ΔF/F0| upon wash in (solid bars) and wash out (open bars) of 10 mM lactate for nine cells. One-way ANOVA (Bonferroni's multiple comparison test) was used to determine significance (*, P < 0.05; **, P < 0.01; ***, P < 0.001). Error bars represent SEM.
Figure 5.
Figure 5.
Proton efflux from primary neuron–astrocyte cocultures labeled with WGA-pHRho. (A) Merged Airyscan image of the neuronal and astrocyte planes labeled with WGA-pHRho (red) and DAPI (blue). (B) Pseudocolor image showing the averaged ΔF/F0 of the regions of interest (ROI) in A after glucose addition. Red shades indicate more activity over time. ROI are denoted by white boxes (A, astrocyte; N, neuron). Data were collected at 2 Hz. Scale bars represent 10 μm in A and B. (C) Magnified images of two astrocytes and neurons in B to show labeling coverage; 8-bit pseudo-color intensity scale bar is for panels in B and C. Scale bars represent 2 μm. (D) Cartoon depiction of the metabolic pathways expected to be affected by glucose starvation and rotenone mitochondrial poisoning. (E and F) Time courses of the (E) neuronal and (F) astrocytic pHRho signal during glucose (3 mM) and rotenone (100 µM) addition for the exemplar in B. (G) Averaged data from E and F (total number of cells in the plot: four neurons and four astrocytes from one single dish; this average is considered n = 1). Error bars represent SEM. (H) Variation of the neuronal and astrocytic responses to glucose and rotenone; 11–12 ROIs from dishes from three animals. (I) Maximal change in ΔF/F0 (n = 4–6 dishes) for glucose and rotenone treatment, comprising a total of 19 neurons and 21 astrocytes in total; error bars represent SEM. A paired t test was used to determine significance (*, P < 0.05).

Similar articles

Cited by

References

    1. Aigner D., Borisov S.M., Fernández F.J., Fernández Sánchez J.F., Saf R., and Klimant I.. 2012. New fluorescent pH sensors based on covalently linkable PET rhodamines. Talanta. 99:194–201. 10.1016/j.talanta.2012.05.039 - DOI - PMC - PubMed
    1. Aras M.A., Hartnett K.A., and Aizenman E.. 2008. Assessment of cell viability in primary neuronal cultures. Curr. Protoc. Neurosci. Chapter 7:Unit 7.18. - PubMed
    1. Colecraft H.M., Alseikhan B., Takahashi S.X., Chaudhuri D., Mittman S., Yegnasubramanian V., Alvania R.S., Johns D.C., Marbán E., and Yue D.T.. 2002. Novel functional properties of Ca(2+) channel beta subunits revealed by their expression in adult rat heart cells. J. Physiol. 541:435–452. 10.1113/jphysiol.2002.018515 - DOI - PMC - PubMed
    1. Dimmer K.-S., Friedrich B., Lang F., Deitmer J.W., and Bröer S.. 2000. The low-affinity monocarboxylate transporter MCT4 is adapted to the export of lactate in highly glycolytic cells. Biochem. J. 350:219–227. 10.1042/bj3500219 - DOI - PMC - PubMed
    1. Fukui M., Yamada M., Akune Y., Shigeyasu C., and Tsubota K.. 2016. Fluorophotometric Analysis of the Ocular Surface Glycocalyx in Soft Contact Lens Wearers. Curr. Eye Res. 41:9–14. 10.3109/02713683.2014.999948 - DOI - PubMed

Publication types