. 2020 Jan-Dec;12(1):1717265.
doi: 10.1080/19420862.2020.1717265.

In situ antibody phage display yields optimal inhibitors of integrin α11/β1

Affiliations

In situ antibody phage display yields optimal inhibitors of integrin α11/β1

Eugenio Gallo et al. MAbs. 2020 Jan-Dec.

Abstract

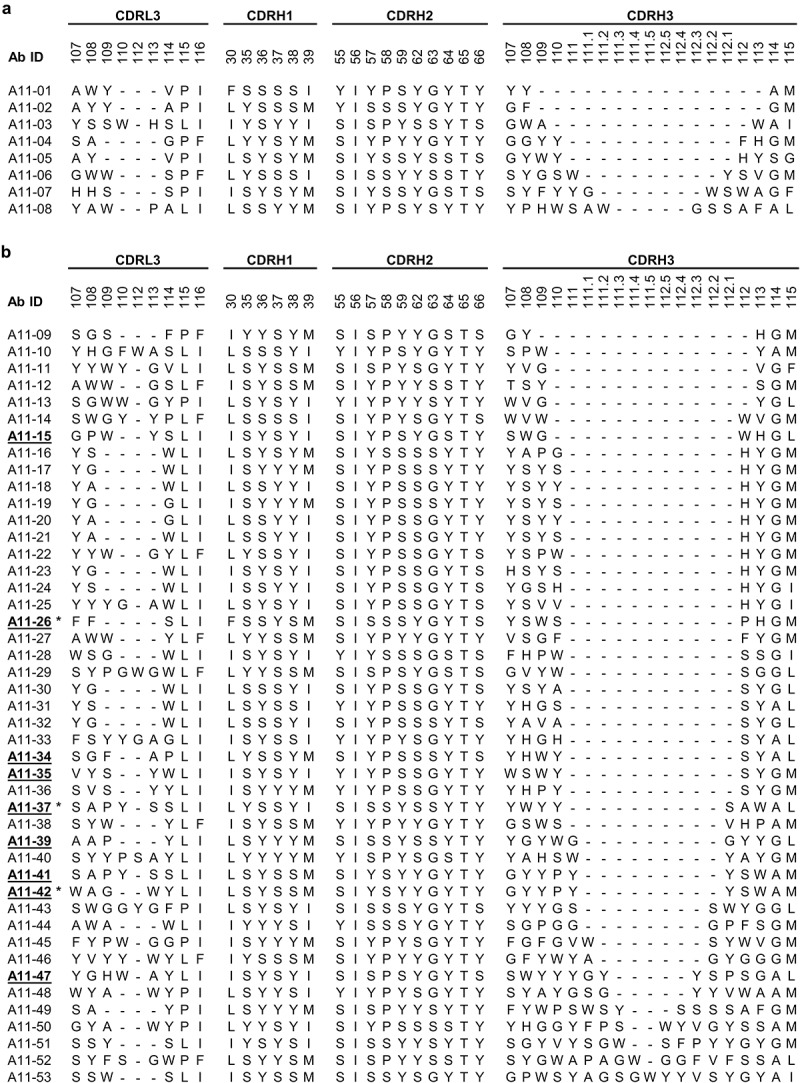
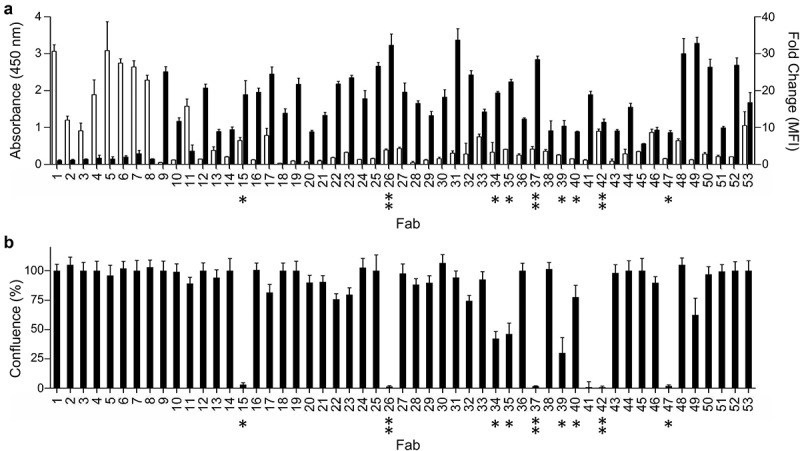
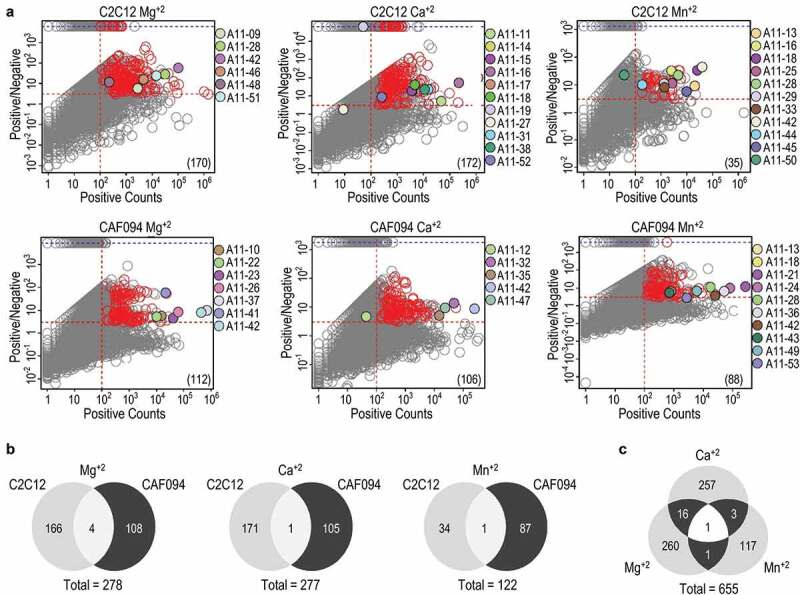
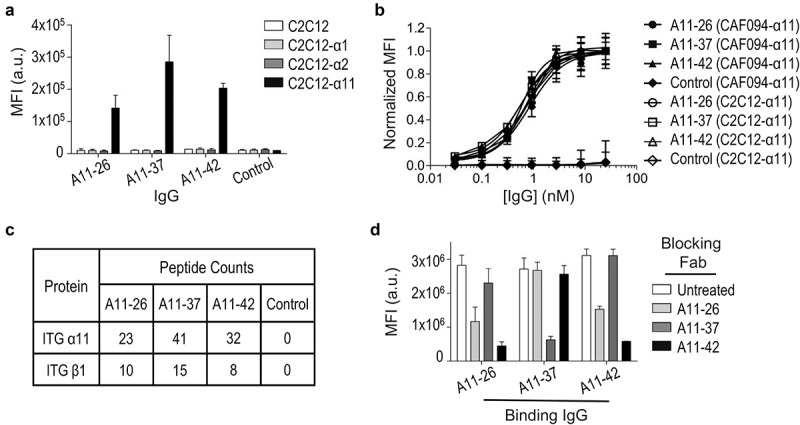
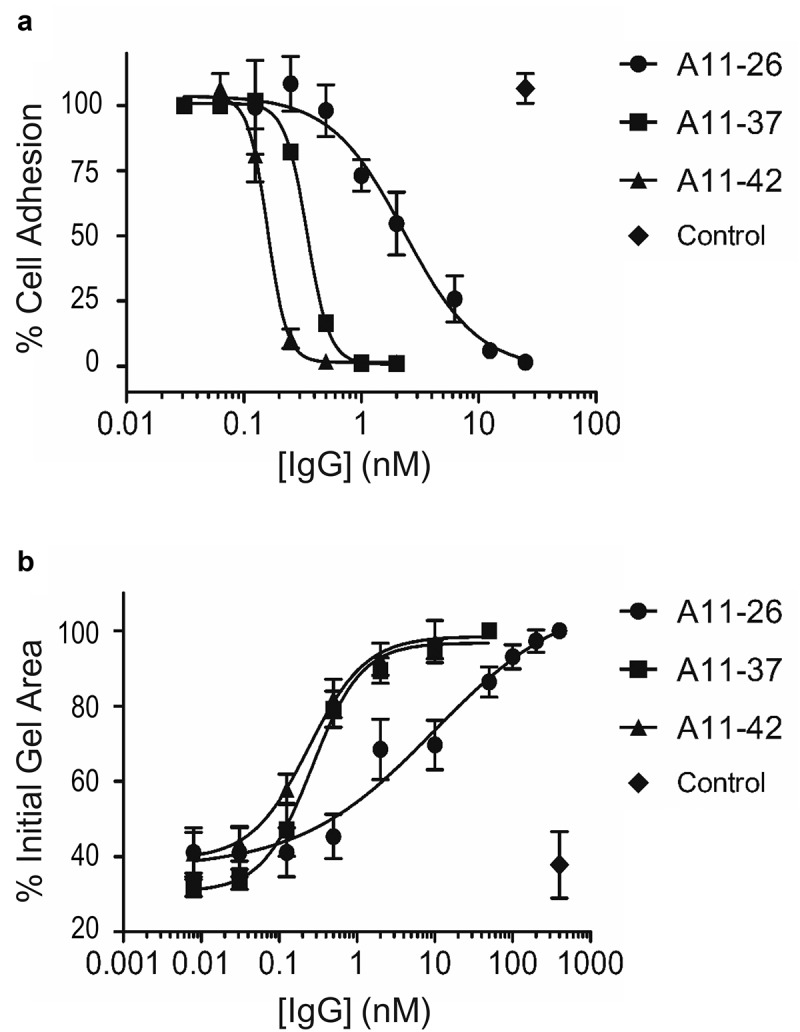
Integrins are transmembrane multi-conformation receptors that mediate interactions with the extracellular matrix. In cancer, integrins influence metastasis, proliferation, and survival. Collagen-binding integrin-α11/β1, a marker of aggressive tumors that is involved in stroma-tumor crosstalk, may be an attractive target for anti-cancer therapeutic antibodies. We performed selections with phage-displayed synthetic antibody libraries for binding to either purified integrin-α11/β1 or in situ on live cells. The in-situ strategy yielded many diverse antibodies, and strikingly, most of these antibodies did not recognize purified integrin-α11/β1. Conversely, none of the antibodies selected for binding to purified integrin-α11/β1 were able to efficiently recognize native cell-surface antigen. Most importantly, only the in-situ selection yielded functional antibodies that were able to compete with collagen-I for binding to cell-surface integrin-α11/β1, and thus inhibited cell adhesion. In-depth characterization of a subset of in situ-derived clones as full-length immunoglobulins revealed high affinity cellular binding and inhibitory activities in the single-digit nanomolar range. Moreover, the antibodies showed high selectivity for integrin-α11/β1 with minimal cross-reactivity for close homologs. Taken together, our findings highlight the advantages of in-situ selections for generation of anti-integrin antibodies optimized for recognition and inhibition of native cell-surface proteins, and our work establishes general methods that could be extended to many other membrane proteins.

Keywords: Enhanced diversity; ITGA11; antibody selections; cancer therapeutics; cellular selections; integrin-α11/β1 receptor.


Figures

Figure 1.
Figure 1.
Sequences of integrin-α11/β1 Abs. Abs were isolated by screening a phage-displayed Fab library for binding to (a) purified integrin-α11/β1 or (b) integrin-α11/β1 displayed on live cells. Sequences are shown for positions that were diversifed in the library and are numbered according to the IMGT nomenclature.39 Dashes indicate gaps in the alignment. Underlined bold text indicates Abs that inhibited integrin-α11/β1 binding to collagen-1, and asterisks (*) indicate Abs that were also characterized as full-length immunoglobulins.
Figure 2.
Figure 2.
Binding and function of anti-integrin-α11/β1 Fabs. (a) Binding of Fabs (x-axis) to purified integrin-α11/β1 (white bars, y-axis, left) or C2C12-α11/β1 cells (black bars, y-axis, right). Binding to purified or cell-surface integrin-α11/β1 was assessed by ELISA or flow cytometry, respectively. Data are shown for single-point measurements, and error bars indicate the standard deviation (SD) of two independent experiments. (b) Effects of Fabs (x-axis) on adhesion of C2C12-α11/β1 cells to collagen-I (y-axis). Asterisks (*) indicate Fabs that inhibited cell adhesion to collagen-I, and double asterisks (**) indicate Abs that were also characterized as full-length immunoglobulins. See Materials and Methods for details. Data are shown for single-point measurements, and error bars indicate SD of two independent experiments.
Figure 3.
Figure 3.
NGS analysis of Fab-phage clones selected for binding to cells displaying integrin-α11/β1. (a) The abundance of each sequence in Fab-phage pools selected for binding to integrin-α11/β1 overexpressing cells (x-axis) is plotted versus the ratio of the abundance in pools selected for binding to cells overexpressing integrin-α11/β1 over pools selected for binding to cells not expressing integrin-α11/β1 (positive/negative, y-axis). Selections were performed with C2C12 mouse myoblast cells or human CAF cells in the presence of the indicated cation. Each circle represents a unique paratope (i.e., a unique combination of CDRs L3, H1, H2 and H3). The dashed lines define an upper-right quadrant that contains putative integrin-α11/β1-binding clones, defined arbitrarily as those occurring more than 100 times in the positive pool and being greater than two-fold enriched relative to the negative pool. Clones that were validated as specific integrin-α11/β1-binding Abs by ELISA screening (Figure 1) are shown as filled circles, colored as indicated. Each red circle represents the highest abundance and enrichment clone of a family cluster based on unique CDR L3 and H3 sequences (see Materials and Methods) that was not validated by ELISA, but is predicted to bind to integrin-α11/β1. The number in parentheses in the lower right quadrant is the number of unique potential integrin-α11/β1-binding clones in each upper-right quadrant, which is the sum of the validated (filled circles) and putative binders (red circles). (b) Venn diagrams for potential integrin-α11/β1-binding clones selected with the two different cell lines in the presence of Mg+2, Ca+2, or Mn+2. The total unique clones are indicated at the bottom. (c) Venn diagram for total unique potential integrin-α11/β1-binding clones selected under the indicated cation conditions.
Figure 4.
Figure 4.
Characterization of full-length anti-integrin-α11/β1 immunoglobulins. (a) Binding of anti-integrin-α11/β1 IgGs and a negative control IgG (x-axis) to C2C12 cells engineered to express the indicated integrins, assessed by flow cytometry fluorescence (y-axis). Data are shown for single-point measurements, and error bars indicate SD of two independent experiments. (b) Dose response curves for anti-integrin-α11/β1 IgGs and a negative control IgG (x-axis) binding to CAF094-α11/β1 or C2C12-α11/β1 cells, assessed by flow cytometry fluorescence (y-axis). Mean fluorescence intensity signals were normalized to the highest concentration value for each sample, and error bars indicate SD of two independent experiments. (c) Peptide counts for IP-MS analysis of CAF094-α11/β1 cell lysates immunoprecipitated with anti-integrin-α11/β1 IgGs or a negative control IgG. (d) Blocking of anti-integrin-α11/β1 IgGs (x-axis) binding to CAF094-α11/β1 cells by indicated Fabs, assessed by flow cytometry fluorescence (y-axis). Data are shown for single-point measurements, and error bars indicate SD of two independent experiments.
Figure 5.
Figure 5.
Effects of immunoglobulins on integrin-α11/β1 function in cells. (a) Dose response curves for the effects of anti-integrin-α11/β1 IgGs and a negative control IgG (x-axis) on adhesion of C2C12-α11/β1 cells to collagen-I (y-axis). Assays were performed in DPBS containing 10 mM CaCl2 and 5 mM MgCl2 (b) Dose response curves for the effects of anti-integrin-α11/β1 IgGs and a negative control IgG (x-axis) on collagen-I gel contraction with C2C12-α11/β1cells. Assays were performed in serum-free DMEM. The means of at least three independent experiments are plotted and bars denote the standard deviation.

References

    1. Hynes RO. Integrins: bidirectional, allosteric signaling machines. Cell. 2002;110:673–11. doi:10.1016/S0092-8674(02)00971-6. - DOI - PubMed
    1. Hood JD, Cheresh DA. Role of integrins in cell invasion and migration. Nat Rev Cancer [Internet]. 2002. [accessed 2019 November18];2:91–100. http://www.ncbi.nlm.nih.gov/pubmed/12635172. - PubMed
    1. Cabodi S, Moro L, Bergatto E, Boeri Erba E, Di Stefano P, Turco E, Tarone G, Defilippi P. Integrin regulation of epidermal growth factor (EGF) receptor and of EGF-dependent responses. Biochem Soc Trans [Internet]. 2004. [accessed 2016 February20];32:438–42. http://www.ncbi.nlm.nih.gov/pubmed/15157155. - PubMed
    1. Montresor A, Bolomini-Vittori M, Toffali L, Rossi B, Constantin G, Laudanna C. JAK tyrosine kinases promote hierarchical activation of Rho and Rap modules of integrin activation. J Cell Biol [Internet]. 2013. [accessed 2016 February20];203:1003–19. http://www.pubmedcentral.nih.gov/articlerender.fcgi?artid=3871442&tool=p.... - PMC - PubMed
    1. Eberwein P, Laird D, Schulz S, Reinhard T, Steinberg T, Tomakidi P. Modulation of focal adhesion constituents and their down-stream events by EGF: on the cross-talk of integrins and growth factor receptors. Biochim Biophys Acta, Mol Cell Res [Internet]. 2015. [accessed 2016 January9];1853:2183–98. http://www.ncbi.nlm.nih.gov/pubmed/26079101. - PubMed

Publication types

Grants and funding