. 2020 Mar 5;10(3):1099-1112.
doi: 10.1534/g3.119.400967.

Multiple Requirements for Rab GTPases in the Development of Drosophila Tracheal Dorsal Branches and Terminal Cells

Affiliations

Multiple Requirements for Rab GTPases in the Development of Drosophila Tracheal Dorsal Branches and Terminal Cells

Benedikt T Best et al. G3 (Bethesda). .

Abstract

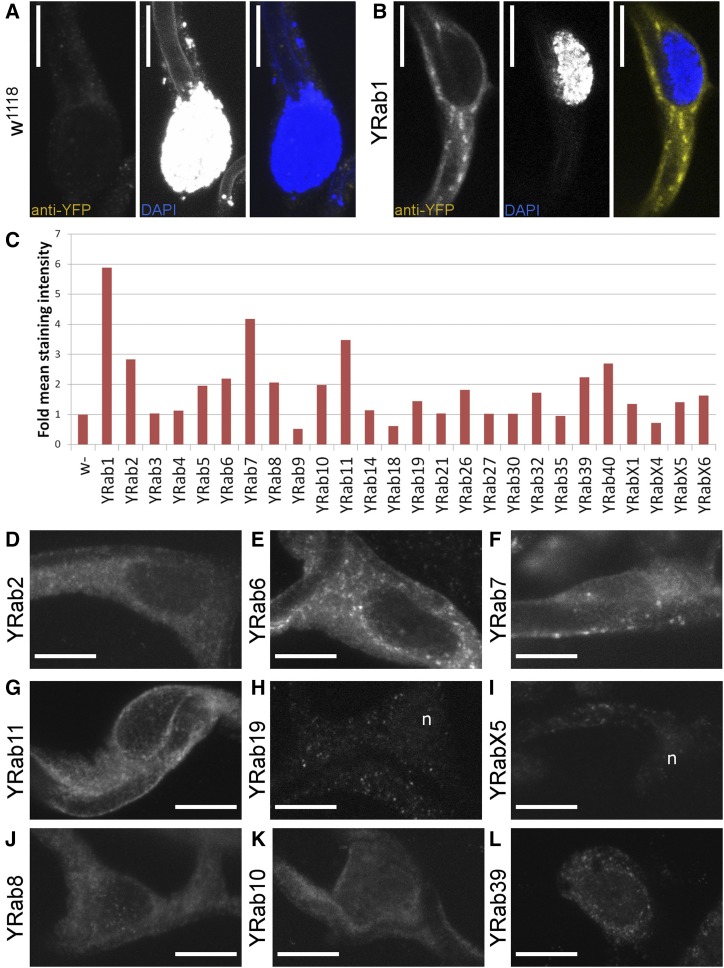
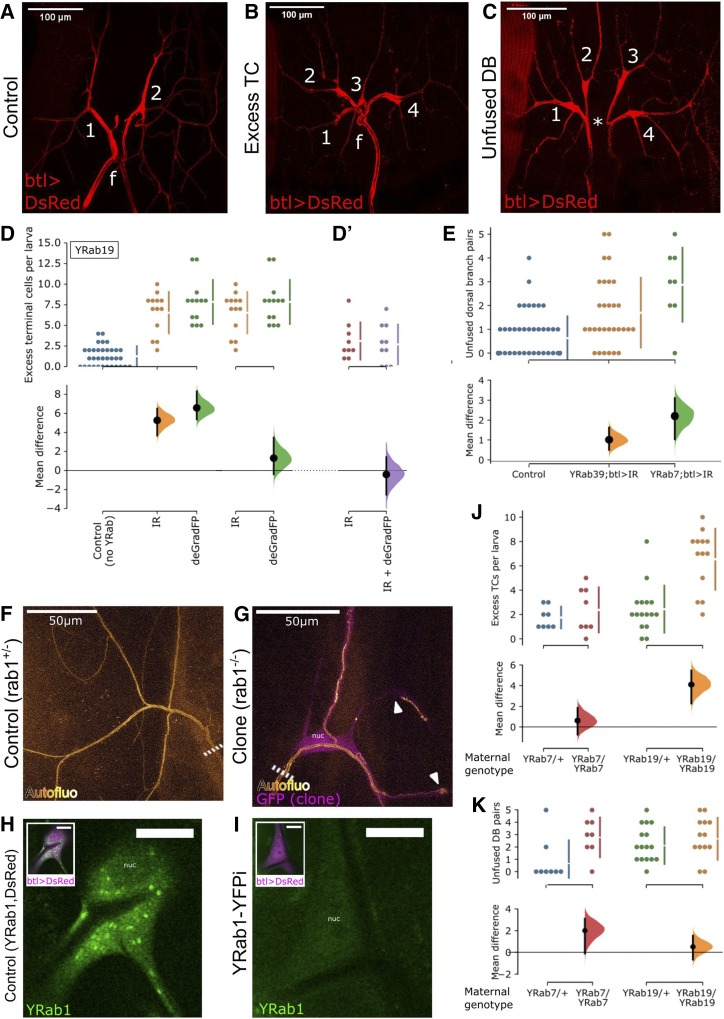
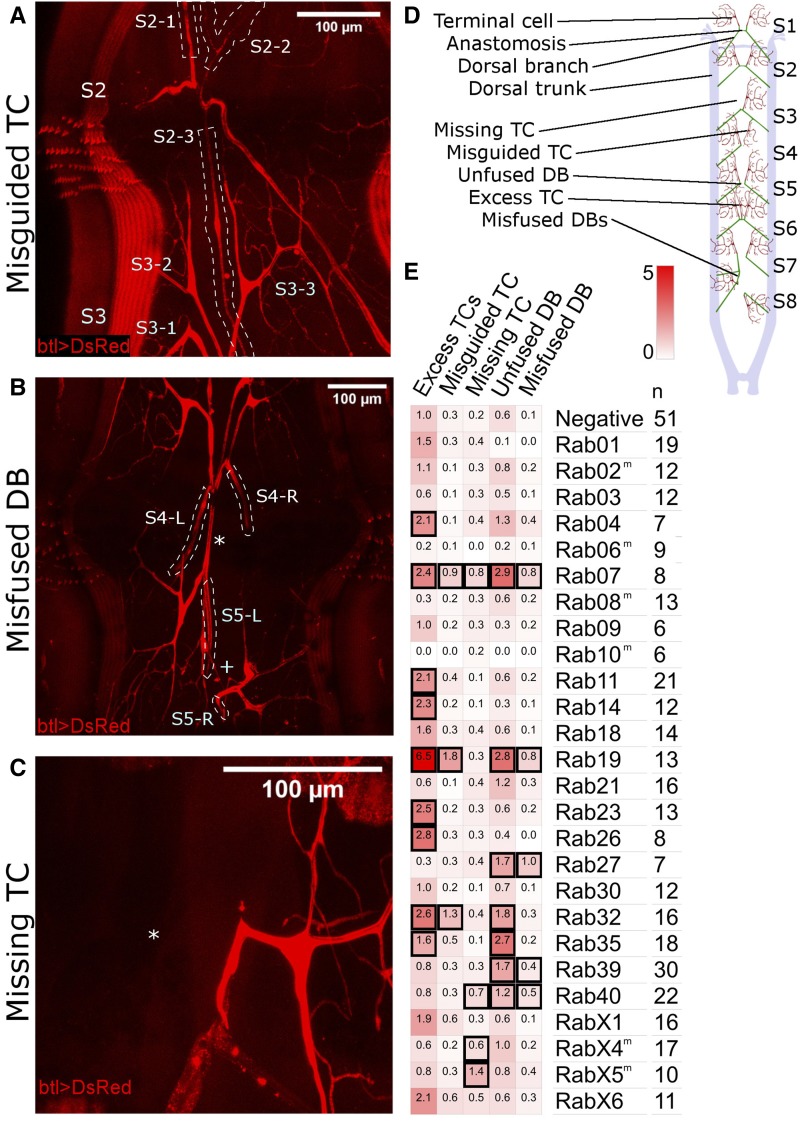
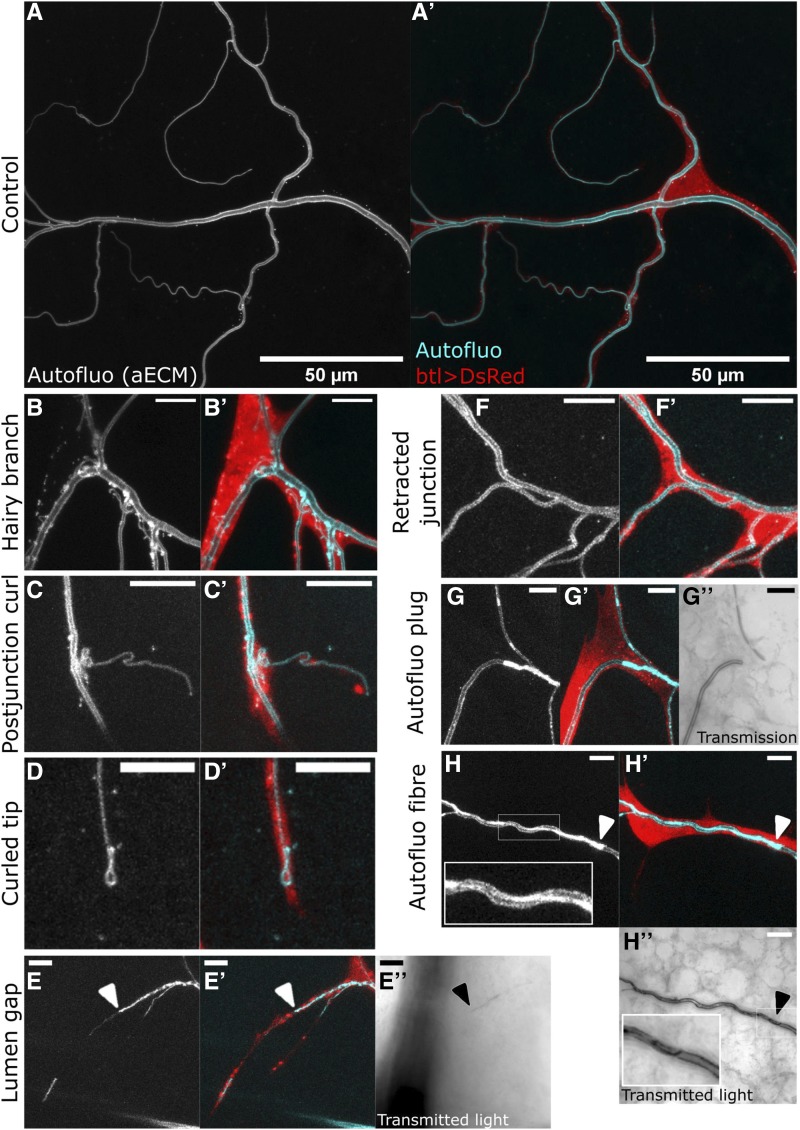
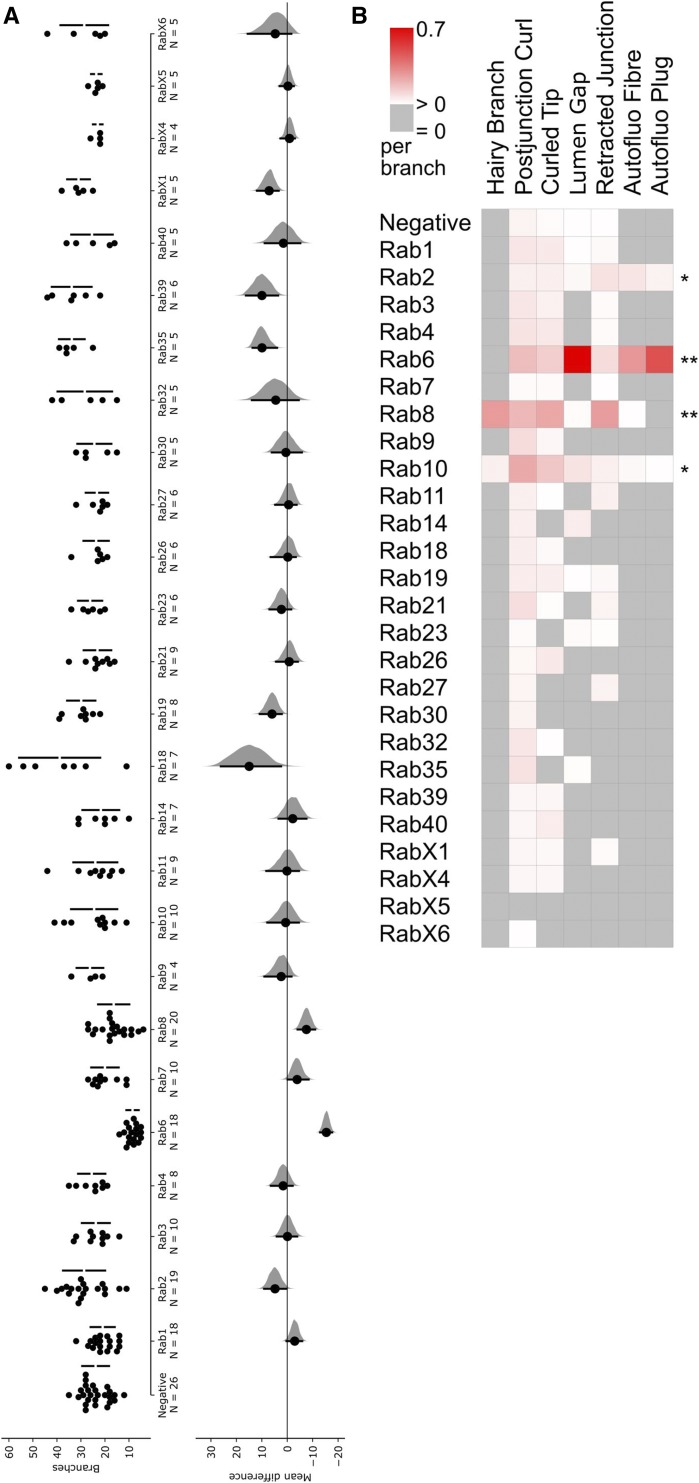
The tracheal epithelium in fruit fly larvae is a popular model for multi- and unicellular migration and morphogenesis. Like all epithelial cells, tracheal cells use Rab GTPases to organize their internal membrane transport, resulting in the specific localization or secretion of proteins on the apical or basal membrane compartments. Some contributions of Rabs to junctional remodelling and governance of tracheal lumen contents are known, but it is reasonable to assume that they play important further roles in morphogenesis. This pertains in particular to terminal tracheal cells, specialized branch-forming cells that drastically reshape both their apical and basal membrane during the larval stages. We performed a loss-of-function screen in the tracheal system, knocking down endogenously tagged alleles of 26 Rabs by targeting the tag via RNAi. This revealed that at least 14 Rabs are required to ensure proper cell fate specification and migration of the dorsal branches, as well as their epithelial fusion with the contralateral dorsal branch. The screen implicated four Rabs in the subcellular morphogenesis of terminal cells themselves. Further tests suggested residual gene function after knockdown, leading us to discuss the limitations of this approach. We conclude that more Rabs than identified here may be important for tracheal morphogenesis, and that the tracheal system offers great opportunities for studying several Rabs that have barely been characterized so far.

Keywords: apical extracellular matrix; branching morphogenesis; cell fate; cell-cell signaling; nanobody.


Figures

Figure 1
Figure 1
Expression of Rab proteins in Drosophila tracheal terminal cells. L3 wandering stage larvae with endogenously YFP-tagged Rab alleles were dissected and stained against YFP (using an anti-GFP antibody that cross-reacts with the YFP tag). All images show the main body of a dorsal terminal cell (TC) including its nucleus. Scale bars, 10 µm. (A) Negative control TC in a larva expressing no GFP or YFP. All anti-GFP antibodies tested produced a weak punctate staining in negative controls (see Methods). The DAPI channel in this case also captured autofluorescence from the apical extracellular matrix in the subcellular tube’s lumen. (B) TC in a larva with endogenously YFP-tagged Rab1 (YRab1), which shows the strongest endogenous YFP fluorescence and staining out of all YRabs. (C) Quantification of protein expression according to staining intensity relative to negative control. Some samples had lower intensities than the control due to a weak punctate staining in negative controls (see Methods). (D-L) Examples of TCs (YFP expression) in larvae of the indicated genotypes. (D-G) Strongly expressed YRabs. These YRabs (1, 2, 6, 7, 11) can be detected both by immunofluorescent staining and by endogenous YFP fluorescence. (H and I) Two YRabs that were undetectable in TCs but nevertheless were associated with strong phenotypes in the knockdown screen (see Fig. 3). n, nucleus. (J-L) Three further YRabs of intermediate expression levels that were associated with TC phenotypes (8 and 10, Fig. 4 and 5) or dorsal branch phenotypes (39, Fig. 2 and 3).
Figure 2
Figure 2
Characterization of Rab depletion via an endogenously inserted YFP-tag (YRab-YFPi). YRab-homozygous virgins with either a UAS-GFP-knockdown construct or the btl-gal4 and UAS-DsRed constructs were crossed to YRab males with the respective complementary construct(s) to obtain YRab-homozygous larvae expressing the GFP-knockdown transgene and DsRed in tracheal cells. Anterior is up in all micrographs. (A-C) Dorsal branches (DBs) and terminal cells (TCs) of one tracheal metamere in third-instar wandering larvae expressing DsRed and GFP-IR-1 in all tracheal cells. Numbers, terminal cells. f, dorsal fusion. (A) Control larva with no YFP-tagged Rab. Two dorsal branches (DBs) fuse at the dorsal midline. On each DB, one TC ramifies with multiple branches distal to the anastomosis. (B) Example of a tracheal metamere with two excess TCs in a YRab19-YFPi larva. (C) Example of an unfused DB pair (* missing anastomosis), with an excess TC on each side, in a YRab19-YFPi larva. (D) Comparison of two knockdown constructs to deplete YRab19. YRab19-homozygous larvae expressing either GFP-IR-1 (orange) or deGradFP (green) in tracheal cells were scored for excess TCs. Negative control (blue) refers to larvae expressing GFP-IR-1 under btl-gal4 but with no YRab. Top: dotplots showing number of excess TCs in each larva observed, and mean ± SD (bars next to dotplot). Bottom: estimation of the effect size relative to the respective comparison sample showing mean difference (black dot), 95% confidence interval (black bars) and distribution of bootstrapped mean differences (colored). (D’) Second experiment similar to (D), comparing GFP-IR-1 single knockdown (red) to combined knockdown using both GFP-IR-1 and deGradFP (purple). As in (D), larvae were YRab19-homozygous and expressed the respective knockdown construct(s) in tracheal cells, and were scored for the same phenotype. The two experiments were done separately and data cannot be cross-compared. (E) Frequency of unfused DB pairs in control (blue), YRab39- (orange) and YRab7-YFPi (green) larvae. Each dot shows the number of unfused DB pairs in one larva (out of in total 8 DB pairs). Estimation statistics are plotted as in (D). (F-G) MARCM clone TCs mutant for rab1 show abnormalities in the apical extracellular matrix (aECM) that were not reproduced by the YRab1-YFPi knockdown. Compare Fig. 4 and 5. Dashed line, stalk of the TC. (F) Autofluorescence of the aECM in a negative control TC heterozygous for a mutation in rab1. This phenotype is identical to wildtype TCs. (G) Homozygous rab1 mutant TC labeled by cytoplasmic GFP. The aECM reveals abnormalities such as curls near branch tips and disruptions of the tube along stretches of a branch (arrowheads). (H-I) TCs in third-instar wandering larvae with YFP-tagged Rab1 and expressing DsRed in tracheal cells. (H) Control TC not expressing GFP-IR-1 showing strong punctate YFP signal from YRab1. (I) TC expressing GFP-IR-1, showing no detectable YFP signal from YRab1. nuc, nucleus. (J-K) Maternal effect in YRab-YFPi shown by the Excess TC (J) and Unfused DB (K) phenotypes in YRab7- and YRab19-YFPi. Larvae descendent from YRab-heterozygous mothers were compared to larvae descendent from YRab-homozygous mothers. Larvae of the YRab19/YRab19 sample are the same as in (D) since the experiments were carried out in parallel.
Figure 3
Figure 3
Dorsal branch phenotypes found in the YRab-YFPi screen. YRab-homozygous virgins with either GFP-IR-1, or btl-gal4 and UAS-DsRed were crossed to YRab males with the respective complementary construct(s) to obtain YRab-homozygous larvae expressing the GFP-knockdown transgene and DsRed in tracheal cells. Examples of the “Excess TC” and “Unfused DB” phenotypes can be found in Fig. 2. TC, terminal cell. DB, dorsal branch. Anterior is up in all micrographs. (A) Example of the “Misguided TC” phenotype in a YRab19-YFPi larva. One excess TC (S2-3) on segment 2 (S2) of this larva grew posterior and ramified on a dorsal muscle in segment 3. White dashed lines: outlines of the three TCs of segment 2. (B) Example of the “Misfused DB” phenotype in a YRab19-YFPi larva. The DBs of segment 5 did not fuse in this larva (plus sign). Instead, the left DB of segment 5 (S5-L) formed an anastomosis with a cell of the left DB of segment 4 (S4-L, asterisk). White dotted lines: outlines of the dorsal branches (C) Example of the “Missing TC” phenotype in a YRab9-YFPi larva. The left TC of this larva’s segment 3 is missing (asterisk), though the DBs are fused as normal. (D) Diagram showing the dorsal tracheal anatomy of L3 wandering larvae and the phenotypes observed in the screen. Anterior is to the top. Stereotypically, all DB pairs form a constellation as shown in the first two metameres here. (E) Mean frequencies per larva of each phenotype in YRab-YFPi larvae depleted for the respective Rab. Black squares indicate significant effects (95% confidence interval of difference to control >0).
Figure 4
Figure 4
Description of terminal cell phenotypes found in the YRab-YFPi screen. For each case, the first micrograph shows autofluorescence of the apical extracellular matrix (aECM), emitted when illuminated with a 405nm laser. This reveals the morphology of the subcellular tube’s lumen. The second micrograph shows an overlay of autofluorescence (cyan) and cytoplasmic DsRed (red). In some cases, the transmitted light is also shown, which reveals the contrast between the tissue and the gas-filled lumen of the tubes. Scale bars in (A-A’), 50µm; in (B-H’’), 10 µm. (A-A’) Control dorsal TC in a larva with btl-gal4, GFP-IR-1 and UAS-DsRed. (B-B’) Example of the “Hairy branch” phenotype in a YRab8-YFPi larva. The autofluorescence reveals numerous small tubules and strongly fluorescent puncta surrounding the main subcellular tube. Some of the tubules are connected to the main tube and transmitted light shows that some are gas-filled (not shown). (C-C’) Example of the “Postjunctional curl” phenotype in a YRab8-YFPi larva. The tube is folded up on itself immediately after branching off the parent branch. (D-D’) Example of the “Curled tip” phenotype in a YRab8-YFPi larva. Rather than forming a blunt end, the tube curls back at the branch tip. (E-E’’) Example of the “Lumen gap” phenotype in a YRab6-YFPi larva. A stretch of the branch shows no autofluorescence, indicating that no fully mature aECM is present. An aECM-containing tube can be seen distal to the gap. Light transmission (E’’) shows that the tube is not gas-filled at or distal to the gap (arrowhead). (F-F’) Example of the “Retracted junction” phenotype in a negative control larva. The points at which the cytoplasm and the tube branch are usually in close proximity. In this phenotype, the point where the tube branches is shifted far away from the point where the cytoplasm branches. (G-G’’) Example of the “Autofluorescent plug” phenotype in a YRab6-YFPi larva. A strongly fluorescent “plug” fills the entire diameter of the subcellular tube, with no lumen visible. Gas-filling is also absent in the region of the plug (G’’). However, some tubes distal to the plug are gas-filled (see tube at the top in G’’). (H-H’’) Example of the “Autofluorescent fiber” phenotype in a YRab6-YFPi larva. A strongly fluorescent “fiber” runs along a stretch of the tube (inset in H). (H’’) Gas can be seen inside the tube despite the abnormal autofluorescence, although irregularities in the contrast suggest that the autofluorescent fiber protrudes into the lumen (inset in H’’).
Figure 5
Figure 5
Number of branches and frequency of phenotypes in YRab-YFPi terminal cells. For the initial categorization of phenotypes, we observed at least 50 dorsal terminal cells (TCs) depleted for each Rab. Once the range of phenotypes had been established, a subset of cells were quantitatively analyzed (N for each Rab see panel A). (A) We counted the number of branches per TC depleted for each Rab via YRab-YFPi. This reflects overall cell health (Best 2019). Left: Dotplots with one dot for each TC and bars showing mean ± SD. Right: Estimation of effect size relative to negative control. Black dot indicates the mean difference to control, black bars indicate the 95% confidence interval, distribution of bootstrapped mean differences in gray. Detailed statistics can be found in Table 1. (B) Mean frequency of phenotypes described in Fig. 4 per branch in the same TCs scored for (A). Asterisks indicate “significant” phenotypes, i.e., those where the autofluorescent aECM reveals differences from control TCs.

References

    1. Ahuja S., Rougé L., Swem D. L., Sudhamsu J., Wu P. et al. , 2015. Structural Analysis of Bacterial ABC Transporter Inhibition by an Antibody Fragment. Structure 23: 713–723. 10.1016/j.str.2015.01.020 - DOI - PubMed
    1. Araujo S. J., and Casanova J., 2011. Sequoia establishes tip-cell number in Drosophila trachea by regulating FGF levels. J. Cell Sci. 124: 2335–2340. 10.1242/jcs.085613 - DOI - PubMed
    1. Best B. T., 2019. Single-cell branching morphogenesis in the Drosophila trachea. Dev. Biol. 451: 5–15. 10.1016/j.ydbio.2018.12.001 - DOI - PubMed
    1. Blanpain C., Vanderwinden J.-M., Cihak J., Wittamer V., Le Poul E. et al. , 2002. Multiple Active States and Oligomerization of CCR5 Revealed by Functional Properties of Monoclonal Antibodies. Mol. Biol. Cell 13: 723–737. 10.1091/mbc.01-03-0129 - DOI - PMC - PubMed
    1. Brown J. B., Boley N., Eisman R., May G. E., Stoiber M. H. et al. , 2014. Diversity and dynamics of the Drosophila transcriptome. Nature 512: 393–399. 10.1038/nature12962 - DOI - PMC - PubMed

Publication types

LinkOut - more resources