. 2020 Jan 24;5(43):eaba4219.
doi: 10.1126/sciimmunol.aba4219.

Human DNA-PK activates a STING-independent DNA sensing pathway

Affiliations

Human DNA-PK activates a STING-independent DNA sensing pathway

Katelyn Burleigh et al. Sci Immunol. .

Abstract

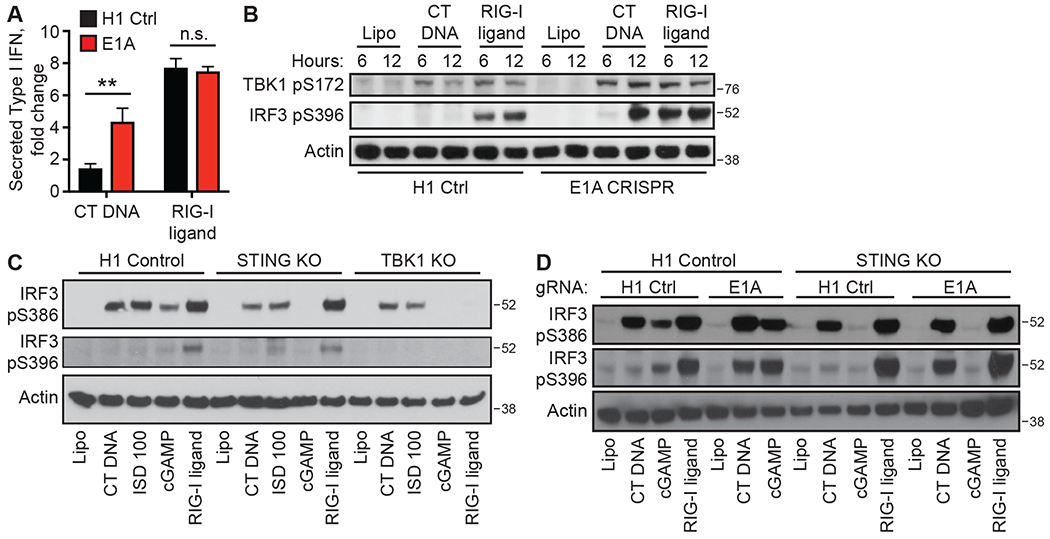
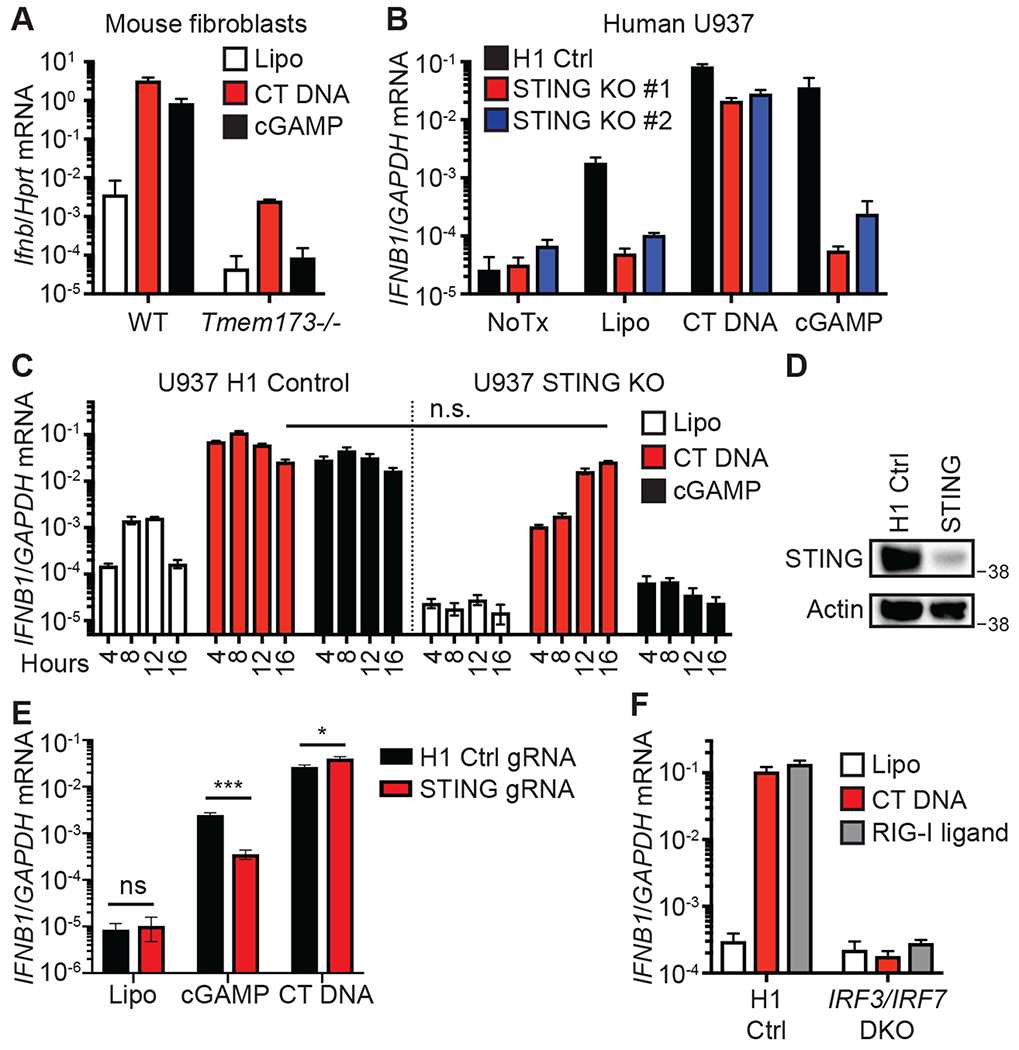
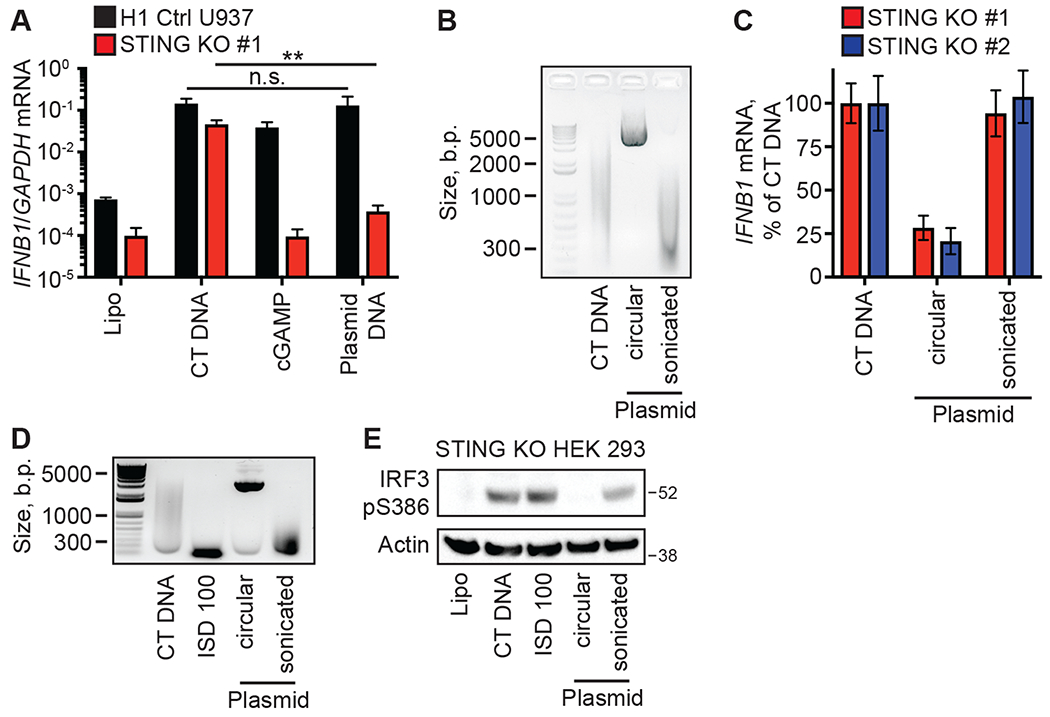
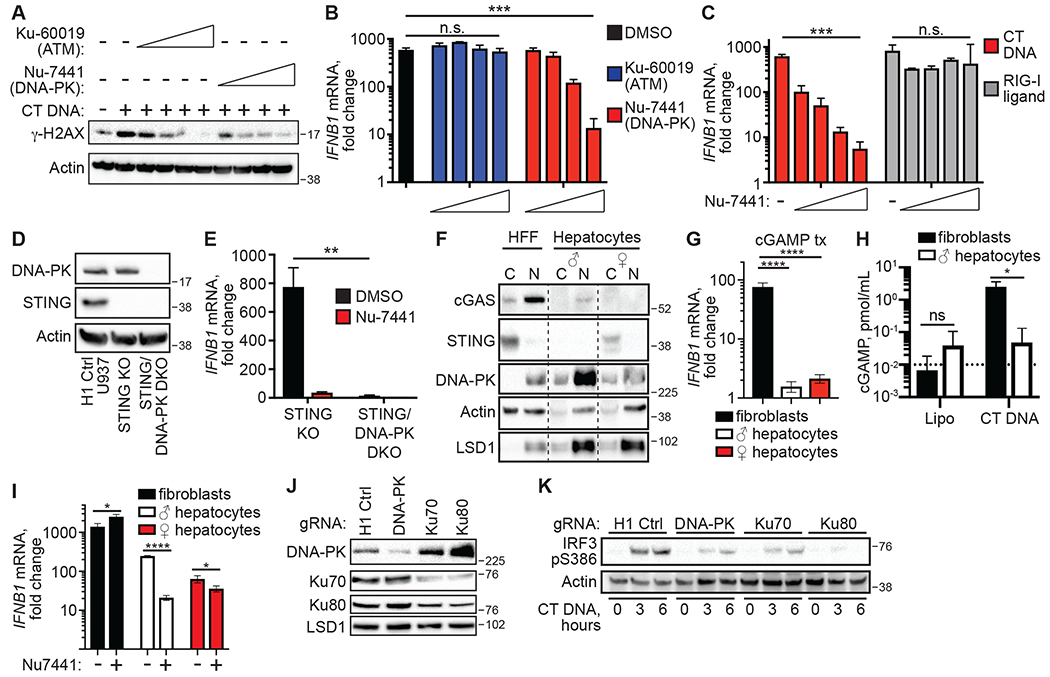
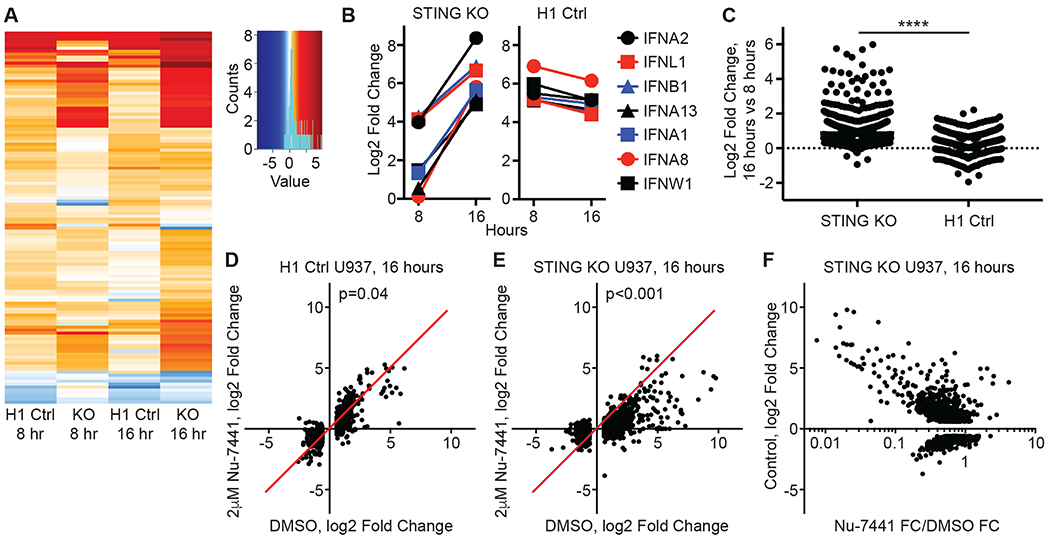
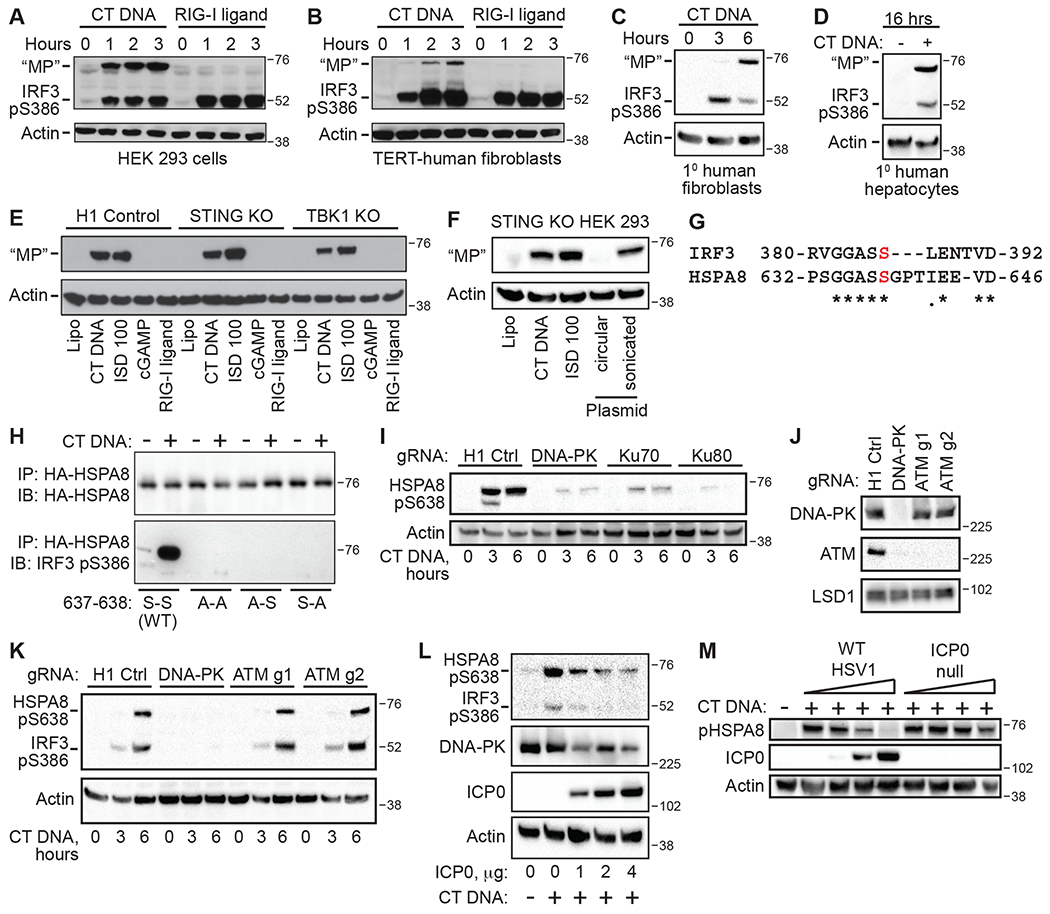
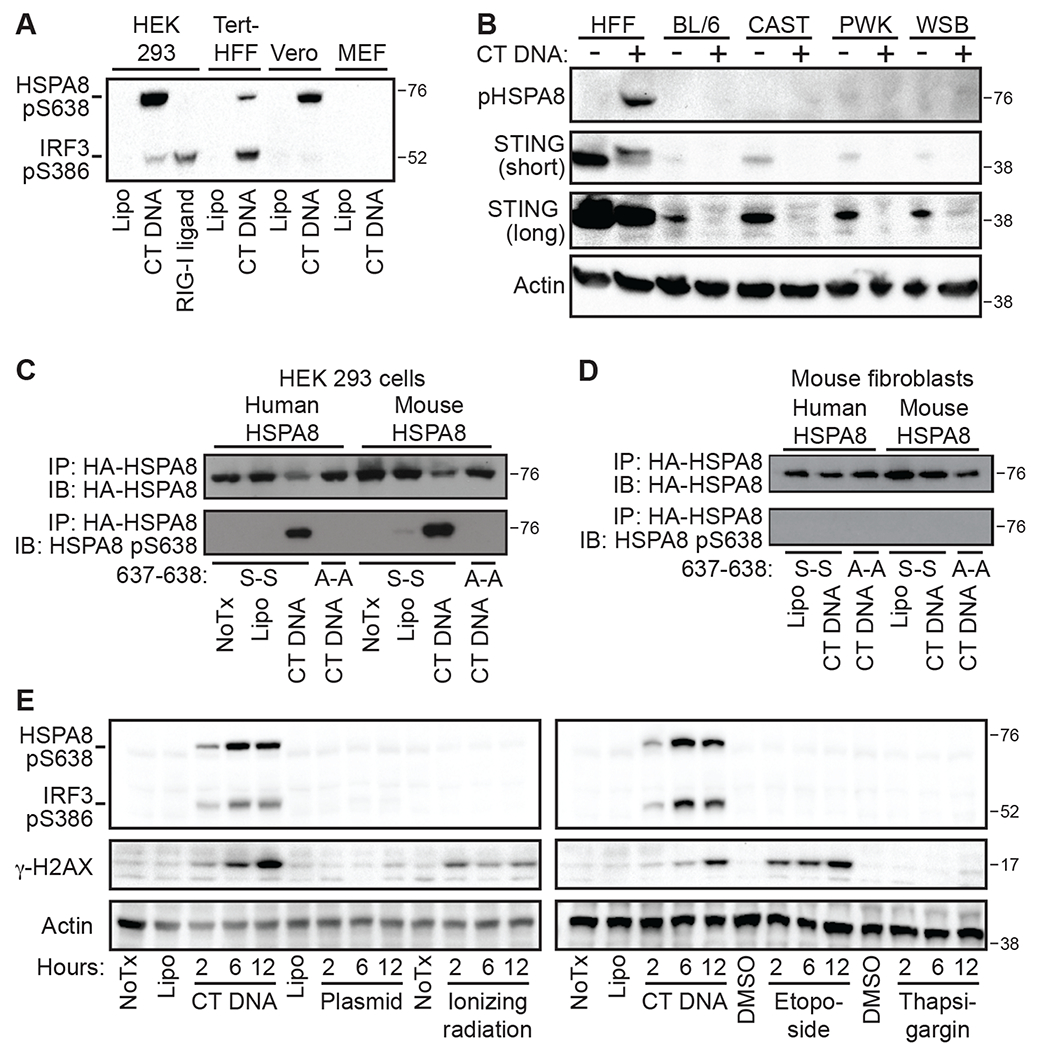
Detection of intracellular DNA by the cGAS-STING pathway activates a type I interferon-mediated innate immune response that protects from virus infection. Whether there are additional DNA sensing pathways, and how such pathways might function, remains controversial. We show here that humans-but not laboratory mice-have a second, potent, STING-independent DNA sensing pathway (SIDSP). We identify human DNA-dependent protein kinase (DNA-PK) as the sensor of this pathway and demonstrate that DNA-PK activity drives a robust and broad antiviral response. We show that the E1A oncoprotein of human adenovirus 5 and the ICP0 protein of herpes simplex virus 1 block this response. We found heat shock protein HSPA8/HSC70 as a target for inducible phosphorylation in the DNA-PK antiviral pathway. Last, we demonstrate that DNA damage and detection of foreign DNA trigger distinct modalities of DNA-PK activity. These findings reveal the existence, sensor, a specific downstream target, and viral antagonists of a SIDSP in human cells.


Conflict of interest statement

Conflict of Interests

A patent application describing the modulation of DNA-PK for treating human diseases is currently pending.

Figures

Figure 1:
Figure 1:. Human Adenovirus 5 E1A blocks two DNA sensing pathways
(A) HEK 293 cells were transduced with lentiCRISPR encoding H1 control or E1A-specific gRNAs, selected for three days, and then stimulated with CT DNA or RIG-I ligand for 24 hours, followed by measuring type I IFN activity in culture supernatants. *:p<0.05. n=3 independent treatments per condition. Error bars represent Standard Deviation (SD). (B) HEK 293 cells, treated with the indicated ligands, were lysed at the indicated times post transfection, followed by western blot analysis for phosphorylated TBK1 and IRF3. (C) Clonal lines of H1 control-targeted, STING KO, and TBK1 KO HEK 293 cells were treated with the indicated ligands for 3 hours, followed by western blot for the indicated phosphorylation sites on IRF3. (D) Clonal lines of H1 control-targeted and STING KO HEK 293 cells were transduced with lentiCRISPR as described in (A), then stimulated with the indicated ligands for 8 hours followed by western blot analysis. Data are representative of three independent experiments per panel.
Figure 2:
Figure 2:. A STING-independent DNA sensing pathway (SIDSP) in human cells
(A) Primary mouse embryonic fibroblasts were treated with Lipofectamine alone (Lipo) or the indicated ligands for four hours before harvest and quantitative RT-PCR (RT-qPCR) analysis of Ifnb mRNA expression. n=3 independent treatments per condition. (B) PMA-differentiated human U937 monocytes or two clonal lines of STING KO U937 cells were treated with the indicated ligands for 16 hours before harvest and RT-qPCR analysis of IFNB1 mRNA expression. n=3 independent treatments per condition. (C) PMA-differentiated WT U937 cells and STING KO U937 cells were treated with the indicated ligands for the indicated times before harvest and RT-qPCR analysis of IFNB1 mRNA expression. n.s.: not significant. n=3 independent treatments per condition. (D) Tert-HFF cells were transduced with lentiCRISPR encoding either H1 control non-targeting gRNA or STING targeting gRNA, followed by selection for three days in puromycin. STING expression was assessed by western blot. (E) Tert-HFFs from (E) were treated with the indicated ligands for 16 hours prior to harvest and RT-qPCR for IFNB1. Multiple t-tests with significance determined by Holm-Sidak method were used to compare cell lines for each stimulation, n=3 independent treatments per condition. (F) Clonal lines of PMA-differentiated H1 control-targeted THP1 cells and IRF3/IRF7 DKO THP1 cells were treated with the indicated ligands for 16 hours before harvest and RT-qPCR analysis of IFNB1 mRNA expression. n=3 independent treatments per condition. Error bars represent SD. Data are representative of 3 independent experiments per panel.
Figure 3:
Figure 3:. The SIDSP is activated by DNA ends
(A) PMA-differentiated clonal lines of H1 control-targeted and STING KO U937 cells were treated with the indicated ligands for 16 hours before harvest and RT-qPCR analysis of IFNB1 mRNA expression. n.s.: not significant; **:p<0.01. (B) CT DNA, supercoiled plasmid DNA, and sonicated plasmid DNA were run on a DNA agarose gel and visualized with SYBR-Safe. (C) Two clonal lines of PMA-differentiated STING KO U937 cells were treated with the indicated ligands for 16 hours, with IFNB1 mRNA expression in CT DNA-treated cells set at 100%. n=3 independent treatments per condition. (D) CT DNA, 100 base pair annealed DNA oligos (ISD100), supercoiled and sonicated plasmid DNAs were visualized on DNA-agarose gel. (E) STING KO HEK 293 cells were treated with the indicated ligands for three hours before harvesting lysates and evaluating IRF3 S386 phosphorylation by western blot. Error bars represent SD. Data are representative of 3 independent experiments per panel.
Figure 4:
Figure 4:. Human DNA-PK is essential for the SIDSP.
(A) PMA-differentiated STING KO U937 cells were treated with CT DNA for 16 hours in the presence of DMSO control, increasing concentrations of Ku-60019 ATM inhibitor [0.125, 0.25, 0.5, 1 μM], or Nu-7441 DNA-PK inhibitor [0.25, 0.5, 1, 2 μM], followed by western blot analysis of γ-H2AX phosphorylation. (B) PMA-differentiated STING KO U937 cells were treated with CT DNA for 16 hours in the presence of inhibitors as described in (A), followed by RT-qPCR analysis of IFNB1 mRNA expression. n.s.: not significant; ***:p<0.001. n=3 independent treatments per condition. (C) PMA-differentiated STING KO U937 cells were treated with CT DNA or RIG-I ligand in the presence of DMSO or Nu-7441 for 16 hours, followed by RT-qPCR analysis of IFNB1 mRNA expression. n.s.: not significant; ***:p<0.001. n=3 independent treatments per condition. (D) Western blot analysis of DNA-PK and STING in clonal lines of H1 control, STING KO and STING/DNA-PK DKO U937 cells. (E) PMA-differentiated STING KO and STING/DNA-PK DKO U937 cells were treated with CT DNA for 16 hours in DMSO or 2 μM Nu-7441, followed by RT-qPCR analysis of IFNB1 mRNA expression, normalized to Lipo control-treated cells. **:p<0.01. n=3 independent treatments per condition. (F) Primary human foreskin fibroblasts (HFF) and primary human hepatocytes from male (♂) and female (♀) donors were assessed for cGAS, STING, and DNA-PK proteins by fractionation into cytosol (C) and nuclear (N) extracts, followed by western blot. The nuclear extract was treated with salt-active nuclease to remove genomic DNA. (G) The indicated cell lines were stimulated with cGAMP for 16 hours before harvest and RT-qPCR analysis of IFNB1 mRNA expression. One-way ANOVA with Holm Sidak’s multiple comparisons test was used to compare IFNB1 in the HFFs versus the hepatocytes. ****:p<0.0001. n=3 independent treatments per condition. (H) The indicated cell lines were stimulated for 4 hours before measurement of cGAMP by ELISA. n.s.: not significant; *:p<0.05. n=3 independent treatments per condition. (I) The indicated cell lines were treated with CT DNA for 16 hours in the presence of DMSO or 2 μM Nu-7441 before harvest and RT-qPCR analysis of IFNB1 mRNA expression. Multiple t-tests with significance determined by the Holm-Sidak method were used to compare IFNB1 in DMSO versus Nu7441 treated cells. *:p<0.05, ****:p<.0001. n=3 independent treatments per condition. (J) STING KO HEK 293 cells were transduced with lentiCRISPR encoding gRNAs specific for the indicated targets, selected for three days in puromycin, and then harvested for western blot analysis of the indicated proteins. (K) STING KO HEK 293 cells from (J) were stimulated with CT DNA for the indicated time points and then harvested for western blot analysis of IRF3 S386 phosphorylation. Error bars represent SD. Data are representative of 3 independent experiments per panel.
Figure 5:
Figure 5:. The DNA-PK SIDSP activates a broad gene expression program
(A) Heat map representation of log2 Fold Change in gene expression for the 124 antiviral response genes with significant differential expression in one of the four comparisons. The key includes a histogram in cyan plotting the distribution of log2 Fold Change values for all the included genes. Data represent the average of three independent treatments per condition. (B) Expression data for all interferon genes significantly induced in clonal lines of H1 control targeted or STING KO U937 cells, plotting the log2 Fold Change at 8 and 16 hours post treatment. Data represent the average of three independent treatments per condition. (C) To measure the trajectories of global gene expression from 8 to 16 hours post CT DNA transfection, the fold change in gene expression at 16 hours was divided by the fold change for the same genes at 8 hours and plotted for all upregulated genes in STING KO (n=926) and H1 control lines (n=563). ****:p<0.0001, Mann-Whitney unpaired t-test. Data represent the average of three independent treatments per condition. (D) In H1 control U937 cells, the 16 hour CT DNA-activated log2 Fold Change was plotted for DMSO control-treated cells on the x-axis and for Nu-7441-treated cells on the y-axis. Each dot represents a single gene that was differentially expressed at 16 hours in DMSO-treated cells (n=1024). The red line through the origin indicates the line of equivalence representing no effect of the drug treatment. A Wilcoxon matched pairs signed rank test was used to determine the p-value between DMSO control and Nu-7441-treated samples after DNA stimulation. Data represent the average of three independent treatments per condition. (E) In STING KO U937 cells, the effect of Nu-7441 on global gene expression for 1327 genes differentially expressed in DMSO control-treated cells, plotted as in (D). A Wilcoxon matched pairs signed rank test was used to determine the p value between DMSO control and Nu-7441-treated samples after DNA stimulation. Data represent the average of three independent treatments per condition. (F) In STING KO U937 cells, the log2 Fold Change in DMSO control-treated cells was plotted on the y-axis for differentially expressed genes, and the effect of Nu-7441 on these same genes was plotted in log10 format on the x-axis, n=1327. Data represent the average of three independent treatments per condition, each processed and sequenced independently.
Figure 6:
Figure 6:. HSPA8 is a downstream target of the DNA-PK-SIDSP
(A-D): The indicated human cells were treated with CT DNA or RIG-I ligand for the indicated times before harvest and western blot analysis of IRF3 S386 phosphorylation. Mystery Protein is indicated as MP on the blots. (E) Clonal lines of H1 non-targeting control, STING KO, and TBK1 KO HEK 293 cells were treated with the indicated ligands for 3 hours before harvest and western blot analysis of MP. (F) STING KO HEK 293 cells were treated with the DNA ligands described in Fig. 3D for 3 hours, followed by western blot analysis of MP. (G) Alignments of human IRF3 and HSPA8/HSC70. The red S indicates IRF3 S386 and HSPA8 S638. (H) HEK 293 cells were transfected with plasmids encoding the indicated human HA-HSPA8 constructs, then treated the next day with CT DNA for 3 hours before harvest, HA-immunoprecipitation, and western blot using the IRF3 pS386 antibody. (I) HEK 293 cells targeted for the indicated genes were treated with DNA and harvested for western blot analysis using the IRF3 pS386 antibody that detects HSPA8 pS638. (J) STING KO HEK 293 cells were transduced with lentiCRISPR targeting H1 control, DNA-PK, or ATM, selected for three days, and then harvested for western blot of the indicated proteins. (K) STING KO HEK 293 cells, transduced and selected as described in (J), were treated with CT DNA and then harvested for western blot analysis of IRF3 S386 and HSPA8 S638 phosphorylation. (L) STING KO HEK 293 cells were transfected with plasmid encoding the ICP0 protein of herpes simplex virus 1. 24 hours later, the cells were stimulated with CT DNA for 3 hours before harvest and western blot analysis of the indicated proteins. (M) STING KO HEK 293 cells were infected with increasing doses of either WT or ICP0-null mutant HSV1 (doses are MOI of 0, 0.1, 1, and 10) for 4 hours before 3 hour treatment with CT DNA and harvest for western blot. Data are representative of 3 independent experiments per panel.
Figure 7:
Figure 7:. HSPA8 phosphorylation delineates the antiviral modality of human DNA-PK
(A) The indicated human, primate, and mouse cell lines were stimulated with CT-DNA for 3 hours before harvest and western blot for the indicated proteins. (B) Primary human fibroblasts (HFF) and primary mouse embryonic fibroblasts from C57BL/6, CAST/Ei, PWK, and WSB mice were transfected with CT DNA for 6 hours before harvest and evaluation of the indicated proteins by western blot. (C) HEK 293 cells were transfected with either human HA-HSPA8 constructs or mouse HA-HSPA8 constructs, followed by CT DNA stimulation for 3 hours, HA immunoprecipitation, and western blot analysis of the indicated proteins. (D) Immortalized mouse Jackson fibroblasts were transfected and treated as indicated in (B). (E) HEK 293 cells were stimulated with CT DNA or supercoiled plasmid DNA, or treated with 30 Gray ionizing γ-irradiation, 50 μM Etoposide, or 500 nM Thapsigargin before harvest at the indicated time points and western blot analysis of IRF3 pS386, HSPA8 pS638, and γ -H2AX. Data are representative of 2-3 independent experiments per panel.

Comment in

References

    1. Goubau D, Deddouche S, Reis ESC, Cytosolic sensing of viruses. Immunity 38, 855–869 (2013). - PMC - PubMed
    1. Crowl JT, Gray EE, Pestal K, Volkman HE, Stetson DB, Intracellular Nucleic Acid Detection in Autoimmunity. Annu Rev Immunol 35, 313–336 (2017). - PMC - PubMed
    1. Li T, Chen ZJ, The cGAS-cGAMP-STING pathway connects DNA damage to inflammation, senescence, and cancer. J Exp Med 215, 1287–1299 (2018). - PMC - PubMed
    1. Sun L, Wu J, Du F, Chen X, Chen ZJ, Cyclic GMP-AMP synthase is a cytosolic DNA sensor that activates the type I interferon pathway. Science 339, 786–791 (2013). - PMC - PubMed
    1. Wu J, Sun L, Chen X, Du F, Shi H, Chen C, Chen ZJ, Cyclic GMP-AMP is an endogenous second messenger in innate immune signaling by cytosolic DNA. Science 339, 826–830 (2013). - PMC - PubMed

Publication types