. 2020 Feb 11;117(6):2751-2760.
doi: 10.1073/pnas.1920004117. Epub 2020 Jan 24.

Regulation of adipose tissue inflammation by interleukin 6

Affiliations

Regulation of adipose tissue inflammation by interleukin 6

Myoung Sook Han et al. Proc Natl Acad Sci U S A. .

Abstract

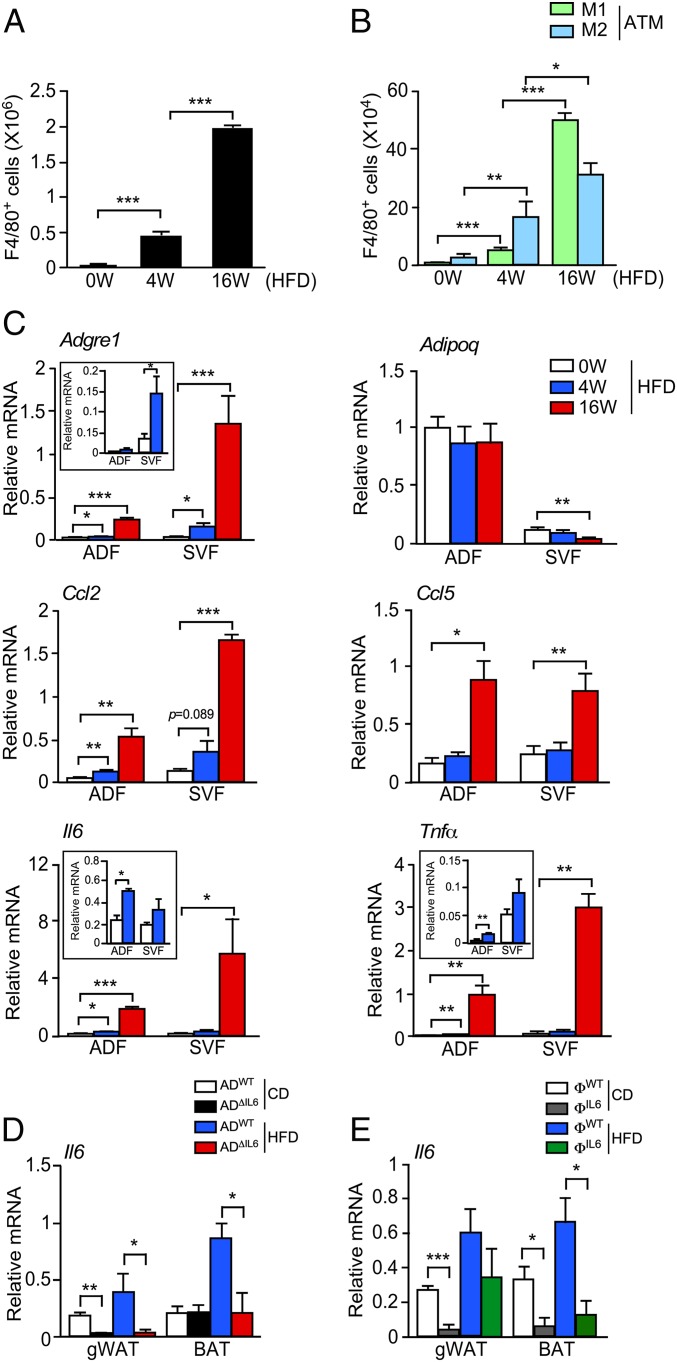
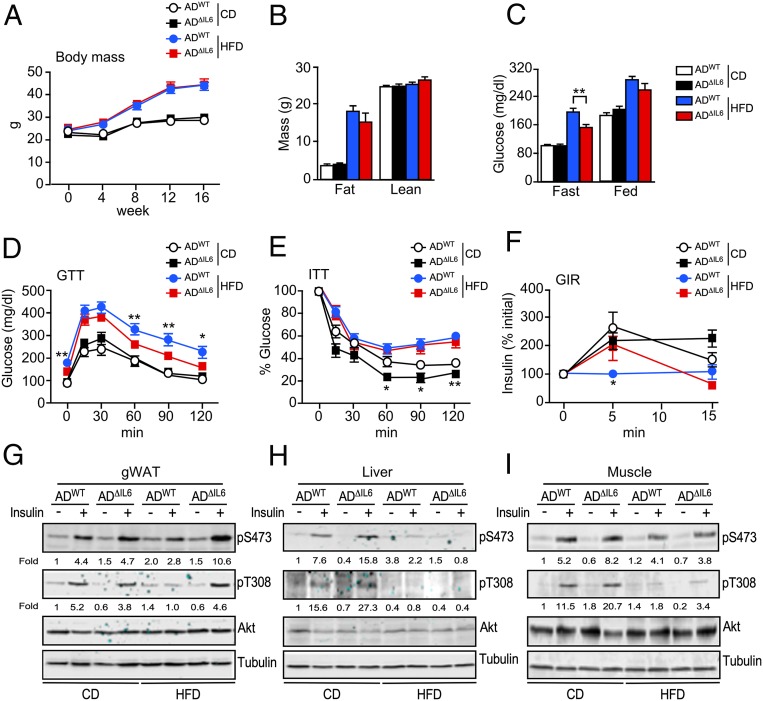
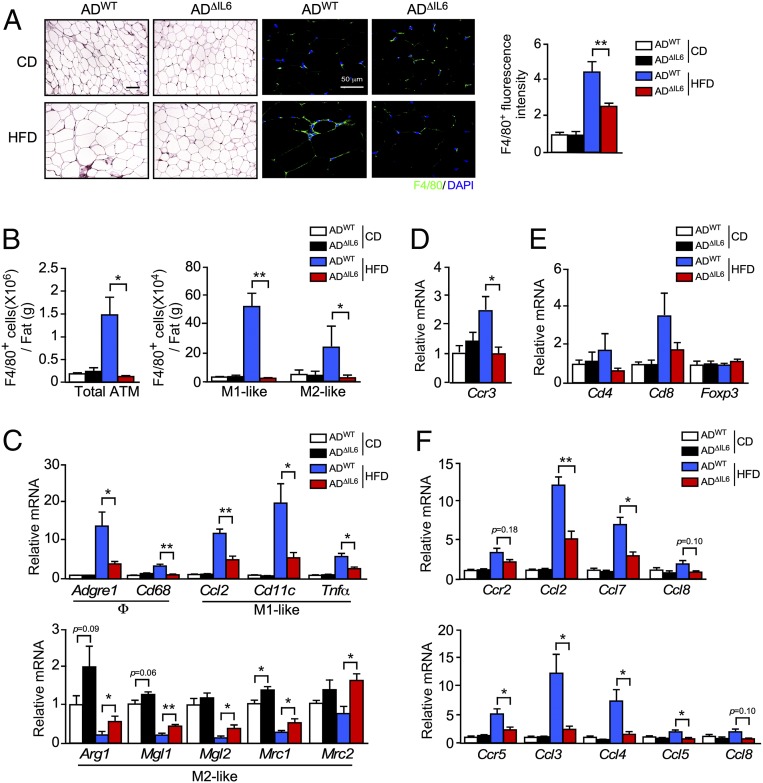
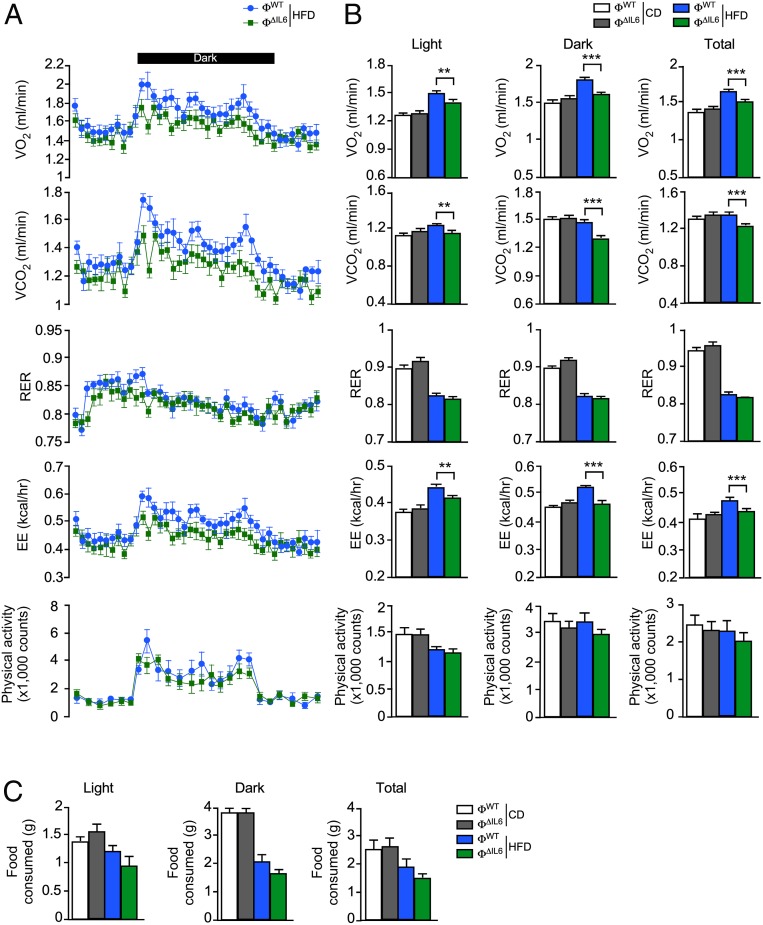
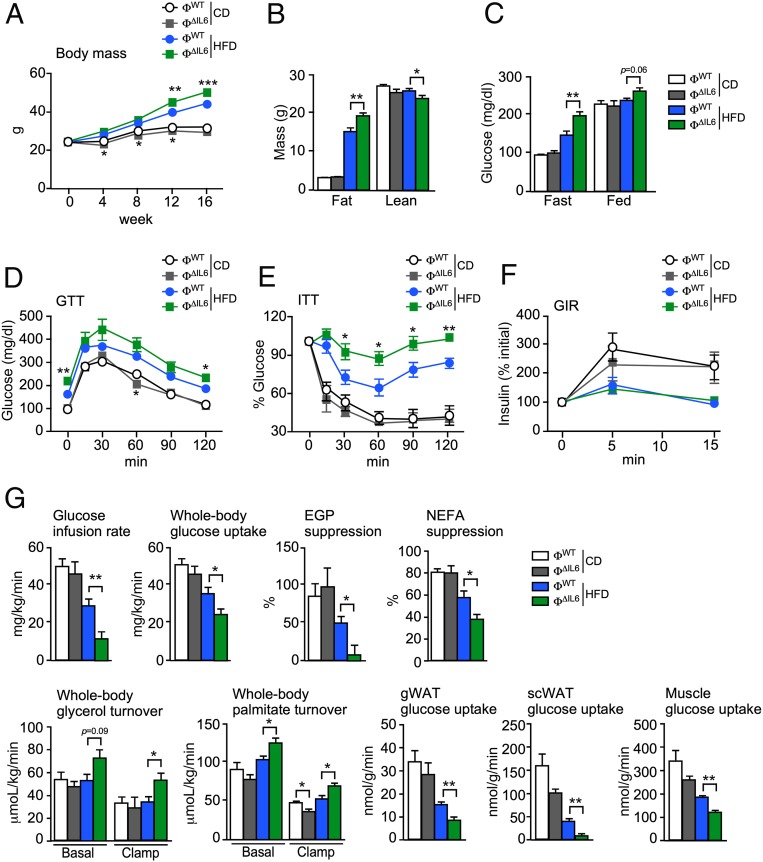
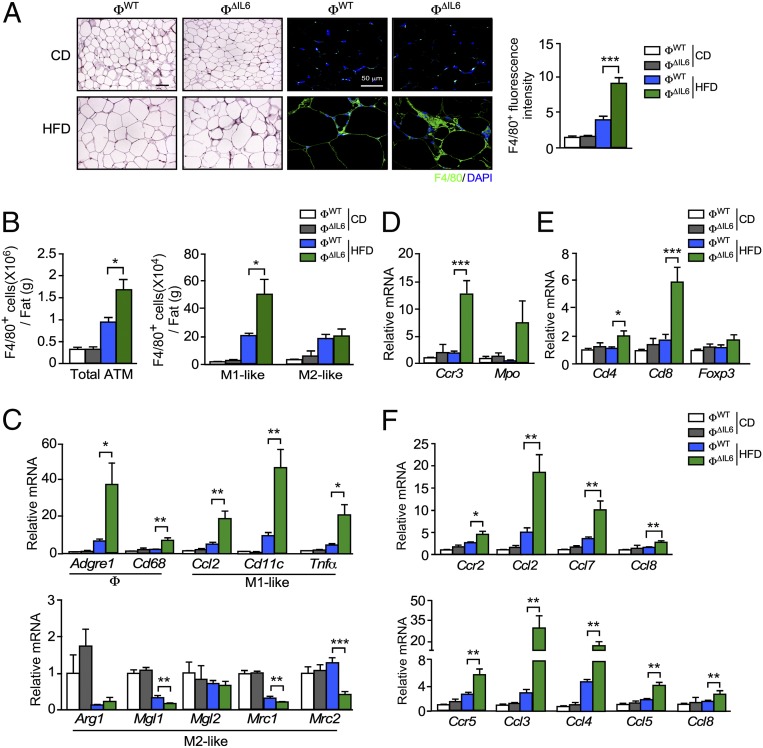
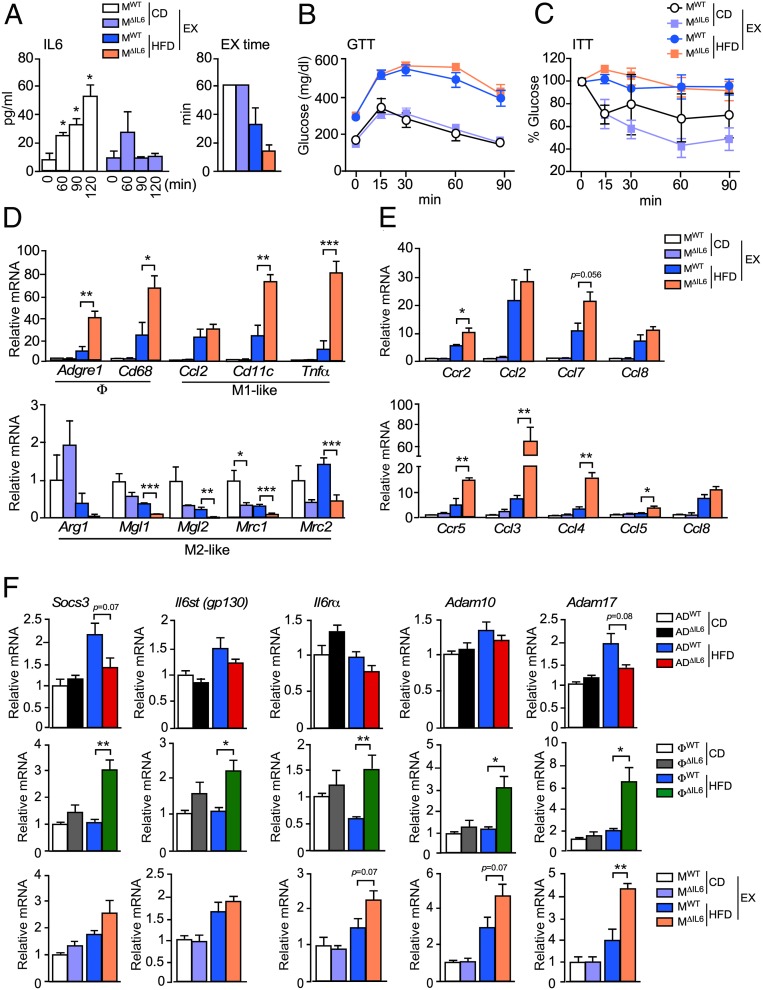
Obesity is associated with a chronic state of low-grade inflammation and progressive tissue infiltration by immune cells and increased expression of inflammatory cytokines. It is established that interleukin 6 (IL6) regulates multiple aspects of metabolism, including glucose disposal, lipolysis, oxidative metabolism, and energy expenditure. IL6 is secreted by many tissues, but the role of individual cell types is unclear. We tested the role of specific cells using a mouse model with conditional expression of the Il6 gene. We found that IL6 derived from adipocytes increased, while IL6 derived from myeloid cells and muscle suppressed, macrophage infiltration of adipose tissue. These opposite actions were associated with a switch of IL6 signaling from a canonical mode (myeloid cells) to a noncanonical trans-signaling mode (adipocytes and muscle) with increased expression of the ADAM10/17 metalloprotease that promotes trans-signaling by the soluble IL6 receptor α. Collectively, these data demonstrate that the source of IL6 production plays a major role in the physiological regulation of metabolism.

Keywords: adipose tissue; inflammation; insulin resistance; interleukin 6.


Conflict of interest statement

The authors declare no competing interest.

Figures

Fig. 1.
Fig. 1.
The HFD induced infiltration of macrophages and secretion of cytokines. (A and B) The SVF of gWAT was isolated from HFD-fed (0, 4, and 16 wk) mice and examined by flow cytometry to detect the total number of F4/80+ ATMs, the number of F4/80+ CD11c+ CD206 (M1-like) ATMs, and the number of F4/80+ CD11c CD206+ (M2-like) ATMs per mouse (mean ± SEM; n = 2). *P < 0.05; **P < 0.01; ***P < 0.001. (C) Total RNA was isolated from ADF and SVF from HFD-fed (0, 4, and 16 wk) mice. The relative expression of mRNA associated with makers of macrophages (Adgre1), M1-polarized macrophages (Ccl2, Ccl5, Il6, and Tnfα), and adipocytes (Adipoq) was measured by qRT-PCR assays (mean ± SEM; n = 4 ∼ 6). *P < 0.05; **P < 0.01; ***P < 0.001. (D) Total RNA was isolated from gWAT and BAT from CD- and HFD-fed ADWT and ADΔIL6 mice. The relative expression of Il6 mRNA was measured by qRT-PCR assays (mean ± SEM; n = 5 ∼ 8). *P < 0.05; **P < 0.01. (E) Total RNA was isolated from gWAT and BAT in CD- and HFD-fed ФWT and ФΔIL6 mice. The relative expression of Il6 mRNA was measured by qRT-PCR assays (mean ± SEM; n = 4 ∼ 8). *P < 0.05; ***P < 0.001.
Fig. 2.
Fig. 2.
Adipocyte IL6 promotes obesity-induced insulin resistance. (A) The change in body mass of CD- and HFD-fed ADWT and ADΔIL6 mice is presented (mean ± SEM; n = 7 ∼ 14). (B) Body composition was examined by proton magnetic resonance spectroscopy (mean ± SEM; n = 7 ∼ 8). (C) The blood concentration of glucose in overnight fasted mice and the blood glucose concentration in fed mice were measured (mean ± SEM; n = 7 ∼ 14). **P < 0.01. (D) The CD- and HFD-fed (16 wk.) mice were examined by GTTs (mean ± SEM; n = 7 ∼ 14). *P < 0.05; **P < 0.01. (E) The CD- and HFD-fed (16 wk) mice were examined by ITTs (mean ± SEM; n = 5 ∼ 13). *P < 0.05; **P < 0.01. (F) GIR measurements were performed by i.p. injection of glucose (mean ± SEM; n = 6 ∼ 7). *P < 0.05. (GI) The CD- and HFD-fed mice (16 wk) were fasted overnight, treated by i.p. injection with 1 U/kg insulin (15 min), and examined by immunoblot analysis of gWAT, liver, and gastrocnemius muscle by probing with antibodies to phospho-Akt (pThr308 and pSer473), Akt, and αTubulin. Relative quantitation of the phospho-Akt immunoblots is presented below each subpanel.
Fig. 3.
Fig. 3.
Adipocyte IL6 promotes M1 polarization and an infiltration of ATMs. (A) ADWT and ADΔIL6 mice were fed a CD or a HFD for 16 wk. (A, Left) Sections of gWAT were stained with hematoxylin and eosin. (Scale bar, 100 µm.) (A, Center) Macrophages were stained by using an antibody to F4/80 (green), and nuclei were stained by using DAPI (blue) detection by fluorescence microscopy. (Scale bar, 50 µm.) (A, Right) ATMs were quantitated by measurement of F4/80 staining of tissue section using ImageJ software (mean ± SEM; n = 9 ∼ 15). **P < 0.01. (B) The SVF of gWAT was isolated from CD- and HFD-fed (16 wk) mice and examined by flow cytometry to detect the total number of ATMs (F4/80+), the number of M1-like ATMs (F4/80+ CD11c+ CD206), and the number of M2-like ATMs (F4/80+ CD11c CD206+) (mean ± SEM; n = 4). *P < 0.05; **P < 0.01. (C) Total RNA was isolated from gWAT from CD- and HFD-fed ADWT and ADΔIL6 mice. The relative expression of mRNA associated with markers of macrophages (Adgre1 and Cd68), M1-like polarized macrophages (Ccl2, Cd11c, and Tnfα), and M2-like polarized macrophages (Arg1, Mgl1, Mgl2, Mrc1, and Mrc2) was measured by qRT-PCR assays (mean ± SEM; n = 6 ∼ 8). *P < 0.05; **P < 0.01. (D and E) Total RNA was isolated from gWAT from CD- and HFD-fed ADWT and ADΔIL6 mice. The relative expression of the eosinophil marker (Ccr3) and T cell markers (Cd4, Cd8, and Foxp3) were measured by qRT-PCR assays of mRNA (mean ± SEM; n = 6 ∼ 8). *P < 0.05. (F) The relative expression of the receptor Ccr2 and the ligands Ccl2, Ccl7, and Ccl8; and the receptor Ccr5 and the ligands Ccl3, Ccl4, Ccl5, and Ccl8 was measured by qRT-PCR assays of mRNA (mean ± SEM; n = 6 ∼ 8). *P < 0.05; **P < 0.01.
Fig. 4.
Fig. 4.
Myeloid-cell IL6 increases energy expenditure. Metabolic cage analysis of CD- and HFD-fed ФWT and ФΔIL6 mice (6 wk) to measure oxygen consumption (VO2), carbon dioxide production (VCO2), respiratory exchange rate (RER), energy expenditure (EE), and activity (A and B) and food intake per mouse (C) is presented (mean ± SEM; n = 8). **P < 0.01; ***P < 0.001.
Fig. 5.
Fig. 5.
Macrophage IL6 suppresses diet-induced insulin resistance. (A) The change in body mass of CD- and HFD-fed ФWT and ФΔIL6 mice is presented (mean ± SEM; n = 6 ∼ 8). *P < 0.05; **P < 0.01; ***P < 0.001. (B) Body composition was examined by proton magnetic resonance spectroscopy (mean ± SEM; n = 6 ∼ 8). *P < 0.05; **P < 0.01. (C) The blood concentration of glucose in overnight fasted mice and fed mice was measured (mean ± SEM; n = 6 ∼ 8). **P < 0.01. (D) CD- and HFD-fed (16 wk) mice were examined by GTTs (mean ± SEM; n = 5 ∼ 8). *P < 0.05; **P < 0.01). (E) CD- and HFD-fed (16 wk) mice were examined by ITTs (mean ± SEM; n = 5 ∼ 8). *P < 0.05; **P < 0.01. (F) CD- and HFD-fed (16 wk) mice were examined by GIR (mean ± SEM; n = 5 ∼ 7). (G) Hyperinsulinemic–euglycemic clamps of CD- and HFD-fed (8 wk) mice were used to measure the glucose infusion rate, whole-body glucose uptake, EGP, NEFA suppression, whole-body glycerol turnover, whole-body palmitate turnover, and glucose uptake in gWAT, subcutaneous WAT (scWAT), and gastrocnemius muscle (mean ± SEM; n = 3 ∼ 6). *P < 0.05; **P < 0.01.
Fig. 6.
Fig. 6.
Macrophage IL6 suppresses the accumulation and M1-like polarization of ATMs. (A, Left) CD- and HFD-fed (16 wk) ФWT and ФΔIL6 mice were examined by staining sections of gWAT with hematoxylin and eosin. (Scale bar, 100 µm.) (A, Center) Macrophages were stained by using an antibody to F4/80 and detection by fluorescence microscopy. (Scale bar, 50 µm.) (A, Right) ATMs were quantitated by measurement of F4/80 staining of tissue sections using ImageJ software (mean ± SEM; n = 8 ∼ 11). ***P < 0.001. (B) The SVF of gWAT was isolated from ФWT and ФΔIL6 CD- and HFD-fed (16 wk) mice and examined by flow cytometry to detect the total number of ATMs (F4/80+), M1-like ATMs (F4/80+ CD11c+ CD206), and M2-like ATMs (F4/80+ CD11c CD206+) (mean ± SEM; n = 5). *P < 0.05. (C) Total RNA was isolated from gWAT of CD- and HFD-fed ФWT and ФΔIL6 mice (16 wk). The relative expression of mRNA associated with macrophages (Adgre1 and Cd68), M1-like polarized macrophages (Ccl2, Cd11c, and Tnfα), and M2-like polarized macrophages (Arg1, Mgl1, Mgl2, Mrc1, and Mrc2) was measured by qRT-PCR assays (mean ± SEM; n = 5 ∼ 8). *P < 0.05; **P < 0.01; ***P < 0.001. (D and E) The relative expression of the eosinophil marker (Ccr3), neutrophil marker (Mpo), and T cell markers (Cd4, Cd8, and Foxp3) were measured by qRT-PCR assays of mRNA (mean ± SEM; n = 5 ∼ 8). *P < 0.05, ***P < 0.001. (F) The relative expression of the receptor Ccr2 (and ligands Ccl2, Ccl7, and Ccl8) and the receptor Ccr5 (and ligands Ccl3, Ccl4, Ccl5, and Ccl8) were measured by qRT-PCR assays of mRNA (mean ± SEM; n = 5 ∼ 8). *P < 0.05; **P < 0.01.
Fig. 7.
Fig. 7.
Muscle IL6 suppresses the accumulation and M1-like polarization of ATMs. (A) The concentration of circulating IL6 in blood was measured from exercised CD- or HFD-fed (16 wk) MWT and MΔIL6 mice (mean ± SEM; n = 6). *P < 0.05. The exercise (EX) time is presented. (B) The exercised CD- and HFD-fed (16 wk) mice were examined by GTTs (mean ± SEM; n = 6). (C) The exercised CD- and HFD-fed (16 wk.) mice were examined by ITTs (mean ± SEM; n = 6). (D) Total RNA was isolated from gWAT from CD- and HFD-fed MWT and MΔIL6 mice (16 wk). The relative expression of mRNA associated with macrophages (Adgre1 and Cd68), M1-like polarized macrophages (Ccl2, Cd11c, and Tnfα), and M2-like polarized macrophages (Arg1, Mgl1, Mgl2, Mrc1, and Mrc2) were measured by qRT-PCR assays (mean ± SEM; n = 5 ∼ 7). *P < 0.05; **P < 0.01; ***P < 0.001. (E) The relative expression of the receptor Ccr2 (and ligands Ccl2, Ccl7, and Ccl8) and the receptor Ccr5 (and ligands Ccl3, Ccl4, Ccl5, and Ccl8) were measured by qRT-PCR assays of mRNA (mean ± SEM; n = 5 ∼ 7). *P < 0.05; **P < 0.01. (F) The relative expression of IL6 pathway-associated genes (Socs3, Il6st, Il6rα, Adam10, and Adam17) by gWAT was measured by qRT-PCR assays of mRNA (mean ± SEM; n = 5 ∼ 8). *P < 0.05; **P < 0.01.

References

    1. Mauer J., Denson J. L., Brüning J. C., Versatile functions for IL-6 in metabolism and cancer. Trends Immunol. 36, 92–101 (2015). - PubMed
    1. Carey A. L., et al. , Interleukin-6 increases insulin-stimulated glucose disposal in humans and glucose uptake and fatty acid oxidation in vitro via AMP-activated protein kinase. Diabetes 55, 2688–2697 (2006). - PubMed
    1. van Hall G., et al. , Interleukin-6 stimulates lipolysis and fat oxidation in humans. J. Clin. Endocrinol. Metab. 88, 3005–3010 (2003). - PubMed
    1. Schmidt-Arras D., Rose-John S., IL-6 pathway in the liver: From physiopathology to therapy. J. Hepatol. 64, 1403–1415 (2016). - PubMed
    1. Scheller J., Chalaris A., Schmidt-Arras D., Rose-John S., The pro- and anti-inflammatory properties of the cytokine interleukin-6. Biochim. Biophys. Acta 1813, 878–888 (2011). - PubMed

Publication types

LinkOut - more resources