. 2020 Mar 4;40(10):2025-2037.
doi: 10.1523/JNEUROSCI.1673-19.2019. Epub 2020 Jan 24.

Visuoauditory Associative Memory Established with Cholecystokinin Under Anesthesia Is Retrieved in Behavioral Contexts

Affiliations

Visuoauditory Associative Memory Established with Cholecystokinin Under Anesthesia Is Retrieved in Behavioral Contexts

Zicong Zhang et al. J Neurosci. .

Abstract

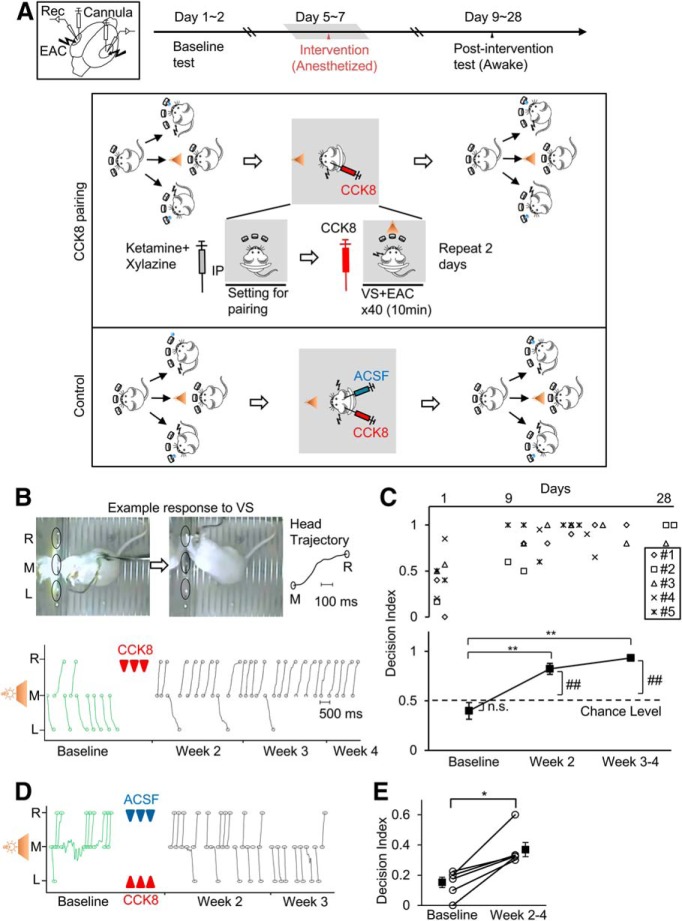
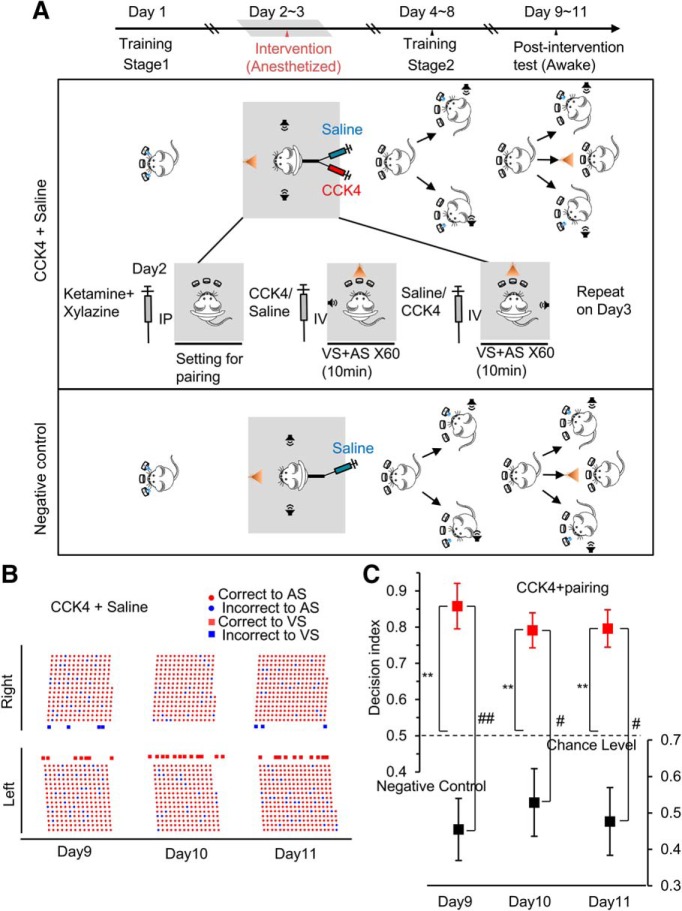
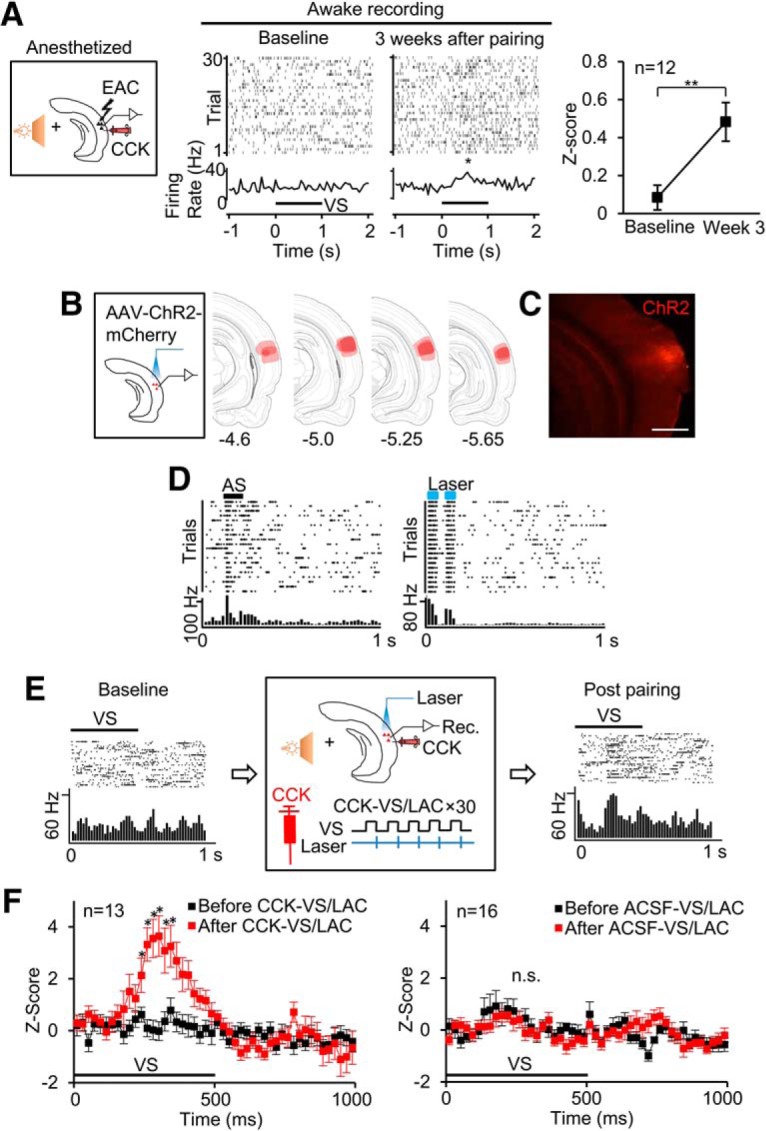
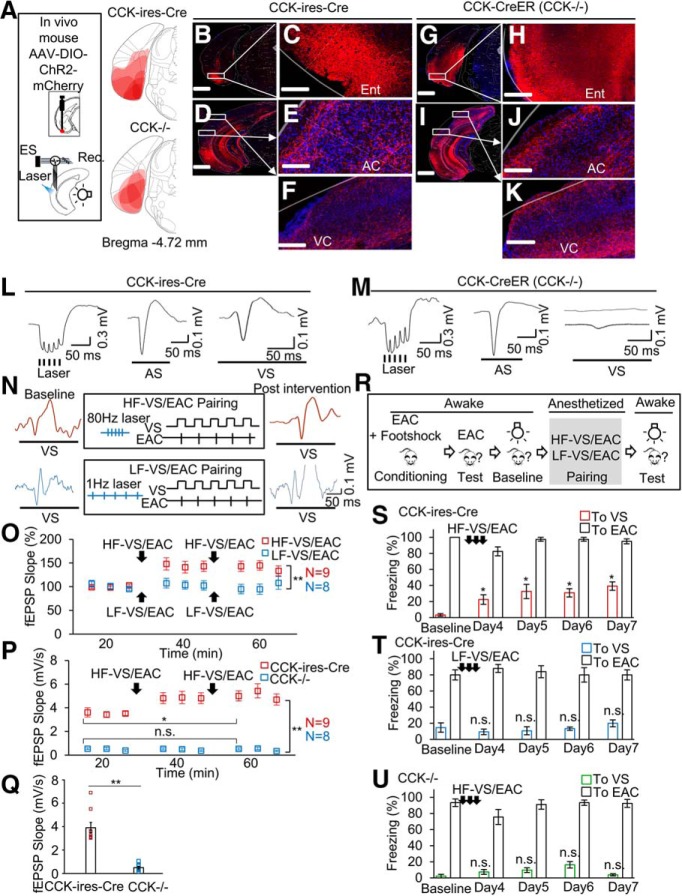
Plastic change in neuronal connectivity is the foundation of memory encoding. It is not clear whether the changes during anesthesia can alter subsequent behavior. Here, we demonstrated that in male rodents under anesthesia, a visual stimulus (VS) was associated with electrical stimulation of the auditory cortex or natural auditory stimulus in the presence of cholecystokinin (CCK), which guided the animals' behavior in a two-choice auditory task. Auditory neurons became responsive to the VS after the pairings. Moreover, high-frequency stimulation of axon terminals of entorhinal CCK neurons in the auditory cortex enabled LTP of the visual response in the auditory cortex. Such pairing during anesthesia also generated VS-induced freezing in an auditory fear conditioning task. Finally, we verified that direct inputs from the entorhinal CCK neurons and the visual cortex enabled the above neural plasticity in the auditory cortex. Our findings suggest that CCK-enabled visuoauditory association during anesthesia can be translated to the subsequent behavior action.SIGNIFICANCE STATEMENT Our study provides strong evidence for the hypothesis that cholecystokinin plays an essential role in the formation of cross-modal associative memory. Moreover, we demonstrated that an entorhinal-neocortical circuit underlies such neural plasticity, which will be helpful to understand the mechanisms of memory formation and retrieval in the brain.

Keywords: auditory cortex; cholecystokinin; entorhinal cortex; memory encoding; neural plasticity; operant conditioning.


Figures

Figure 1.
Figure 1.
Visuoauditory association established between the VS and the auditory cortical stimulation with CCK-8 local infusion. A, Schematic presentation of electrode and injection cannula placement, timeline and diagram for the experiment. Rats underwent three experimental phases after training: baseline test, CCK-8 infusion, and pairing during anesthesia and postintervention test. For vehicle control, CCK and ACSF were simultaneously infused into each hemisphere, respectively, before pairings of the VS and EAC of both hemispheres. B, Behavioral responses (trajectory of head movement) to the VS during baseline (green curves) and postintervention (black curves) testing of a representative rat. L, Left hole; R, right hole; M, middle hole. Stimulus pairings with CCK infusion are marked by red arrowheads. C, Individual values (top) and mean ± SEM (bottom) for decision index across weeks. **p < 0.01, one-way ANOVA with post hoc Dunnett's multiple-comparisons tests; ## p < 0.01, n.s., not significant, compared with chance level 0.5, single sample t tests. D, Behavioral responses to the VS from a representative rat. Arrowheads indicate stimulus pairing sessions followed by infusion of CCK (red) or ACSF (blue). E, decision index of individual animals (hollow circle) and grouped data (mean ± SEM) before and after stimulus pairings. n = 6, *p < 0.05, paired t tests.
Figure 2.
Figure 2.
The visuoauditory association established between the VS and the AS in the presence of CCK-4. A, Experiment timeline and schematic drawing of the experimental design for CCK-4 pairing and negative control groups. Gray shade represents the procedure under the anesthesia. B, Behavioral performance during the postintervention test from day 9 to day 11. Raster display on the left shows the performance of an exemplary rat for its response to the AS in small dots and the VS in large black dots. The VS was paired to the AS on the left side when CCK-4 was administered. C, Decision index for CCK-4 pairing and negative control groups over the 3 test days. Plots are in mean ± SEM. **p < 0.01, compared with chance level 0.5, single-sample t tests; #p < 0.05, ##p < 0.01, two-way ANOVA with pairwise comparisons.
Figure 3.
Figure 3.
Changes of auditory cortical neuronal responses to the VS. A, Neuronal responses to the VS before and after stimulus pairings. Z-scores were calculated based on differences between average neuronal firing during a 200 ms period after the VS and an equivalent period of spontaneous firing. Mean ± SEM, **p < 0.01, paired t tests. B, Positions of virus injection in the AC and virus expression in the AC. The regions of viral expression (n = 3) were superimposed on redrawn coronal sections of rat brain atlas (Swanson, 2018). Numbers at the bottom are distance posterior to bregma (mm). C, Representative image of ChR2 expression in AC. D, Representative neuronal response to AS and laser in the AAV-CaMkIIa-ChR2-mCherry injection AC. E, Raster plots and PSTHs show neuronal responses to the VS (light flash) before (leftmost) and after (rightmost) CCK infusion and stimulus pairings of VS/Laser stimulation of the AC (CCK-VS/LAC). The middle panel shows the procedure of the pairing. F, Z-scores (mean ± SEM) show that the neuronal responses to the VS before and after the CCK-VS/LAC or the ACSF-VS/LAC. Z-scores were calculated based on differences between average neuronal firing on 20 ms time bins after the VS and an equivalent period of spontaneous firing. *p < 0.05, n.s., not significant, two-way ANOVA with Sidak's multiple-comparisons tests.
Figure 4.
Figure 4.
HF activation of CCK-containing entorhino-neocortical projections enables the association between the VS and EAC, leading to behavioral changes. A, Schematic drawings for positions of virus injection in the entorhinal cortex and implantations of the laser fiber and stimulating/recording electrodes in the AC (AC). The regions of viral expression (n = 6 for CCK-ires-Cre, n = 4 for CCK−/− mice) were superimposed on redrawn coronal sections of mouse brain atlas (Paxinos and Franklin, 2001). B, AAV-DIO-ChR2-mCherry was injected into the entorhinal cortex of CCK-ires-Cre mice. Images show virus expression in the entorhinal cortex (B–C), the AC (D–E), and the visual cortex (VC) (D, F). G, AAV-DIO-ChR2-mCherry was injected into the entorhinal cortex CCK-CreER (CCK−/−) mice. Images show virus expression in the entorhinal cortex (G–H), the AC (I–J), and the VC (I, K). Scale bars: 500 μm for B, D, G, I; 100 μm for C, E, F, H, J, and K. L, fEPSPs to laser pulse train in the AC, AS, and VS of CCK-ires-Cre mice. M, fEPSPs to laser pulse train in the AC, AS, and VS of CCK−/− mice. N, Representative fEPSPs before (left) and after (right) the HF-VS/EAC and LF-VS/EAC protocols (middle). The top shows fEPSPs and the protocol of HF-VS/EAC, and the bottom shows fEPSPs and the protocol of LF-VS/EAC. O, Normalized slopes of fEPSPs after the HF-VS/EAC (red) or LF-VS/EAC (blue) pairing in CCK-ires-Cre mice. **p < 0.001, two-way ANOVA. P, Slopes of fEPSPs (mean ± SEM) after the HF-VS/EAC (red) or LF-VS/EAC (blue) pairing in CCK−/− mice. Q, baseline fEPSP slopes (mean ± SEM plus individual values) to VS in CCK-ires-cre and CCK−/− mice. R, Cued fear conditioning and stimulation protocols. SU, Bar charts show the percentage (mean ± SEM) of time spent freezing in response to the conditioned EAC and the paired VS before and after the HF-VS/EAC (S) or LF-VS/EAC (T) pairing in CCK-ires-Cre mice, and HF-VS/EAC pairing in CCK−/− mice (U). *p < 0.05, n.s., not significant, one-way ANOVA.
Figure 5.
Figure 5.
Visuo-auditory direct corticocortical projection strengthened after HF activation of entorhino-neocortical CCK+ fibers. A, Diagram of the experiment design; 473 nm and 635 nm lasers were used to activate the projecting terminals with opsins expression in the AC from entorhinal and visual cortex of Cck-ires-Cre mice, which were transfected by AAV9-syn-Flex-Chronos-GFP (green) and AAV9-syn-ChrimsonR-tdTomato (red) respectively. Glass pipette electrodes were used to record the field EPSPs evoked by natural sound stimuli and different laser stimulations. The regions of viral expression (n = 3) were superimposed on redrawn coronal sections of mouse brain atlas (Paxinos and Franklin, 2001). B, Chronos-GFP (green) expression at the injection site in entorhinal cortex. Blue is DAPI Staining. C, ChrimsonR-tdTomato (red) expression at the injection site in visual cortex. D, Projections from entorhinal CCK+ neurons (green) and visual cortical universal neurons (red) could be found in both superficial layers (white dashed rectangle) and deep layers (blue dashed rectangle) of AC, which are enlarged in E and F respectively. E1 is merged by E2 and E3, and F1 is merged by F2 and F3. Scale bars: 1000 μm for B and C, 200 μm for D, and 50 μm for E and F. G, Protocols of using HF (40 Hz, top) or LF (1 Hz, bottom) laser stimulation (473 nm) on entorhinal CCK+ projecting terminals (HF_Ent or LF_Ent) followed by pairing of laser stimulation (635 nm) on visuoauditory projecting terminals (VALS) and natural sound stimulus (noise). H, Normalized slopes of fEPSPs evoked by VALS before versus after HF_Ent/VALS/noise (red circles) or LF_Ent/VALS/noise (gray circles) pairing protocol. I, Representative single fEPSPVALS trace before versus after HF_Ent/VALS/noise (a vs b, top) or LF_Ent/VALS/noise (a′ vs b′, bottom) pairing protocol. Gray transparent rectangles indicate the laser stimulations. (Scale bar: 5 ms and 50 μV.) J, Statistics for normalized slopes of fEPSPVALS (two-way RM ANOVA, significant interaction F(1,15) = 21.326, p = 0.00033; pairwise comparison, increased by 11.2 ± 2.2%, before vs after HF_Ent/VALS/noise, p = 0.00017, n = 8; pairwise comparison, changed by 3.1 ± 2.1%, before vs after LF_Ent/VALS/noise, p = 0.16253, n = 9; pairwise comparison, 96.6 ± 2.4% vs 110.5 ± 2.5%, after LF_Ent/VALS/noise vs after HF_Ent/VALS/noise, p = 0.00121, n = 9 (1 Hz), 8 (40 Hz); pairwise comparison, 99.7 ± 1.1% vs 99.4 ± 1.2%, before LF_Ent/VALS/noise vs before HF_Ent/VALS/noise, p = 0.83437, n = 9 (1 Hz), 8 (40 Hz).) All data are mean ± SEM *p < 0.05; **p < 0.01; n.s., no significance. K, Normalized slopes of fEPSPs evoked by noise before versus after HF_Ent/VALS/noise (olive squares) or LF_Ent/VALS/noise (gray squares) pairing protocol. L, Representative single fEPSPnoise trace before versus after HF_Ent/VALS/noise (a vs b, top) or LF_Ent/VALS/noise (a' vs b', bottom panel) pairing protocol. Gray transparent rectangles indicate the noise stimuli. (Scale bar: 50 ms and 0.2 mV.) M, Statistics for normalized slopes of fEPSPnoise (two-way RM ANOVA, significant interaction F(1,15) = 8.296, p = 0.01144; pairwise comparison, increased by 13.1 ± 3.6%, before vs after HF_Ent/VALS/noise, p = 0.00260, n = 8; pairwise comparison, changed by 1.3 ± 3.4%, before vs after LF_Ent/VALS/noise, p = 0.71249, n = 9; pairwise comparison, 97.8 ± 3.7% vs 112.4 ± 3.9%, after LF_Ent/VALS/noise vs after HF_Ent/VALS/noise, p = 0.01578, n = 9 (1 Hz), 8 (40 Hz); 99.1 ± 1.2% vs 99.3 ± 1.3%, before LF_Ent/VALS/noise vs before HF_Ent/VALS/noise, pairwise comparison, p = 0.88270, n = 9 (1 Hz), 8 (40 Hz)). All data are means ± SEM *p < 0.05; **p < 0.01; n.s., no significance.

References

    1. Andersen RA. (1997) Multimodal integration for the representation of space in the posterior parietal cortex. Philos Trans R Soc Lond B Biol Sci 352:1421–1428. 10.1098/rstb.1997.0128 - DOI - PMC - PubMed
    1. Bradwejn J, Koszycki D, Meterissian G (1990) Cholecystokinin-tetrapeptide induces panic attacks in patients with panic disorder. Can J Psychiatry 35:83–85. 10.1177/070674379003500115 - DOI - PubMed
    1. Calvert GA, Bullmore ET, Brammer MJ, Campbell R, Williams SC, McGuire PK, Woodruff PW, Iversen SD, David AS (1997) Activation of auditory cortex during silent lipreading. Science 276:593–596. 10.1126/science.276.5312.593 - DOI - PubMed
    1. Canto CB, Wouterlood FG, Witter MP (2008) What does the anatomical organization of the entorhinal cortex tell us? Neural Plast 2008:381243. 10.1155/2008/381243 - DOI - PMC - PubMed
    1. Chen X, Guo Y, Feng J, Liao Z, Li X, Wang H, Li X, He J (2013) Encoding and retrieval of artificial visuoauditory memory traces in the auditory cortex requires the entorhinal cortex. J Neurosci 33:9963–9974. 10.1523/JNEUROSCI.4078-12.2013 - DOI - PMC - PubMed

Publication types

Substances