. 2020 Jan 24;11(1):468.
doi: 10.1038/s41467-019-14148-4.

PTH induces bone loss via microbial-dependent expansion of intestinal TNF+ T cells and Th17 cells

Affiliations

PTH induces bone loss via microbial-dependent expansion of intestinal TNF+ T cells and Th17 cells

Mingcan Yu et al. Nat Commun. .

Abstract

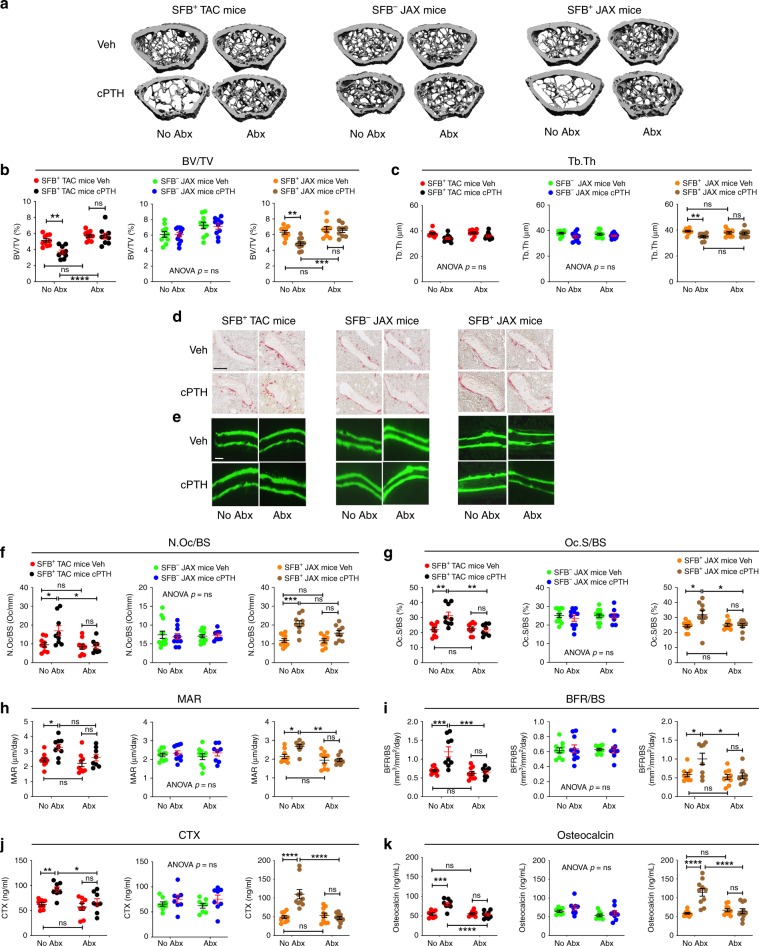
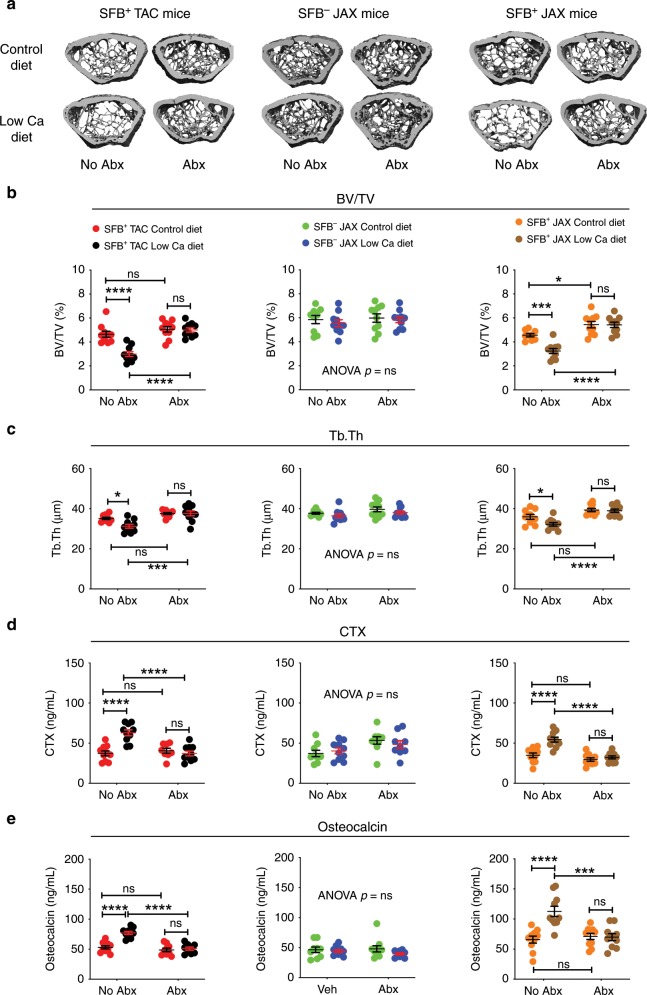
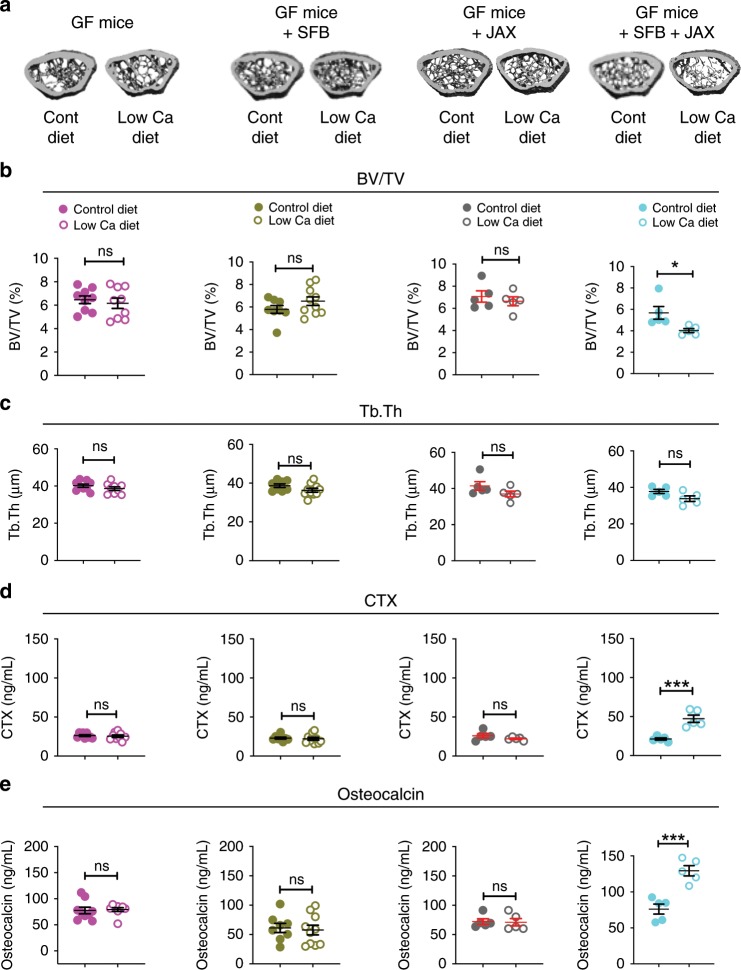
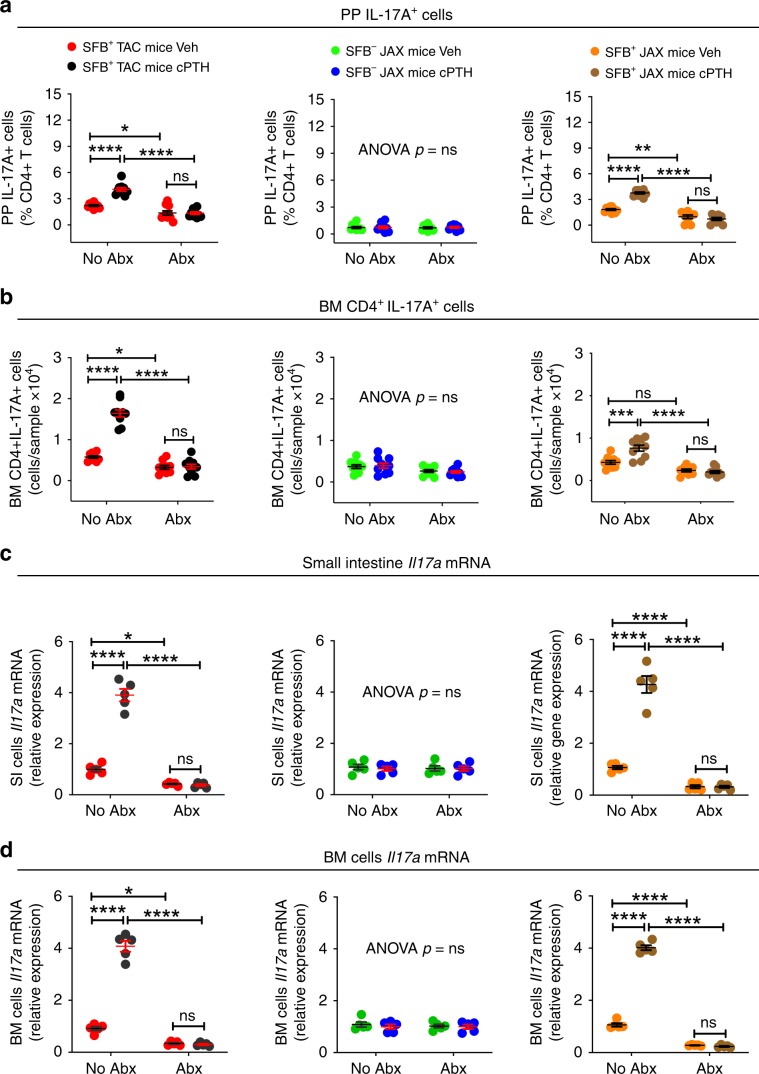
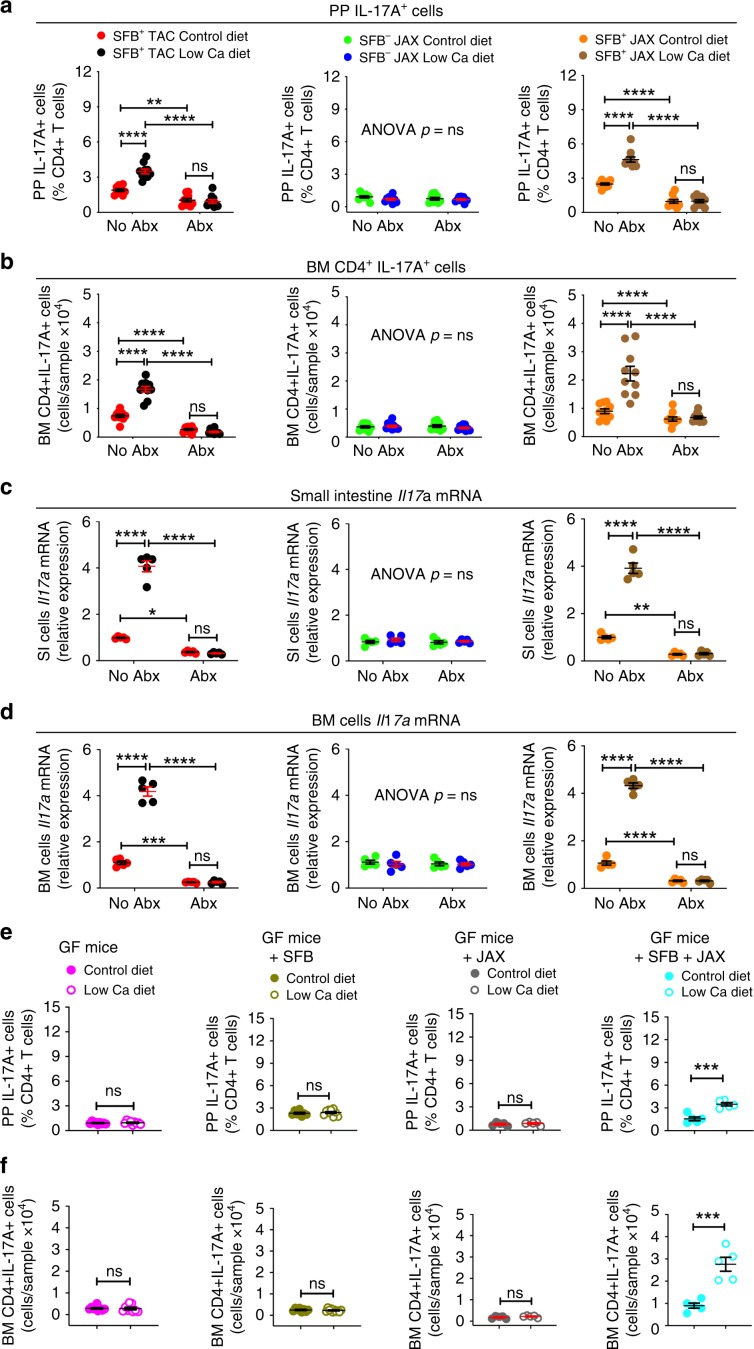
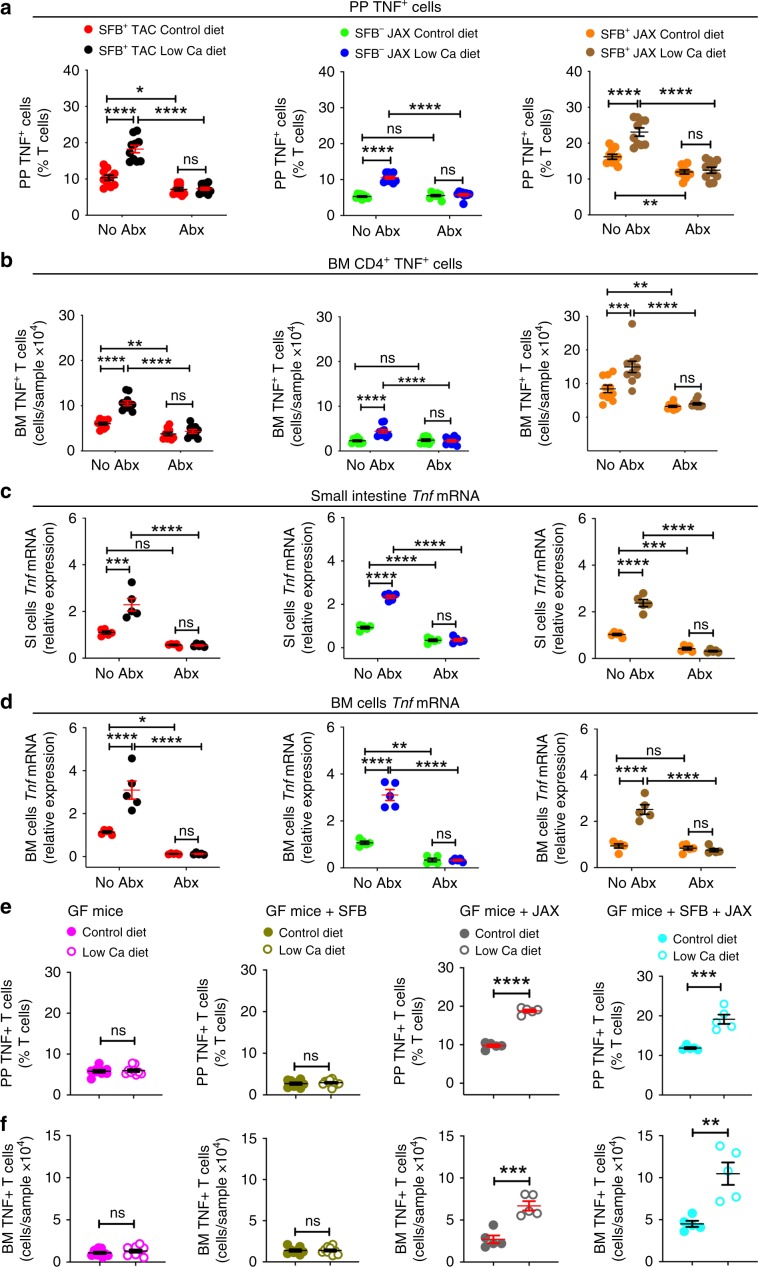
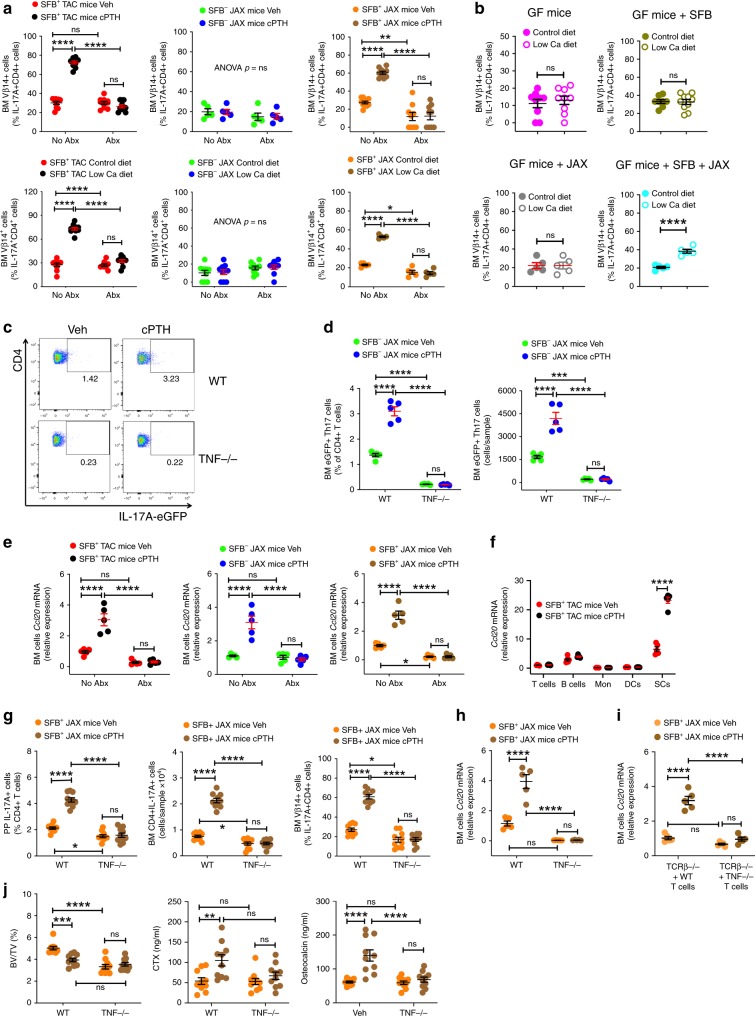
Bone loss is a frequent but not universal complication of hyperparathyroidism. Using antibiotic-treated or germ-free mice, we show that parathyroid hormone (PTH) only caused bone loss in mice whose microbiota was enriched by the Th17 cell-inducing taxa segmented filamentous bacteria (SFB). SFB+ microbiota enabled PTH to expand intestinal TNF+ T and Th17 cells and increase their S1P-receptor-1 mediated egress from the intestine and recruitment to the bone marrow (BM) that causes bone loss. CXCR3-mediated TNF+ T cell homing to the BM upregulated the Th17 chemoattractant CCL20, which recruited Th17 cells to the BM. This study reveals mechanisms for microbiota-mediated gut-bone crosstalk in mice models of hyperparathyroidism that may help predict its clinical course. Targeting the gut microbiota or T cell migration may represent therapeutic strategies for hyperparathyroidism.


Conflict of interest statement

The authors declare no competing interests.

Figures

Fig. 1
Fig. 1. SFB+ microbiota is sufficient for cPTH to induce trabecular bone loss and stimulate bone turnover.
SFB+ and SFB mice from Taconic (TAC) and Jackson Laboratory (JAX) were treated with vehicle or cPTH for 2 weeks with antibiotics (Abx) or without antibiotics (No Abx). a The figure shows images of representative 3-dimensional μCT reconstructions of examined femurs. b Femoral trabecular bone volume fraction (BV/TV), n = 9–11 mice per group. c. Trabecular thickness (Tb.Th), n = 9–11 mice per group. d The images show representative tartrate resistant acid phosphatase (TRAP) stained sections of the distal femur. Original magnification ×40. Scale bar represents 300 μm. e Images are representative sections displaying the calcein double-fluorescence labeling. Original magnification ×20. Scale bar represents 300 μm f Number of osteoclasts per mm bone surface (N.Oc/BS), n = 8–10 mice per group. g Percentage of bone surface covered by osteoclasts (Oc.S/BS), n = 8–10 mice per group. h Mineral apposition rate (MAR), n = 8–10 mice per group. i Bone formation rate per mm bone surface (BFR/BS), n = 8–10 mice per group. j Serum levels of CTX, a marker of bone resorption, n = 8–10 mice per group. k Serum levels of osteocalcin, a marker of bone formation, n = 8–10 mice per group. All data are expressed as Mean ± SEM. All data were normally distributed according to the Shapiro-Wilk normality test. Data were analyzed by two-way ANOVA and post hoc tests applying the Bonferroni correction for multiple comparisons. *p < 0.05, **p < 0.01, ***p < 0.001, and ****p < 0.0001 compared to the indicated group. Source data are provided as a Source Data file.
Fig. 2
Fig. 2. SFB+ microbiota is sufficient for low calcium diet to induce trabecular bone loss and stimulate bone turnover.
SFB+ TAC and JAX mice and SFB- JAX mice were treated with control diet or low calcium diet for 4 weeks and with antibiotics (Abx) or without antibiotics (No Abx). a The figure shows images of representative three-dimensional μCT reconstructions of examined femurs. b Femoral trabecular bone volume/total volume fraction (BV/TV), n = 9–10 mice per group. c Trabecular thickness (Tb.Th), n = 9–10 mice per group. d Serum levels of CTX, a marker of bone resorption, n = 8–10 mice per group. e Serum levels of osteocalcin, a marker of bone formation, n = 9–10 mice per group. All data are expressed as Mean ± SEM. All data were normally distributed according to the Shapiro-Wilk normality test. Data were analyzed by two-way ANOVA and post hoc tests applying the Bonferroni correction for multiple comparisons. *p < 0.05, ***p < 0.001, and ****p < 0.0001 compared to the indicated group. Source data are provided as a Source Data file.
Fig. 3
Fig. 3. SFB+ microbiota is sufficient for low calcium diet to alter bone structure and turnover in GF mice subjected to fecal material transfer.
Germ-free (GF) mice, SFB monoassociated GF mice, and GF mice colonized with JAX mice microbiota ±SFB were treated with control diet or low calcium diet for 4 weeks. a The figure shows images of representative three-dimensional μCT reconstructions of examined femurs. b Femoral trabecular bone volume/total volume fraction (BV/TV), n = 5–10 mice per group. c Trabecular thickness (Tb.Th), n = 5–10 mice per group. d Serum levels of CTX, a marker of bone resorption, n = 5–10 mice per group. e Serum levels of osteocalcin, a marker of bone formation, n = 5–10 mice per group. Data are expressed as Mean ± SEM. All data were normally distributed according to the Shapiro-Wilk normality test and analyzed by unpaired t-tests. *p < 0.05 and ***p < 0.001 compared to the indicated group. Source data are provided as a Source Data file.
Fig. 4
Fig. 4. SFB+ microbiota is sufficient for cPTH to expand intestinal and BM Th17 cells.
a Relative frequency of PP Th17 cells, n = 9–10 mice per group. b Absolute number of BM Th17 cells, n = 9–10 mice per group. c Small Intestine levels of Il17a transcripts, n = 5 mice per group. d BM levels of Il17a transcripts, n = 5 mice per group. SFB+ TAC and JAX mice and SFB JAX mice were treated with cPTH with antibiotics (Abx) or without antibiotics (No Abx) for 2 weeks. Data are expressed as Mean ± SEM. All data were normally distributed according to the Shapiro-Wilk normality test. Data were analyzed by two-way ANOVA and post hoc tests applying the Bonferroni correction for multiple comparisons. *p < 0.05, **p < 0.01,***p < 0.001, and ****p < 0.0001 compared to the indicated group. Source data are provided as a Source Data file.
Fig. 5
Fig. 5. SFB+ microbiota is sufficient for low calcium diet to expand intestinal and BM Th17 cells.
ad Frequency of PP and BM Th17 cells and small intestine (SI) and BM levels of Il17a transcripts in SFB+ TAC and JAX and SFB- JAX mice treated with control diet or low calcium diet for 4 weeks with antibiotics (Abx) or without antibiotics (No Abx), a, b n = 9–10 mice per group; c, d n = 5 mice per group. e, f Frequency of PP and BM Th17 cells in GF mice, SFB monoassociated GF mice, and GF mice colonized with JAX mice microbiota ±SFB treated with control diet or low calcium diet for 4 weeks, n = 5–10 mice per group. Data are expressed as Mean ± SEM. All data were normally distributed according to the Shapiro-Wilk normality test. Data in ad were analyzed by two-way analysis-of-variance and post hoc tests applying the Bonferroni correction for multiple comparisons. Data in panels e,f were analyzed by unpaired t-tests. *p < 0.05, **p < 0.01, ***p < 0.001, and ****p < 0.0001 compared to the indicated group. Source data are provided as a Source Data file.
Fig. 6
Fig. 6. SFB microbiota is sufficient for cPTH to expand intestinal and BM TNF+ T cells.
a Relative frequency of PP TNF+ T cells, n = 9–10 mice per group. b Absolute number of BM TNF+ T cells, n = 9–10 mice per group. c, d SI and BM levels of Tnf transcripts. SFB+ TAC and JAX mice and SFB- JAX mice were treated with cPTH with antibiotics (Abx) or without antibiotics (No Abx) for 2 weeks, n = 5 mice per group. All data were normally distributed according to the Shapiro-Wilk normality test. Data were analyzed by two-way ANOVA and post hoc tests applying the Bonferroni correction for multiple comparisons. **p < 0.01, ***p < 0.001, and ****p < 0.0001 compared to the indicated group. Source data are provided as a Source Data file.
Fig. 7
Fig. 7. SFB microbiota is sufficient for low calcium diet to expand intestinal and BM TNF+ T cells.
ad Frequency of PP and BM TNF+ T cells and small intestine (SI) and BM levels of Tnf transcripts in SFB+ TAC and JAX and SFB JAX mice treated with control diet or low calcium diet for 4 weeks with antibiotics (Abx) or without antibiotics (No Abx), a, b n = 9–10 mice per group; c, d n = 5 mice per group. e, f. Frequency of PP and BM TNF+ T cells in GF mice, SFB monoassociated GF mice, and GF mice colonized with JAX mice microbiota ±SFB treated with control diet or low calcium diet for 4 weeks, n = 5–10 mice per group. Data are expressed as Mean ± SEM. All data were normally distributed according to the Shapiro-Wilk normality test. Data in ad were analyzed by two-way analysis-of-variance and post hoc tests applying the Bonferroni correction for multiple comparisons. Data in e, f were analyzed by unpaired t-tests. *p < 0.05, **p < 0.01, ***p < 0.001, and ****p < 0.0001 compared to the indicated group. Source data are provided as a Source Data file.
Fig. 8
Fig. 8. TNF is sufficient for cPTH and low calcium diet to upregulate CCL20 levels in the BM and recruit Th17 cells to the BM.
a Relative frequency of BM Vβ14 + Th17 cells in SFB+ TAC and JAX mice treated with cPTH or low calcium, diet with antibiotics (Abx) or without antibiotics (No Abx), n = 5–10 mice per group. b Relative frequency of BM Vβ14 + Th17 cells in GF mice, SFB monoassociated GF mice, and GF mice colonized with JAX mice microbiota ±SFB treated with control diet or low calcium diet, n = 5–10 mice per group. c, d Representative FACS plot and frequency of eGFP + Th17 cells in the BM of WT and Tnf−/− mice treated with Veh or cPTH and previously subjected to adoptive transfer of IL-17A-eGFP+ cells, n = 5 mice per group. e BM cells transcript levels of Ccl20 in SFB+ and SFB TAC and JAX mice treated with and without Abx and cPTH, n = 5 mice per group. f Transcript levels of Ccl20 in purified BM T cells, B cells, monocytes (Mon), dendritic cells (DCs) and stromal cells (SCs), n = 5 mice per group. g Frequency of PP and BM Th17 cells, and BM Vβ14 + Th17 cells in WT and Tnf−/− mice, n = 10 mice per group. h BM cells Ccl20 transcripts in WT and Tnf−/− mice, n = 5 mice per group. i BM cells Ccl20 transcripts in Tcrb−/− mice reconstituted with WT T cells or Tnf−/− T cells, n = 5 mice per group. j BV/TV, serum CTX levels and serum osteocalcin levels in WT and Tnf−/− mice, n = 10 mice per group. In panels F-I SFB+ JAX mice were treated with Veh or cPTH. Data are expressed as Mean ± SEM. All data were normally distributed according to the Shapiro-Wilk normality test. Data in a, dj were analyzed by two-way analysis-of-variance and post hoc tests applying the Bonferroni correction for multiple comparisons. Data in panel b were analyzed by unpaired t-tests. *p < 0.05, **p < 0.01, ***p < 0.001, and ****p < 0.0001 compared to the indicated group. Source data are provided as a Source Data file.
Fig. 9
Fig. 9. Blockade of T cell egress from the intestine or of T cell influx in the BM prevent cPTH induced bone loss.
a Effects of cPTH on the number of PP and BM Th17 cells and BM Vβ14 + Th17 cells in SFB+ TAC mice treated with FTY720, n = 10 mice per group. b Effects of cPTH on the number of PP and BM TNF+ T cells in SFB+ TAC mice treated with FTY720, n = 10 mice per group. c Effects of cPTH on BV/TV, Tb.Th, serum CTX levels and serum osteocalcin levels in SFB+ TAC mice treated with FTY720, n = 10 mice per group. d Effects of cPTH on the number of PP and BM Th17 cells and BM Vβ14 + Th17 cells in SFB+ TAC mice treated with anti-CCL20 Ab, n = 10 mice per group. e Effects of cPTH on the number of PP and BM TNF+ T cells in SFB+ TAC mice treated with anti-CCL20 Ab, n = 10 mice per group. f Effects of cPTH on BV/TV, Tb.Th, serum CTX levels and serum osteocalcin levels in SFB+ TAC mice treated with anti-CCL20 Ab, n = 9–10 mice per group. g Effects of cPTH on the number of PP and BM Th17 cells and BM Vβ14 + Th17 cells in SFB+ JAX Cxcr3−/− mice and WT littermates, n = 9–10 mice per group. h Effects of cPTH on the number of PP and BM TNF+ T cells in SFB+ JAX Cxcr3−/− mice and WT littermates, n = 9–10 mice per group. i. Effects of cPTH on BV/TV, Tb.Th, serum CTX levels and serum osteocalcin levels in in SFB+ JAX Cxcr3−/− mice and WT littermates, n = 9–10 mice per group. Data are expressed as Mean ± SEM. All data were normally distributed according to the Shapiro-Wilk normality test and analyzed by two-way analysis-of-variance and post hoc tests applying the Bonferroni correction for multiple comparisons. *p < 0.05, **p < 0.01, ***p < 0.001, and ****p < 0.0001 compared to the indicated group. Source data are provided as a Source Data file.

Comment in

References

    1. Wein, M. N. & Kronenberg, H. M. Regulation of bone remodeling by parathyroid hormone. Cold Spring Harb Perspect Med.8, a031237 (2018). - PMC - PubMed
    1. Bilezikian JP. Primary hyperparathyroidism. J. Clin. Endocrinol. Metab. 2018;103:3993–4004. doi: 10.1210/jc.2018-01225. - DOI - PMC - PubMed
    1. Iida-Klein A, et al. Short-term continuous infusion of human parathyroid hormone 1-34 fragment is catabolic with decreased trabecular connectivity density accompanied by hypercalcemia in C57BL/J6 mice. J. Endocrinol. 2005;186:549–557. doi: 10.1677/joe.1.06270. - DOI - PubMed
    1. Potts, J. Primary hyperparathyroidism. in Metabolic Bone Diseases, 1 (Avioli, L. V. & Krane, S. eds.) 411–442 (Academic Press, San Diego, 1998).
    1. Silverberg SJ, et al. Skeletal disease in primary hyperparathyroidism. J. Bone Min. Res. 1989;4:283–291. doi: 10.1002/jbmr.5650040302. - DOI - PubMed

Publication types

MeSH terms

Substances