. 2020 Jan 24;11(1):485.
doi: 10.1038/s41467-020-14362-5.

Interrogation of enhancer function by enhancer-targeting CRISPR epigenetic editing

Affiliations

Interrogation of enhancer function by enhancer-targeting CRISPR epigenetic editing

Kailong Li et al. Nat Commun. .

Abstract

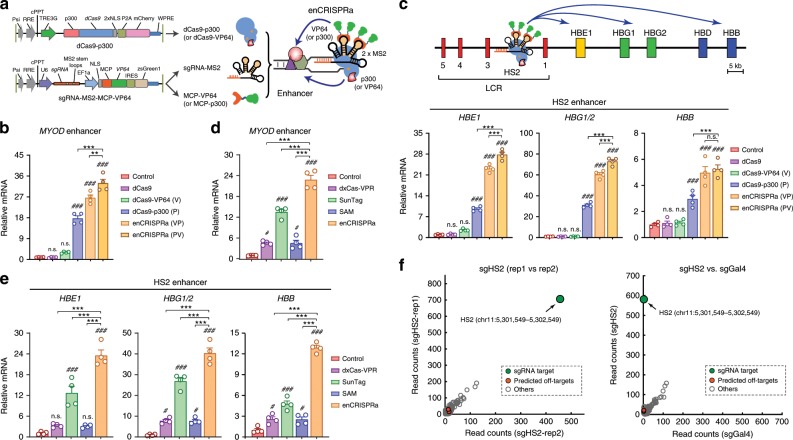
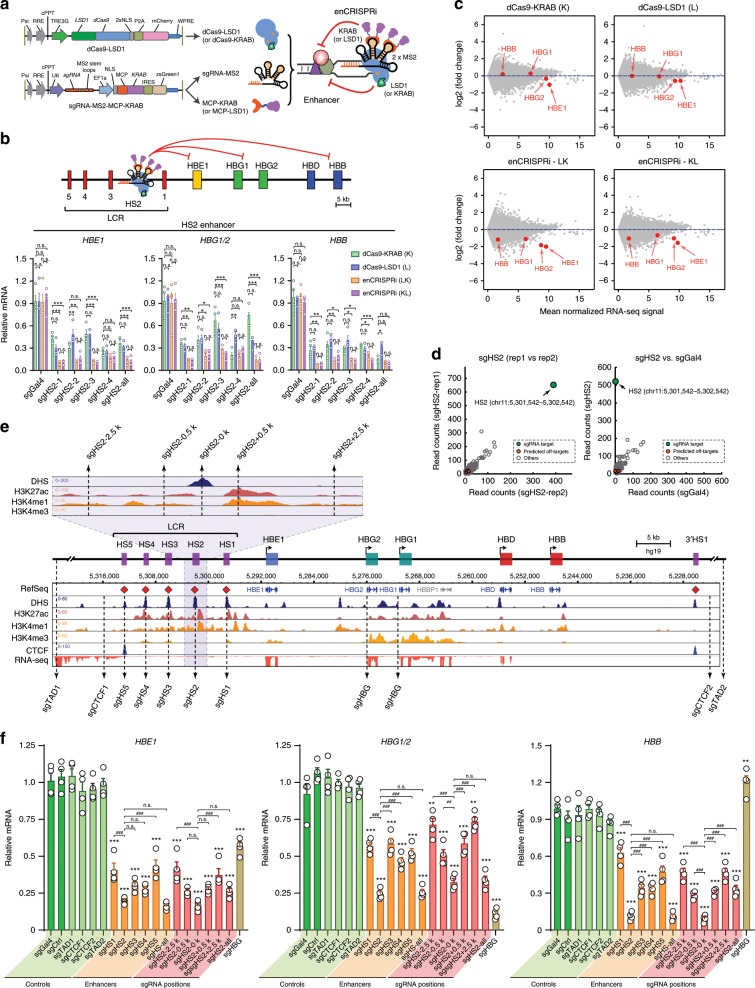
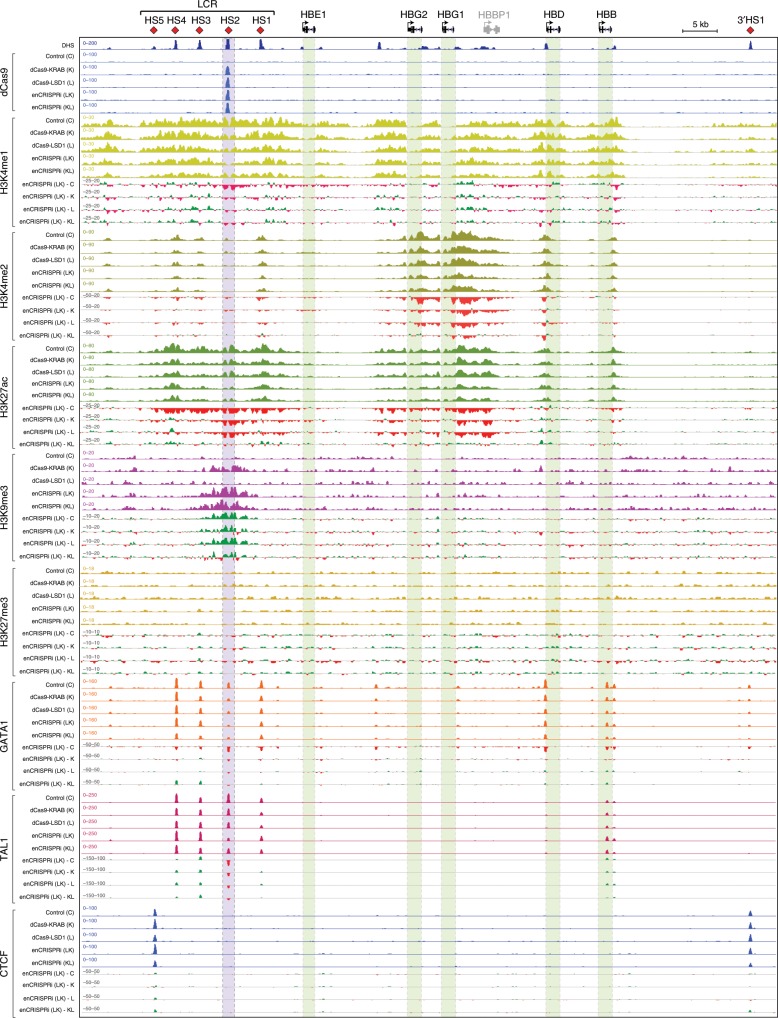
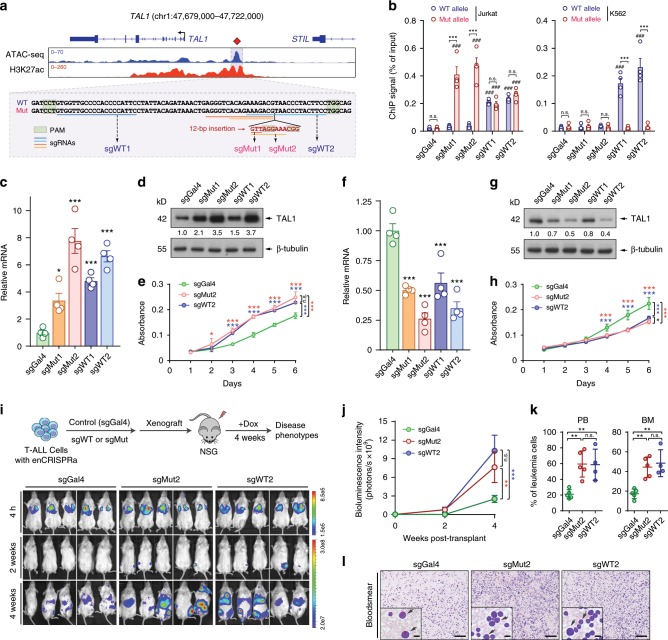
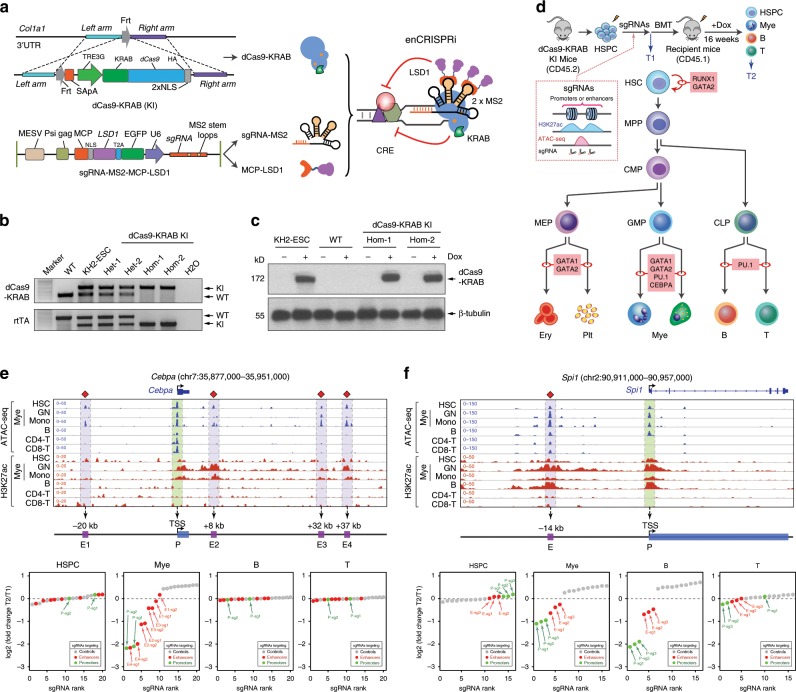
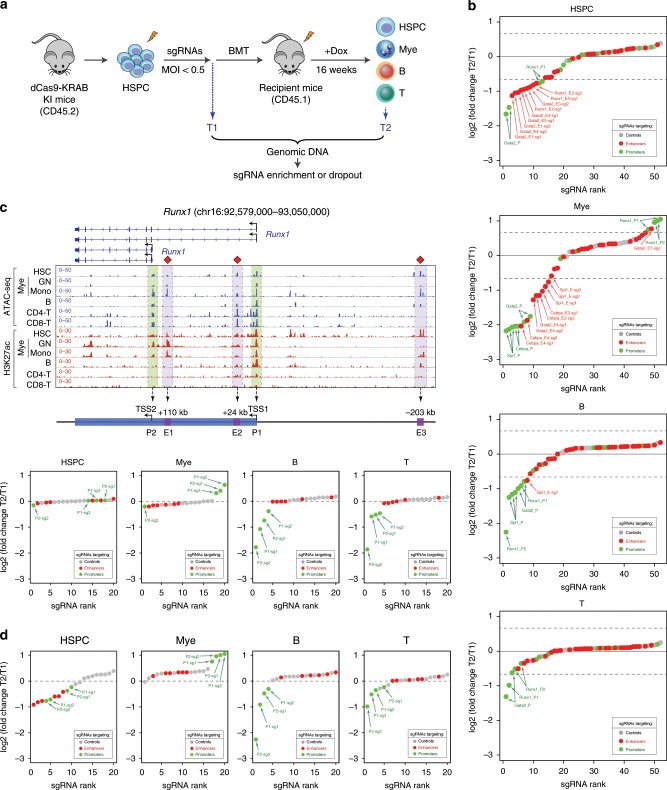
Tissue-specific gene expression requires coordinated control of gene-proximal and -distal cis-regulatory elements (CREs), yet functional analysis of gene-distal CREs such as enhancers remains challenging. Here we describe CRISPR/dCas9-based enhancer-targeting epigenetic editing systems, enCRISPRa and enCRISPRi, for efficient analysis of enhancer function in situ and in vivo. Using dual effectors capable of re-writing enhancer-associated chromatin modifications, we show that enCRISPRa and enCRISPRi modulate gene transcription by remodeling local epigenetic landscapes at sgRNA-targeted enhancers and associated genes. Comparing with existing methods, the improved systems display more robust perturbations of enhancer activity and gene transcription with minimal off-targets. Allele-specific targeting of enCRISPRa to oncogenic TAL1 super-enhancer modulates TAL1 expression and cancer progression in xenotransplants. Single or multi-loci perturbations of lineage-specific enhancers using an enCRISPRi knock-in mouse establish in vivo evidence for lineage-restricted essentiality of developmental enhancers during hematopoiesis. Hence, enhancer-targeting CRISPR epigenetic editing provides opportunities for interrogating enhancer function in native biological contexts.


Conflict of interest statement

The authors declare no competing interests.

Figures

Fig. 1
Fig. 1. Development of the dual-activator enCRISPRa system.
a Schematic of enCRISPRa containing three components: a dCas9-p300 fusion protein, the sgRNA with two MS2 hairpins, and the MCP-VP64 fusion protein. b Expression of MYOD upon dCas9 alone, dCas9-VP64 (V), dCas9-p300 (P), dCas9-VP64 + MCP-p300 (enCRISPRa-VP) or dCas9-p300 + MCP-VP64 (enCRISPRa-PV)-mediated enhancer activation in HEK293T cells. mRNA expression relative to nontransduced cells (control) is shown as mean ± SEM (n = 4 experiments). The differences between control and dCas9 activators were analyzed by a one-way ANOVA. #P < 0.05,   ###P < 0.001. The difference between different dCas9 activators were analyzed by a one-way ANOVA. *P < 0.05, **P < 0.01, ***P < 0.001, n.s. not significant. c Expression of HBE1, HBG1/2 and HBB upon dCas9 alone, dCas9-VP64 (V), dCas9-p300 (P), or enCRISPRa (VP and PV)-mediated activation of the HS2 enhancer in HEK293T cells. mRNA expression relative to nontransduced cells is shown as mean ± SEM (n = 4 experiments) and analyzed by a one-way ANOVA. d Expression of MYOD upon dxCas9-VPR, SunTag, SAM or enCRISPRa-mediated enhancer activation in HEK293T cells. mRNA expression relative to nontransduced cells is shown as mean ± SEM (n = 4 experiments). The differences between control and dCas9 activators were analyzed by a one-way ANOVA. #P < 0.05,   ###P < 0.001. The difference between different dCas9 activators were analyzed by a one-way ANOVA. ***P < 0.001. e Expression of HBE1, HBG1/2 and HBB upon dxCas9-VPR, SunTag, SAM or enCRISPRa-mediated activation of HS2 in HEK293T cells. mRNA expression relative to nontransduced cells is shown as mean ± SEM (n = 4 experiments) and analyzed by a one-way ANOVA. f Genome-wide analysis of dCas9 binding in HEK293T cells expressing HS2-specific sgRNA (two replicates sgHS2-rep1 and sgHS2-rep2) or nontargeting sgGal4. Data points for the sgRNA target regions and the predicted off-targets are shown as green and red, respectively. The x- and y axis denote the normalized read counts (left) or mean normalized read counts from n = 2 experiments (right). Source data are provided as a Source Data file.
Fig. 2
Fig. 2. Development of the dual-repressor enCRISPRi system.
a Schematic of enCRISPRi containing a dCas9-LSD1 fusion protein, the sgRNA with two MS2 hairpins, and the MCP-KRAB fusion protein. b Expression of β-globin genes in K562 cells upon dCas9-KRAB (K), dCas9-LSD1 (L) or enCRISPRi (LK and KL)-mediated repression of the HS2 enhancer using four HS2-targeting sgRNAs individually (sgHS2-1 to sgHS2-4) or combined (sgHS2-all). The nontargeting sgGal4 was analyzed as the control. mRNA expression relative to nontransduced cells is shown as mean ± SEM (n = 4 experiments) and analyzed by a two-way ANOVA. *P < 0.05, **P < 0.01, ***P < 0.001, n.s. not significant. c RNA-seq profiles in K562 cells upon dCas9-KRAB, dCas9-LSD1 or enCRISPRi-mediated repression of the HS2 enhancer using four sgRNAs (sgHS2-all). Scatter plot is shown for each gene by the mean of log2 normalized RNA-seq signals as transcripts per million or TPM (n = 2 experiments) (x axis) and log2 fold changes of mean TPM in cells expressing sgHS2 and nontransduced cells (y axis). β-globin genes are indicated by red arrowheads. d Genome-wide analysis of dCas9 binding in K562 cells expressing HS2-specific sgRNA (sgHS2-rep1 and sgHS2-rep2) or nontargeting sgGal4. Data points for the sgRNA target regions and the predicted off-targets are shown as green and red, respectively. e Density maps are shown for DHS, ChIP-seq of H3K27ac, H3K4me1, H3K4me2, CTCF, and RNA-seq at the β-globin cluster (chr11: 5,222,500–5,323,700; hg19). The zoom-in view of the HS2 proximity region is shown on the top. Dashed lines denote the positions of sgRNAs. f Expression of β-globin genes in K562 cells coexpressing enCRISPRi and target-specific sgRNAs at various positions within the β-globin cluster, control sgRNAs (sgCtrl, sgTAD1, sgTAD2, sgCTCF1 and sgCTCF2) or nontargeting sgGal4. mRNA expression relative to nontransduced cells is shown as mean ± SEM. The differences between control sgGal4 and other sgRNAs were analyzed by a one-way ANOVA. *P < 0.05, **P < 0.01, ***P < 0.001, n.s. not significant. The differences between sgHS2 and other sgRNAs were analyzed by a one-way ANOVA. ##P < 0.01, ###P < 0.001. Source data are provided as a Source Data file.
Fig. 3
Fig. 3. Locus-specific epigenetic reprogramming at the β-globin gene cluster.
Density maps are shown for ChIP-seq of dCas9, active histone marks (H3K4me1, H3K4me2, and H3K27ac), repressive H3K9me3 and H3K27me3, GATA1, TAL1, and CTCF at the β-globin cluster (chr11: 5,222,500−5,323,700; hg19) in K562 cells coexpressing nontargeting sgGal4 (control or C) or sgHS2 with dCas9-KRAB (K), dCas9-LSD1 (L) or enCRISPRi (LK and KL). Regions showing increased or decreased ChIP-seq signals in enCRISPRi (LK) relative to control, dCas9-KRAB, dCas9-LSD1 or enCRISPRi (KL) (enCRISPRi—C, enCRISPRi—K, enCRISPRi—L, or enCRISPRi—KL) are depicted in green and red, respectively. Blue bars denote the sgRNA-targeted HS2 enhancer. Green bars denote the β-globin genes. Independent replicate experiments are shown as rep1 and rep2 in Supplementary Figs. 2 and 3, respectively.
Fig. 4
Fig. 4. Perturbations of TAL1 oncogenic super-enhancer in xenografts.
a Density maps are shown for ATAC-seq and H3K27ac ChIP-seq at TAL1 (chr1:47,679,000–47,722,000; hg19) in Jurkat cells. The TAL1 oncogenic SE is shown as blue shaded lines. The positions of sgRNAs and PAM sequences are shown as colored lines and boxes, respectively. b Chromatin occupancy of dCas9-p300 by target-specific (sgMut1, sgMut2, sgWT1 and sgWT2) or nontargeting sgGal4 in Jurkat or K562 cells. ChIP signals (% of input) are shown as mean ± SEM (n = 4 experiments). c Expression of TAL1 mRNA in Jurkat cells upon enCRISPRa-mediated enhancer activation. Results are mean ± SEM (n = 4 experiments). d Expression of TAL1 protein upon enCRISPRa-mediated enhancer activation. The quantified TAL1 expression is shown. e Activation of TAL1 SE promoted T-ALL growth in vitro. Relative absorbance by cell viability assays (y axis) at different days of culture (x axis) is shown (n = 3 experiments). f Expression of TAL1 upon enCRISPRi-mediated enhancer repression in Jurkat cells. Results are mean ± SEM (n = 4 experiments). g Expression of TAL1 protein upon enCRISPRi-mediated enhancer repression. h Repression of TAL1 SE impaired T-ALL growth in vitro (n = 3 experiments). i Activation of TAL1 SE promoted T-ALL growth in NSG mice xenografted with Jurkat cells transduced with sgGal4, sgMut2 or sgWT2, respectively. Bioluminescence intensity is shown at 4 h, 2 and 4 weeks post transplantation. j Quantification of bioluminescence intensity is shown. Results are mean ± SEM (n = 5 recipients per group). k Frequencies of leukemia cells in BM and PB of xenografted NSG mice 4 weeks post transplantation. Results are mean ± SEM (n = 5, 5, and 4 recipients for sgGal4, sgMut2 and sgWT2, respectively). l Representative bloodsmear images of NSG mice 4 weeks post transplantation. The inset images indicate the zoom-in view. Representative leukemia cells are indicated by arrowheads. Scale bars, 200 and 20 µm for full and insert images, respectively. Results are mean ± SEM and analyzed by a one-way or two-way ANOVA. *P < 0.05, **P < 0.01, ***P < 0.001, ###P< 0.001, n.s. not significant. Source data are provided as a Source Data file.
Fig. 5
Fig. 5. Locus-specific in vivo enhancer perturbation.
a Schematic of site-specific KI of tetracycline-inducible dCas9-KRAB into the Col1a1 locus. Coexpression of dCas9-KRAB, sgRNA-MS2 and MCP-LSD1 leads to assembly of enCRISPRi complex in vivo. b Validation of dCas9-KRAB and rtTA KI or WT alleles by genotyping PCR. C57BL/6 WT mouse and targeted KH2-ESC were used as controls. Two independent heterozygous (Het) and homozygous (Hom) KI mice were analyzed. c Dox-inducible expression of dCas9-KRAB fusion protein was confirmed by Western blot in the targeted KH2-ESC and two independent dCas9-KRAB KI mice. β-tubulin was analyzed as the loading control. d Schematic of in vivo perturbation of lineage-specific enhancers in dCas9-KRAB KI mice. e In vivo enCRISPRi perturbation of Cebpa CREs revealed lineage-specific requirement of Cebpa enhancers during hematopoiesis. Waterfall plots are shown for target-specific sgRNAs (green and red dots) and nontargeting control sgRNAs (gray dots) by the mean normalized log2 fold changes in HSPCs, myeloid, T or B cells 16 weeks post BMT (T2) relative to pooled sgRNA-transduced HSPCs (T1) from two independent replicate screens (n = 3 recipient mice per screen). Density maps are shown for ATAC-seq and H3K27ac ChIP-seq at the Cebpa locus (chr7:35,877,000–35,951,000; mm9) in bone marrow HSC, granulocytes (GN), monocytes (Mono), B, CD4+ and CD8+ T cells, respectively. The annotated Cebpa promoter (P) and enhancers (E1 to E4) are indicated by green and blue shaded lines. Results from independent replicate screens and statistical analyses are shown in Supplementary Fig. 7a, b. f In vivo enCRISPRi perturbation of Spi1 CREs during hematopoiesis. Density maps are shown for ATAC-seq and H3K27ac ChIP-seq at the Spi1 locus (chr2:90,911,000–90,957,000; mm9) in bone marrow HSC, GN, Mono, B, CD4+ and CD8+ T cells, respectively. The annotated Spi1 promoter (P) and enhancer (E) are indicated by green and blue shaded lines. Results from independent replicate screens and statistical analyses are shown in Supplementary Fig. 7c, d. Source data are provided as a Source Data file.
Fig. 6
Fig. 6. Multiloci perturbations of developmental enhancers during hematopoiesis.
a Schematic of in vivo pooled sgRNA-based multiloci perturbations of developmentally regulated enhancers in dCas9-KRAB KI mice. b In vivo perturbation of annotated CREs for five key hematopoietic TFs revealed the functional requirement of lineage-specific enhancers for HSC differentiation to one or multiple hematopoietic lineages. Waterfall plots are shown for target-specific sgRNAs (green and red dots) and nontargeting control sgRNAs (gray dots) by the mean normalized log2 fold changes in HSPCs, myeloid, T or B cells 16 weeks post BMT (T2) relative to pooled sgRNA-transduced HSPCs (T1) from two independent replicate screens (n = 15 recipient mice per replicate screen). Results from independent replicate screens and statistical analyses are shown in Supplementary Fig. 12. c In vivo enCRISPRi of Runx1 CREs during hematopoiesis by single locus-based perturbation. Density maps are shown for ATAC-seq and H3K27ac ChIP-seq at the Runx1 locus (chr16:92,579,000–93,050,000; mm9) in bone marrow HSC, GN, Mono, B, CD4+ and CD8+ T cells, respectively. The annotated Runx1 promoters (P1 and P2) and enhancers (E1–E3) are indicated by green and blue shaded lines. Results from independent replicate screens and statistical analyses are shown in Supplementary Fig. 9a, b. d In vivo enCRISPRi of Runx1 CREs during hematopoiesis by multiplexed perturbation. Results from independent replicate screens and statistical analyses are shown in Supplementary Fig. 9c, d.

References

    1. Thurman RE, et al. The accessible chromatin landscape of the human genome. Nature. 2012;489:75–82. doi: 10.1038/nature11232. - DOI - PMC - PubMed
    1. Andersson R, et al. An atlas of active enhancers across human cell types and tissues. Nature. 2014;507:455–461. doi: 10.1038/nature12787. - DOI - PMC - PubMed
    1. Consortium TEP. An integrated encyclopedia of DNA elements in the human genome. Nature. 2012;489:57–74. doi: 10.1038/nature11247. - DOI - PMC - PubMed
    1. Heintzman ND, et al. Distinct and predictive chromatin signatures of transcriptional promoters and enhancers in the human genome. Nat. Genet. 2007;39:311–318. doi: 10.1038/ng1966. - DOI - PubMed
    1. Visel A, Rubin EM, Pennacchio LA. Genomic views of distant-acting enhancers. Nature. 2009;461:199–205. doi: 10.1038/nature08451. - DOI - PMC - PubMed

Publication types

MeSH terms

Substances