. 2020 Jan 24;11(1):519.
doi: 10.1038/s41467-020-14293-1.

YAP/TAZ direct commitment and maturation of lymph node fibroblastic reticular cells

Affiliations

YAP/TAZ direct commitment and maturation of lymph node fibroblastic reticular cells

Sung Yong Choi et al. Nat Commun. .

Abstract

Fibroblastic reticular cells (FRCs) are immunologically specialized myofibroblasts of lymphoid organ, and FRC maturation is essential for structural and functional properties of lymph nodes (LNs). Here we show that YAP and TAZ (YAP/TAZ), the final effectors of Hippo signaling, regulate FRC commitment and maturation. Selective depletion of YAP/TAZ in FRCs impairs FRC growth and differentiation and compromises the structural organization of LNs, whereas hyperactivation of YAP/TAZ enhances myofibroblastic characteristics of FRCs and aggravates LN fibrosis. Mechanistically, the interaction between YAP/TAZ and p52 promotes chemokine expression that is required for commitment of FRC lineage prior to lymphotoxin-β receptor (LTβR) engagement, whereas LTβR activation suppresses YAP/TAZ activity for FRC maturation. Our findings thus present YAP/TAZ as critical regulators of commitment and maturation of FRCs, and hold promise for better understanding of FRC-mediated pathophysiologic processes.


Conflict of interest statement

The authors declare no competing interests.

Figures

Fig. 1
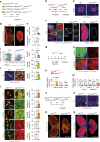
Fig. 1. YAP/TAZ support growth and structural organization of LNs by FRCs.
a Diagram for generation of indicated mice and their analyses at 8 weeks after birth. b, c Representative images of YAP or TAZ in PDGFRβ+ or CCL19+ FRCs in WT and Yap/Taz∆FRC mice. FRCs around high endothelial venule (HEV) within the white dashed-line box are magnified in the lower panels with single-channel YAP or TAZ image. Scale bars, 250 µm. d Comparisons of body weight, inguinal LN weight and total number of cells within the inguinal LN in WT (n = 11; body weight) and Yap/Taz∆FRC mice (n = 9; body weight). e Representative flow cytometric analysis and comparison of proportion of PDPN+CD31FRCs (red box) gated from CD45 stromal cells of skin-draining LNs in WT and Yap/Taz∆FRC mice. f Representative images and comparison of Ki-67+ FRCs (white arrows) in WT and Yap/Taz∆FRC mice. Scale bars, 50 µm. g Comparison of indicated stromal cell counts gated from CD45 cells of skin-draining LNs in WT and Yap/Taz∆FRC mice. BECs (n = 5), blood endothelial cells; LECs (n = 6), lymphatic endothelial cells. h Representative images of distinction between B and T cells (white dashed line) beneath the LN capsule (white line) in WT and Yap/Taz∆FRC mice. Scale bars, 200 µm. i Comparison of indicated mRNA expression in FRCs sorted from WT and Yap/Taz∆FRC mice (quintuplicate values using n= 10–15 mice/group). j, k Representative images and comparison of DsRed+ B cells and GFP+ T cells within the inguinal LN at 24 h after the adoptive transfer in WT and Yap/Taz∆FRC mice. Scale bars, 500 µm. l Changes in body weight after 1 × 103 pfu of A/PR/8 influenza viral infection (n = 13). m Flow cytometric analyses and comparisons of IFN-γ+CD8+ T cells in gated CD3ε+ T cells. n = 5 (CO) or 7 (IM) mice. Unless otherwise denoted, each dot indicates a value obtained from one mouse and n = 4 mice/group pooled from two independent experiments. Horizontal bars indicate mean ± SD and P values versus WT by two‐tailed Mann–Whitney U test. NS, not significant.
Fig. 2
Fig. 2. YAP/TAZ hyperactivation impairs differentiation and maturation of FRCs.
a Diagram for analyses of indicated mice at P14. b Representative images of PDGFRβ+ FRCs and CD31+ vessels in WT and Lats1/2∆FRC mice (n = 5). Scale bars, 500 µm. c Comparisons of LN weight (n = 4–7) and total number of cells (n = 6–10) in WT and Lats1/2∆FRC mice. d Diagram for analyses of indicated mice at E18.5 or P14. e Representative images of LN anlagen (dashed line) at E18.5 showing CD4+ LTi cells in WT and Lats1/2ΔFRC mice (n = 6). Scale bars, 200 μm. f, Representative images of indicated markers (dashed box) within the inguinal LN (dotted-line) in WT and Lats1/2ΔFRC mice at P14 (n = 6). Scale bars, 500 µm. g, h Diagram and representative images for analyses of WTΔFRC-TR mice (n = 6) that were injected with anti-CD3ε for 5 days to induce T cell depletion. Scale bars, 100 μm. i Representative flow cytometric plots and comparison of proportion of PDPN+CD31 FRCs (red box) and PDPNCD31 double-negative (DN) cells of skin-draining LNs in WT and Lats1/2∆FRC (n = 5–6) mice. j Representative images and comparison of YAP expression and nuclear localization (green-arrowheads) in LN of WT and Lats1/2∆FRC mice (n = 5). Scale bars, 20 µm. k Comparison of indicated mRNA expression in FRCs sorted from WTΔFRC-TR and Lats1/2iΔFRC-TR mice (n = 4). l Representative images and comparisons of indicated marker expressions in LNs of WT and Lats1/2∆FRC mice (n = 4–5). Scale bars, 20 µm. m Comparison of indicated mRNA expression in FRCs sorted from WTΔFRC-TR and Lats1/2iΔFRC-TR mice. n Diagram for analyses of indicated mice at P14. o Representative images of YAP expression in LNs of WT and L1/2-Y/T∆FRCmice. Scale bars, 100 µm. p, q Representative images of indicated markers in LNs of WT and L1/2-Y/T∆FRC mice. Scale bars, 500 µm. Unless otherwise denoted, each dot indicates a value obtained from inguinal LN and n = 4 mice. Horizontal bars indicate mean ± SD and P values versus WT or WTΔFRC-TR by two‐tailed Mann‐Whitney U test except for (k) and (m) (two-tailed Student’s t-test). NS, not significant.
Fig. 3
Fig. 3. Canonical Hippo pathway LATS1/2-YAP/TAZ governs FRCs.
a Diagram for generation of indicated mice and their analyses at 8-weeks old after the tamoxifen injection from 4-weeks old. b Comparisons of the inguinal LN weight and cellularity within the inguinal LN in i-WTΔFRC-TR and i-Yap/TazΔFRC-TR mice. c Representative images of intact border between B and T cell zones (white dashed line) beneath the LN capsule (white line) in i-WTΔFRC-TR and i-Yap/TazΔFRC-TR mice (n = 4). Scale bars, 200 μm. d Representative images of preserved LYVE-1+ lymphatic vessels and CD31+ blood vessels within the inguinal LN in i-WTΔFRC-TR and i-Yap/TazΔFRC-TR mice (n = 4). The regions within the white dashed-line box around subcapsular sinuses (SCS), medullary sinus (MS) and HEVs are magnified as indicated. Scale bars, 500 μm. e Diagram for generation of indicated mice for their analyses at 8-weeks old after the tamoxifen delivery from 6-weeks old. f Comparisons of the inguinal LN weight and total number of cells within the inguinal LN in WT, i-Lats1/2∆FRC or i-L1/2-Y/T∆FRC mice. g Representative images of inguinal LN in WT, i-Lats1/2∆FRC or i-L1/2-Y/T∆FRC mice. Scale bars, 500 μm. h, i Representative images and comparison of YAP nuclear localization (white arrowheads) in inguinal LN of WT, i-Lats1/2∆FRC or i-L1/2-Y/T∆FRC mice. Scale bars, 40 µm. j, k Representative images and comparisons of indicated marker expressions in FRCs around T cell zone of inguinal LN in WT, i-Lats1/2∆FRC or i-L1/2-Y/T∆FRC mice. Scale bars, 60 µm. l Heatmap and hierarchical clustering of differentially expressed genes of RNA-Seq data in isolated FRCs from WT and i-Lats1/2∆FRC mice and list of selected downregulated genes (green) encoding cytokines and chemokines and upregulated genes (red) involved in TGF-β signaling. m Canonical IPA-annotated pathways listed in absolute IPA activation Z-score (P < 0.05) to identify potential activation or inhibition of indicated signaling pathways in isolated FRCs from i-Lats1/2∆FRC mice compared with WT. Unless otherwise denoted, each dot indicates a value obtained from one mouse and n = 5 mice/group pooled from two independent experiments. Horizontal bars indicate mean ± SD and P values versus WT, i-WTΔFRC-TR or i-Lats1/2∆FRC by two‐tailed Mann‐Whitney U test. NS, not significant.
Fig. 4
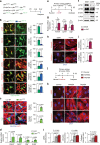
Fig. 4. FRC-specific depletion of Ltbr activates YAP/TAZ-induced myofibrosis.
a Diagram for generation of indicated mice and their analyses at 8-weeks old. b Representative images and comparisons of indicated marker expressions on CCL19-YFP+ FRCs in WT∆FRC-YR and Ltbr∆FRC-YR mice. Scale bars, 20 µm. c Representative images and comparisons of YAP and TAZ nuclear localization (white arrows) in inguinal LN of WT∆FRC and Ltbr∆FRC mice. Scale bars, 20 µm. d Comparison of indicated mRNA expression in FRCs sorted from WT∆FRC and Ltbr∆FRC mice. Each dot indicates a mean of quadruplicate values using n= 8–12 mice/group from three independent experiments. e Diagram for primary culture of FRCs derived from i-Lats1/2∆FRC-TR mice and treatment with EtOH (control) or 4-OHT at 4 days after the culture and their analyses at 2 days after the treatment. f Immunoblot analysis of indicated proteins in primary cultured mouse FRCs after treatment with EtOH or 4-OHT for 2 days. g Comparisons of indicated mRNA expression normalized to Gapdh in primary cultured mouse FRCs after treatment with EtOH or 4-OHT for 2 days. Each dot indicates a mean of triplicate values from three independent experiments. h, i Representative images and comparisons of indicated marker expressions in primary cultured mouse FRCs after treatment with EtOH or 4-OHT for 2 days. Scale bars, 30 μm. Each dot indicates a mean of triplicate values from three independent experiments. j Diagram for primary culture of human FRCs for 4 days and infection with an adenovirus to induce overexpression of active YAP (YAP5SA) or TAZ (TAZ4SA) for their analyses at 2 days after the infection. k, l Representative images and comparisons of indicated marker expressions in primary cultured human FRCs infected with control-, YAP5SA-, or TAZ4SA-adenovirus. Scale bars, 30 μm. Each dot indicates a mean of triplicate values from three independent experiments. Unless otherwise denoted, each dot indicates a value obtained from one mouse and n = 5 mice/group pooled from two independent experiments. Horizontal bars indicate mean ± SD and P values versus WT∆FRC or WT∆FRC-YR by two‐tailed Mann‐Whitney U test except for (g), (i), and (l) (two-tailed Student’s t-test). NS, not significant.
Fig. 5
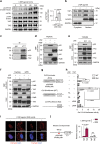
Fig. 5. YAP/TAZ regulate chemokine expression prior to LTβR engagement.
a Immunoblot analyses at indicated time points and comparison of normalized pYAP/YAP ratio at 240 min in cultured FRCs derived from WT mice after stimulation with LTβR agonistic antibody (500 ng/ml) for indicated time points. b Immunoblot analyses of indicated proteins in nuclear (LaminB) and cytoplasmic (GAPDH) fractions of cultured FRCs after treatment with or without LTβR agonistic antibody. c Immunoprecipitation (IP) with anti-IgG or anti-YAP/TAZ (αY/T) antibody in primary cultured FRCs derived immunoblot with indicated antibodies. d Pull-down assay with streptavidin resin in HEK-293T cells after transfection with the streptavidin-binding peptide (SBP)-TAZ4SA, with or without plasmids encoding p52 or RelB and immunoblot analysis with indicated antibodies. e Pull-down assay with streptavidin resin in HEK-293T cells after transfection with the (SBP)-TAZ4SA, with or without plasmids encoding p52 (WT) or p52-Y293A mutants (YA) and immunoblot analysis with indicated antibodies. f Pull-down assay with streptavidin resin in HEK-293T cells after transfection with (SBP)-TAZ4SA or (SBP)-WW domain-deleted TAZ mutant (△WW) with or without plasmids encoding p52 or RelB and immunoblot analysis with indicated antibodies. g Diagram depicting the p52/RelB binding site within the mouse Ccl19 promoter and Ccl19 promoter-driven luciferase constructs containing p52/RelB binding site (WT) or the binding site deletion mutant (Mut). h Comparison of relative luciferase reporter activity using WT and Mut in HEK-293T cells. WT and Mut was co-transfected with or without p52 or p52 mutant (YA) and TAZ or TAZ mutant (△WW) in HEK-293T cells (n = 8). P values by one-way ANOVA. i Representative images of in situ proximity ligation assay showing localizations of YAP or TAZ and p52 after treatment with or without LTβR agonistic antibody in cultured FRCs. Nuclei are stained with DAPI. Scale bars, 50 µm. j ChIP experiments using IgG or anti-TAZ antibody were performed in MEFs infected with retrovirus encoding CTL or TAZ4SA with or without LTβR agonistic antibody. Unless otherwise denoted, similar findings were observed in three independent experiments. Horizontal bars indicate mean ± SD and P value versus 0 min or Control by two-tailed Student’s t-test. NS, not significant.
Fig. 6
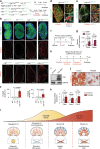
Fig. 6. Depletion of Yap/Taz transforms mesenchymal FRC precursors into adipocytes.
a Diagram for analyses of indicated mice at 8-weeks old with or without tamoxifen delivery from 4-weeks old. b, c Representative images and comparisons of perilipin+ adipocytes within the inguinal LN (dashed line) in indicated mice (n = 7). Scale bars, 400 µm. d Representative images of inguinal LN filled with adipocytes in Ltbr-Y/T∆FRC-YR mice (n = 6). Right upper panel shows the magnified view of the region within the white dashed box and yellow arrowheads in the right lower panel indicate CCL19-YFP+perilipin+BODIPY+ adipocytes. Scale bars, 500 µm (left panel); 100 µm (right lower panel). e Representative images of perilipin+ adipocytes along the LYVE-1+ lymphatic vessels (dashed-boxes) in inguinal LN of i-Ltbr-Y/T∆FRC-YR mice (n = 6). Scale bar, 400 µm. f, Diagram for primary culture of FRCs derived from i-Ltbr-Y/T∆FRC-YR mice for 4 days and treatment with EtOH or 4-OHT for their analyses at 2 days after the treatment. g Comparisons of indicated mRNA expression normalized to Gapdh in primary cultured FRCs after treatment with EtOH or 4-OHT for 2 days (n = 4). h Diagram for adipogenic culture of mesenchymal stem cells (C3H/10T1/2) infected with an adenovirus to induce overexpression of active TAZ (TAZ4SA) for their analyses at 8 days after the infection. i Immunoblot analyses of indicated proteins in mesenchymal stem cells (C3H/10T1/2) infected with an adenovirus to induce overexpression of active TAZ (TAZ4SA) or control. j Representative images of Oil Red O staining in mesenchymal stem cells (C3H/10T1/2) induced with adipogenic cocktail after infected with an adenovirus to induce overexpression of active TAZ (TAZ4SA). k Comparisons of indicated mRNA expression normalized to Gapdh in mesenchymal stem cells (C3H/10T1/2) infected with an adenovirus to induce overexpression of active TAZ (TAZ4SA) for their analyses at 2 days after the infection (n = 4). l Schematic images proposing the importance of coordination of YAP/TAZ activity and LTβR coupling in FRCs during LN growth and maintenance. Unless otherwise denoted, horizontal bars indicate mean ± SD and P values versus non-Y/T∆FRC-YR or non-i-Ltbr∆FRC-YR or EtOH or Control by two‐tailed Mann‐Whitney U test.

References

    1. Fletcher AL, Acton SE, Knoblich K. Lymph node fibroblastic reticular cells in health and disease. Nat. Rev. Immunol. 2015;15:350–361. doi: 10.1038/nri3846. - DOI - PMC - PubMed
    1. Petrova TV, Koh GY. Organ-specific lymphatic vasculature: from development to pathophysiology. J. Exp. Med. 2018;215:35–49. doi: 10.1084/jem.20171868. - DOI - PMC - PubMed
    1. Chang JE, Turley SJ. Stromal infrastructure of the lymph node and coordination of immunity. Trends Immunol. 2015;36:30–39. doi: 10.1016/j.it.2014.11.003. - DOI - PubMed
    1. Bajenoff M, Glaichenhaus N, Germain RN. Fibroblastic reticular cells guide T lymphocyte entry into and migration within the splenic T cell zone. J. Immunol. 2008;181:3947–3954. doi: 10.4049/jimmunol.181.6.3947. - DOI - PMC - PubMed
    1. Siegert S, Luther SA. Positive and negative regulation of T cell responses by fibroblastic reticular cells within paracortical regions of lymph nodes. Front Immunol. 2012;3:285. doi: 10.3389/fimmu.2012.00285. - DOI - PMC - PubMed

Publication types

MeSH terms