. 2020 Jan 24;11(1):481.
doi: 10.1038/s41467-020-14387-w.

Endothelial progeria induces adipose tissue senescence and impairs insulin sensitivity through senescence associated secretory phenotype

Affiliations

Endothelial progeria induces adipose tissue senescence and impairs insulin sensitivity through senescence associated secretory phenotype

Agian Jeffilano Barinda et al. Nat Commun. .

Erratum in

Abstract

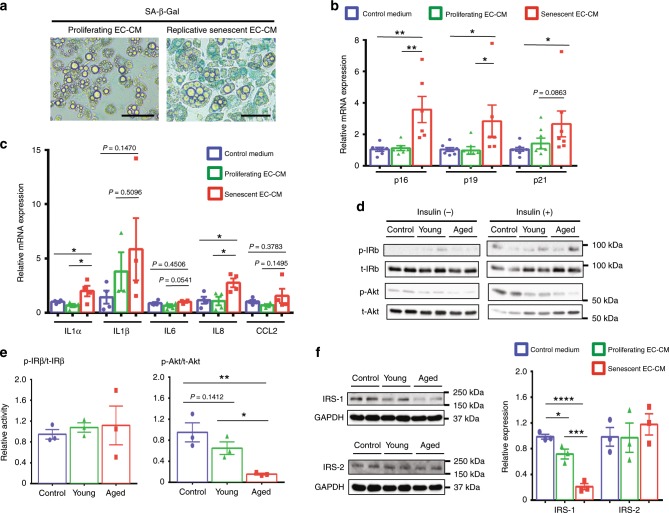
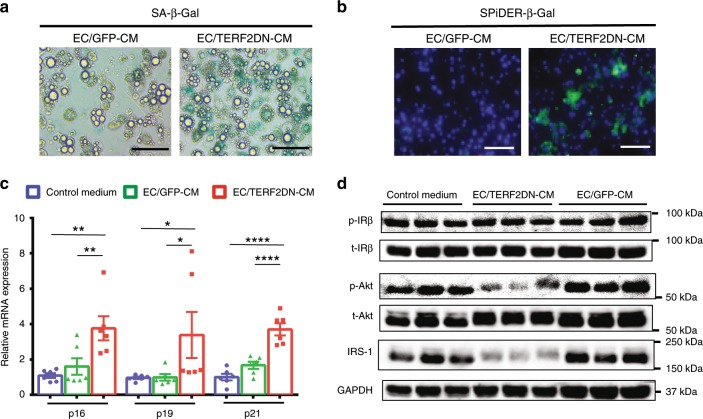
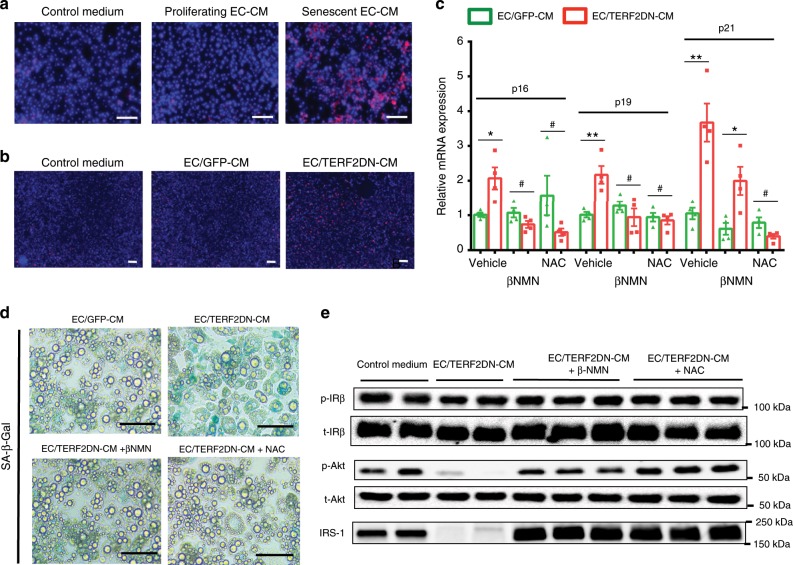
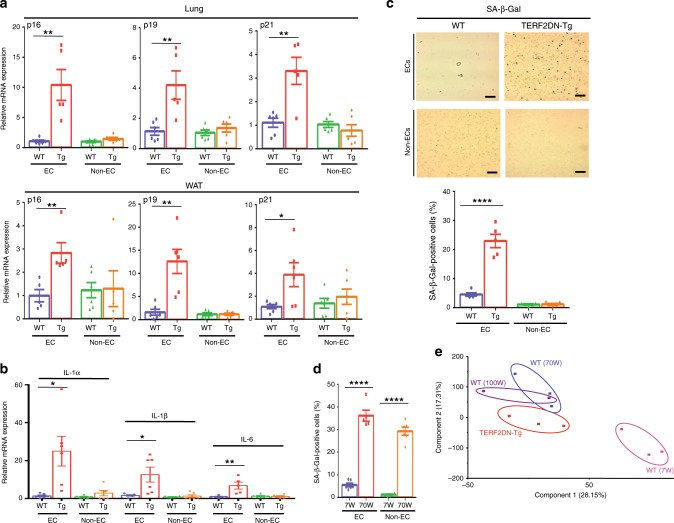
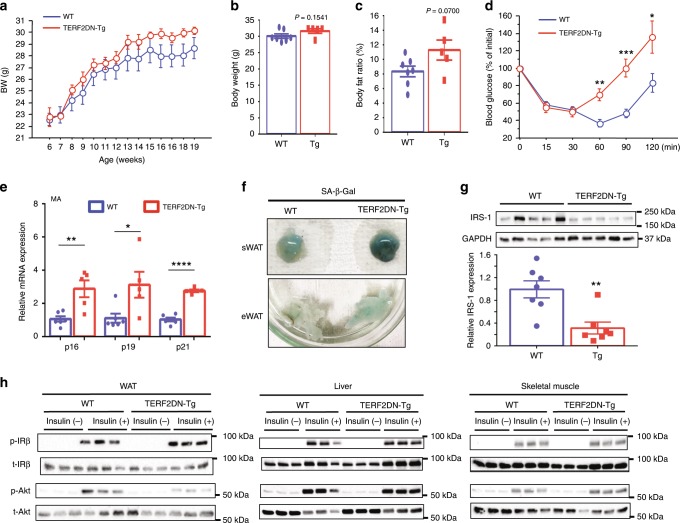
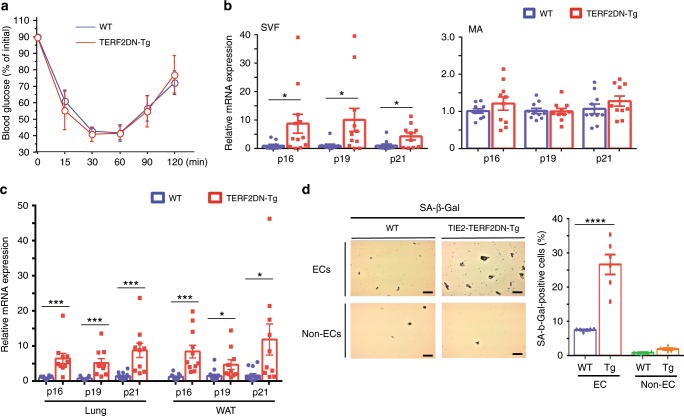
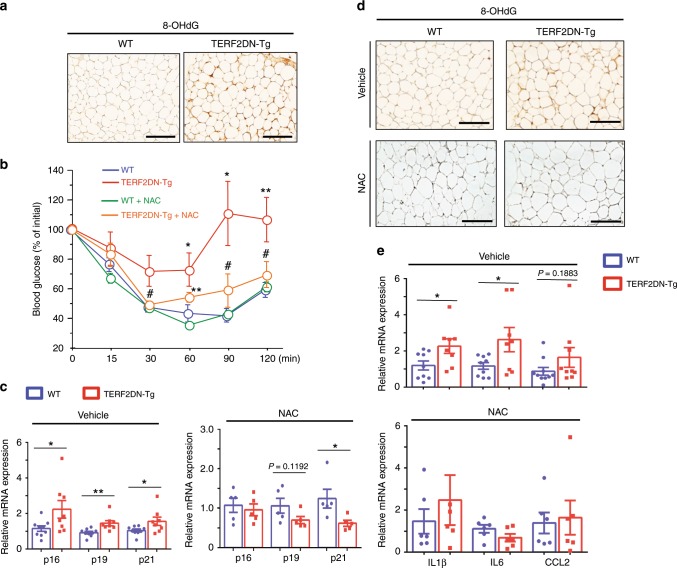
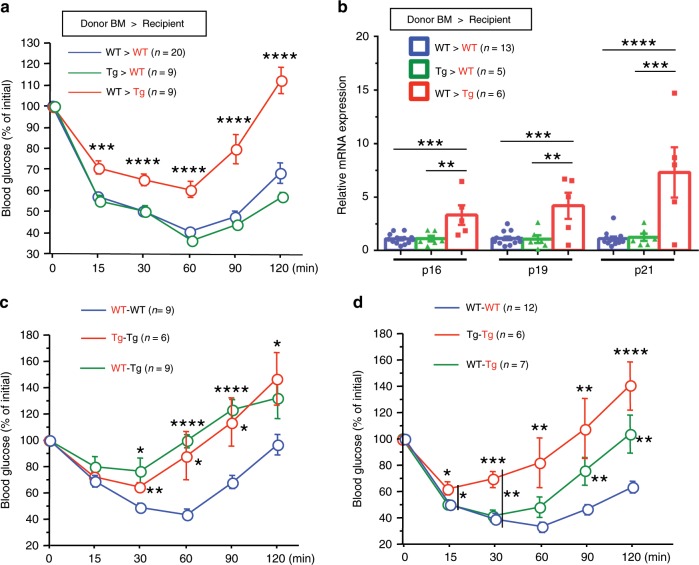
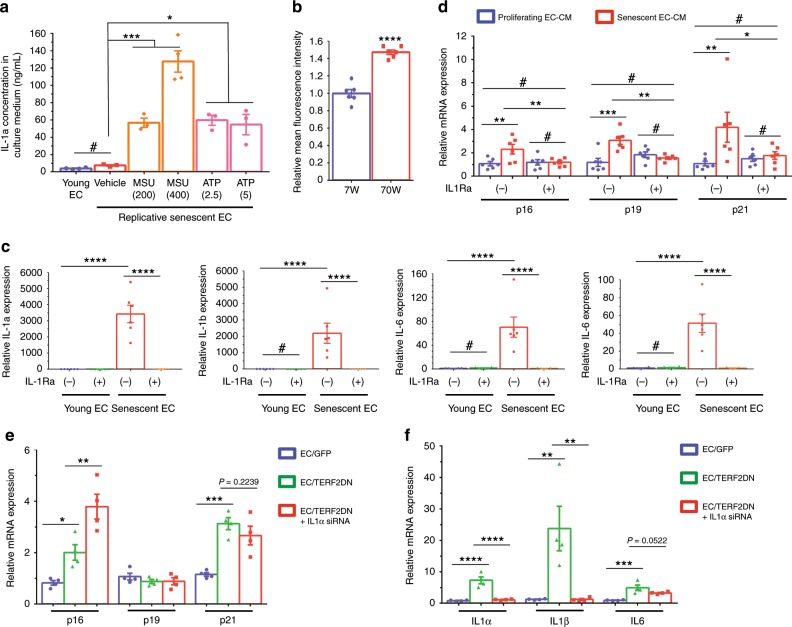
Vascular senescence is thought to play a crucial role in an ageing-associated decline of organ functions; however, whether vascular senescence is causally implicated in age-related disease remains unclear. Here we show that endothelial cell (EC) senescence induces metabolic disorders through the senescence-associated secretory phenotype. Senescence-messaging secretomes from senescent ECs induced a senescence-like state and reduced insulin receptor substrate-1 in adipocytes, which thereby impaired insulin signaling. We generated EC-specific progeroid mice that overexpressed the dominant negative form of telomeric repeat-binding factor 2 under the control of the Tie2 promoter. EC-specific progeria impaired systemic metabolic health in mice in association with adipose tissue dysfunction even while consuming normal chow. Notably, shared circulation with EC-specific progeroid mice by parabiosis sufficiently transmitted the metabolic disorders into wild-type recipient mice. Our data provides direct evidence that EC senescence impairs systemic metabolic health, and thus establishes EC senescence as a bona fide risk for age-related metabolic disease.


Conflict of interest statement

The authors declare no competing interests.

Figures

Fig. 1
Fig. 1. Replicative senescent EC impairs adipocyte function through the SASP.
a SA-β-Gal staining of 3T3-L1 adipocytes treated with the conditioned medium (CM) derived from proliferating young or replicative senescent EC. b CDK inhibitor expression in 3T3-L1 adipocytes treated with the control medium, or CM derived from proliferating young or replicative senescent EC (n = 8 biologically independent samples for control medium group; n = 6 biologically independent samples for EC-CM groups). c SASP factor expression in 3T3-L1 adipocytes treated with the control medium, or CM derived from proliferating young or replicative senescent EC (n = 4 biologically independent samples each). d Immunoblotting for the insulin signal pathway in 3T3-L1 adipocytes treated with the control medium (control), CM derived from proliferating young EC (young), or CM derived from replicative senescent EC (aged) in the presence or absence of insulin treatment. e Quantitative analysis for IRβ and Akt activation in response to insulin (n = 3 biologically independent samples each). f Immunoblotting for IRS-1 and IRS-2 in 3T3-L1 adipocytes treated with the control medium, or indicated EC-CM. Quantitative analysis was also shown (n = 3 biologically independent samples each). Non-repeated ANOVA with post hoc analysis of Fisher’s PLSD was used for difference evaluation between the groups (b, c, e, f). Data are presented as mean ± s.e. *P < 0.05, **P < 0.01, ***P < 0.001, and ****P < 0.0001. Bars: 100 μm. Source data are provided as a Source Data file.
Fig. 2
Fig. 2. Premature senescent EC impairs adipocyte function through the SASP.
a SA-β-Gal staining in 3T3-L1 adipocytes treated with CM derived from control ECs (EC/GFP-CM) or premature senescent ECs (EC/TERF2DN-CM). b SPiDER-β-Gal staining in 3T3-L1 adipocytes treated with CM derived from control ECs (EC/GFP-CM) or premature senescent ECs (EC/TERF2DN-CM). c CDK inhibitor expression in 3T3-L1 adipocytes treated with the control medium, EC/GFP-CM or EC/TERF2DN-CM (n = 6 biologically independent samples each). d Immunoblotting for the insulin signal pathway and IRS-1 in insulin-stimulated 3T3-L1 adipocytes treated with the control medium, EC/GFP-CM or EC/TERF2DN-CM. Non-repeated ANOVA with post hoc analysis of Fisher’s PLSD was used for statistical analysis. Data are presented as mean ± s.e. *P < 0.05, **P < 0.01, and ****P < 0.0001. Bars: 100 μm. Source data are provided as a Source Data file.
Fig. 3
Fig. 3. Senescent EC impairs adipocyte functions by inducing oxidative stress.
a Superoxide was detected (as red fluorescence) in 3T3-L1 adipocytes treated with the control medium, or CM derived from proliferating young or replicative senescent EC. b Superoxide was detected in 3T3-L1 adipocytes treated with the control medium, or CM derived from control ECs (EC/GFP-CM) or premature senescent ECs (EC/TERF2DN-CM). c CDK inhibitor expression in 3T3-L1 adipocytes treated with the indicated EC-CM in the presence or absence of βNMN or NAC (n = 4 biologically independent samples each). A two-tailed Student’s t test was used for difference evaluation between the two groups. Data are presented as mean ± s.e. *P < 0.05, **P < 0.01, and #not significant. d SA-β-Gal staining in 3T3-L1 adipocytes treated with the indicated EC-CM in the presence or absence of βNMN or NAC. e Immunoblotting for the insulin signal pathway and IRS-1 in insulin-stimulated 3T3-L1 adipocytes treated with the indicated EC-CM in the presence or absence of βNMN or NAC. Bars: 100 μm. Source data are provided as a Source Data file.
Fig. 4
Fig. 4. Generation of EC-specific progeroid mice.
a CDK inhibitor expression in EC and non-EC isolated from the lung and WAT of WT or Tie2-TERF2DN-Tg mice (line #16) (n = 6 biologically independent samples for WT; n = 5 biologically independent samples for Tg). b SASP factor expression in EC and non-EC isolated from the WAT of WT or Tie2-TERF2DN-Tg mice (line #16) (n = 6 biologically independent samples each). c SA-β-Gal staining in EC and non-EC isolated from the lung of WT or Tie2-TERF2DN-Tg mice (line #16). SA-β-Gal-positive cells were counted (n = 5 biologically independent samples each). d EC and non-EC were isolated from the lung of young (7W) or aged (70W) mice. Cells were stained with SA-β-Gal, and staining-positive cells were counted (n = 6 biologically independent samples each). e Principalcomponent analysis for gene expression profiles assessed by DNA microarray in ECs isolated from the lung of young WT (7W), aged WT (70W), or Tie2-TERF2DN-Tg mice (20-week old). A two-tailed Student’s t test was used for difference evaluation between the two groups (ad). Data are presented as mean ± s.e. *P < 0.05, **P < 0.01, and ****P < 0.0001. Bars: 100 μm. Source data are provided as a Source Data file.
Fig. 5
Fig. 5. EC-specific progeria impairs systemic metabolic health.
a Body weight of WT or Tie2-TERF2DN-Tg (line #16) mice fed normal chow (NC) (n = 7 biologically independent animals for WT; n = 6 biologically independent animals for Tg). b, c Body weight (b) and body fat ratio (c) in WT or Tie2-TERF2DN-Tg mice fed NC at the age of 20 weeks old (n = 7 biologically independent animals for WT; n = 5 biologically independent animals for Tg). d Insulin tolerance test (ITT) in WT or Tie2-TERF2DN-Tg mice fed NC at the age of 20 weeks old (n = 7 biologically independent animals for WT; n = 6 biologically independent animals for Tg). e CDK inhibitor expression in mature adipocytes (MA) isolated from the WAT of WT or Tie2-TERF2DN-Tg mice (n = 6 biologically independent samples for WT; n = 5 biologically independent samples for Tg). f SA-β-Gal staining of subcutaneous (sWAT) or visceral epididymal WAT (eWAT) isolated from WT or Tie2-TERF2DN-Tg mice. g Immunoblotting for IRS-1 in the WAT isolated from WT or Tie2-TERF2DN-Tg mice (n = 7 biologically independent samples each). h Immunoblotting for the insulin signal pathway in the WAT, liver, and skeletal muscle of NC-fed WT or Tie2-TERF2DN-Tg mice with or without insulin treatment. A two-tailed Student’s t test was used for difference evaluation between the two groups (be, g). Data are presented as mean ± s.e. *P < 0.05, **P < 0.01, ***P < 0.001, and ****P< 0.0001. Source data are provided as a Source Data file.
Fig. 6
Fig. 6. EC-specific progeroid mice are metabolically healthy at the age of 10-week old.
a ITT in WT or Tie2-TRF2DN-Tg mice fed normal chow at the age of 10-week old (n = 7 biologically independent animals for WT; n = 5 biologically independent animals for Tg). b CDK inhibitor expression in stromal vascular fraction (SVF) or mature adipocytes (MA) isolated from WAT of WT or Tie2-TRF2DN-Tg mice at the age of 10-week old (n = 10 biologically independent samples each). c CDK inhibitor expression in ECs isolated from lung (n = 15 biologically independent samples for WT; n = 10 biologically independent samples for Tg), and WAT (n = 13 biologically independent samples for WT; n = 10 biologically independent samples for Tg) of WT or Tie2-TRF2DN-Tg mice at the age of 10-week old. d SA-β-Gal staining in EC and non-EC isolated from the lung of WT or Tie2-TRF2DN-Tg mice at the age of 10-week old. Bars: 100 μm. SA-β-Gal-positive cells were counted (n = 6 independent fields each). A two-tailed Student’s t test was used for difference evaluation between the two groups (bd). Data are presented as mean ± s.e. *P < 0.05, ***P < 0.001, and ****P < 0.0001. Source data are provided as a Source Data file.
Fig. 7
Fig. 7. EC senescence impairs metabolic health by enhancing adipocyte oxidative stress.
a Immunostaining for the 8-OHdG in the WAT of WT or Tie2-TERF2DN-Tg mice at the age of 20 weeks old. b ITT in WT or Tie2-TERF2DN-Tg mice with or without NAC treatment for 10 weeks beginning at 10-week old (n = 6 biologically independent animals for WT; n = 5 biologically independent animals for Tg). c CDK inhibitor expression in the WAT of control (vehicle-treated, n = 9 biologically independent samples for WT; n = 8 biologically independent samples for Tg) or NAC-treated (n = 5 biologically independent samples each) WT or Tie2-TERF2DN-Tg mice. Non-repeated ANOVA with post hoc analysis of Fisher’s PLSD was used for difference evaluation between the groups. d Immunostaining for the 8-OHdG in the WAT of WT or Tie2-TERF2DN-Tg mice treated with either vehicle or NAC. e Inflammatory gene expression in the WAT of control (vehicle-treated, n = 9 biologically independent samples for WT; n = 8 biologically independent samples for Tg) or NAC-treated (n = 5 biologically independent samples each) WT or Tie2-TERF2DN-Tg mice. A two-tailed Student’s t test was used for difference evaluation between the two groups (c, e). Data are presented as mean ± s.e. *P < 0.05, **P < 0.01, ***P < 0.001, ****P < 0.0001 and #not significant. Bars: 100 μm. Source data are provided as a Source Data file.
Fig. 8
Fig. 8. EC senescence impairs metabolic health through the SASP.
a ITT in recipient WT or Tie2-TERF2DN-Tg mice harboring BM of WT or Tg mice (n = 20 biologically independent animals for WT>WT group; n = 9 biologically independent animals for Tg>WT group; n = 9 biologically independent animals for WT>Tg group). b CDK inhibitor expression in the WAT isolated from recipient WT or Tie2-TERF2DN-Tg mice harboring BM of WT or Tg mice (n = 13 biologically independent samples for WT>WT group; n = 5 biologically independent samples for Tg>WT group; n = 6 biologically independent samples for WT>Tg group). c ITT in the recipient WT or Tie2-TERF2DN-Tg mice whose circulation was shared with WT (recipient–donor; WT–WT, n = 9 biologically independent animals) or Tie2-TERF2DN-Tg mice (n = 9 biologically independent animals for WT-Tg group; n = 6 biologically independent animals for Tg–Tg group). d ITT in the donor WT or Tie2-TERF2DN-Tg mice whose circulation was shared with WT (WT–WT, n = 12 biologically independent animals) or Tie2-TERF2DN-Tg mice (n = 7 biologically independent animals for WT-Tg group; n = 6 biologically independent animals for Tg–Tg group). Non-repeated ANOVA with post hoc analysis of Fisher’s PLSD was used for difference evaluation between the groups (ad). Data are presented as mean ± s.e. *P < 0.05, **P < 0.01, ***P < 0.001, and ****P < 0.0001. Source data are provided as a Source Data file.
Fig. 9
Fig. 9. IL-1a orchestrates senescence-associated cytokine networks in EC.
a IL-1a concentration in culture medium derived from young or replicative senescent EC in the presence or absence of inflammasome activators, such as monosodium urate crystal (MSU, 200 or 400 μg/mL) and adenosine triphosphate (ATP, 2.5 or 5 mM) (n = 4 biologically independent samples for young; n = 3 biologically independent samples for senescent EC). b FACS analysis of cell-surface IL-1a in ECs isolated from the lung of young (7W) or aged (70W) mice (n = 6 biologically independent samples each). A two-tailed Student’s t test was used for difference evaluation between the two groups. c SASP factor expression in young or replicative senescent EC in the presence or absence of IL-1 receptor antagonist (n = 6 biologically independent samples each). d CDK inhibitor expression in 3T3-L1 adipocytes treated with the conditioned medium derived from young or replicative senescent EC with or without IL-1 receptor antagonist treatment (n = 6 biologically independent samples each). e CDK inhibitor expression in young control EC (GFP), premature senescent EC (TERF2DN), or premature senescent EC transfected with IL-1a siRNA (n = 4 biologically independent samples each). f SASP factor expression in young control EC (GFP), premature senescent EC (TERF2DN), or premature senescent EC transfected with IL-1a siRNA (n = 4 biologically independent samples each). Non-repeated ANOVA with post hoc analysis of Fisher’s PLSD was used for difference evaluation between the groups (a, cf). Data are presented as mean ± s.e. *P < 0.05, **P < 0.01, ***P < 0.001, ****P < 0.0001 and #not significant. Source data are provided as a Source Data file.

References

    1. Fink RI, Kolterman OG, Griffin J, Olefsky JM. Mechanisms of insulin resistance in aging. J. Clin. Investig. 1983;71:1523–1535. doi: 10.1172/JCI110908. - DOI - PMC - PubMed
    1. Palmer AK, et al. Cellular senescence in type 2 diabetes: a therapeutic opportunity. Diabetes. 2015;64:2289–2298. doi: 10.2337/db14-1820. - DOI - PMC - PubMed
    1. Niccoli T, Partridge L. Ageing as a risk factor for disease. Curr. Biol. 2012;22:R741–R752. doi: 10.1016/j.cub.2012.07.024. - DOI - PubMed
    1. Laurent S. Defining vascular aging and cardiovascular risk. J. Hypertens. 2012;30(Suppl):S3–S8. doi: 10.1097/HJH.0b013e328353e501. - DOI - PubMed
    1. Cines DB, et al. Endothelial cells in physiology and in the pathophysiology of vascular disorders. Blood. 1998;91:3527–3561. - PubMed

Publication types

MeSH terms