. 2020 Jan 24;11(1):471.
doi: 10.1038/s41467-020-14378-x.

Distinct temporal integration of noradrenaline signaling by astrocytic second messengers during vigilance

Affiliations

Distinct temporal integration of noradrenaline signaling by astrocytic second messengers during vigilance

Yuki Oe et al. Nat Commun. .

Erratum in

Abstract

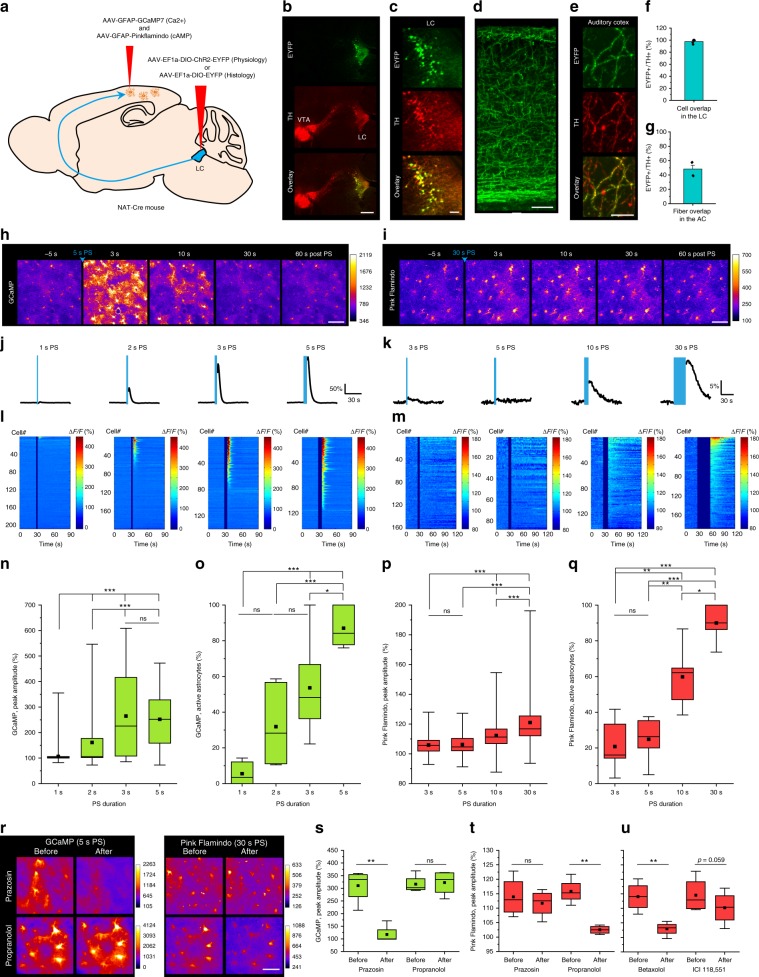
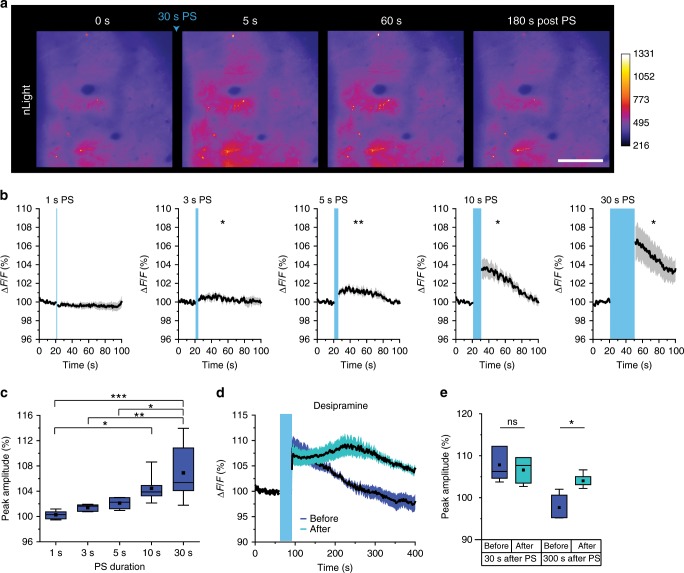
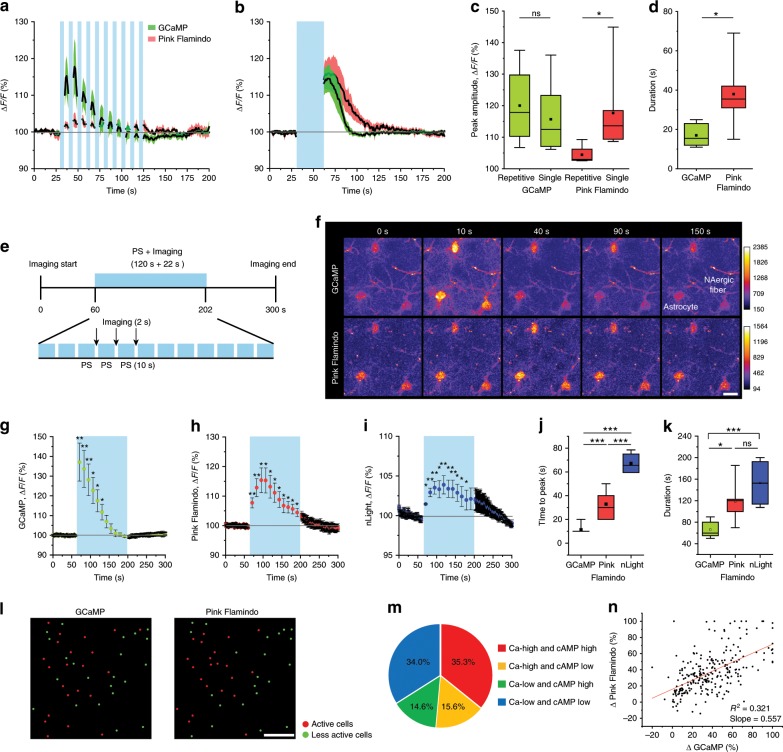
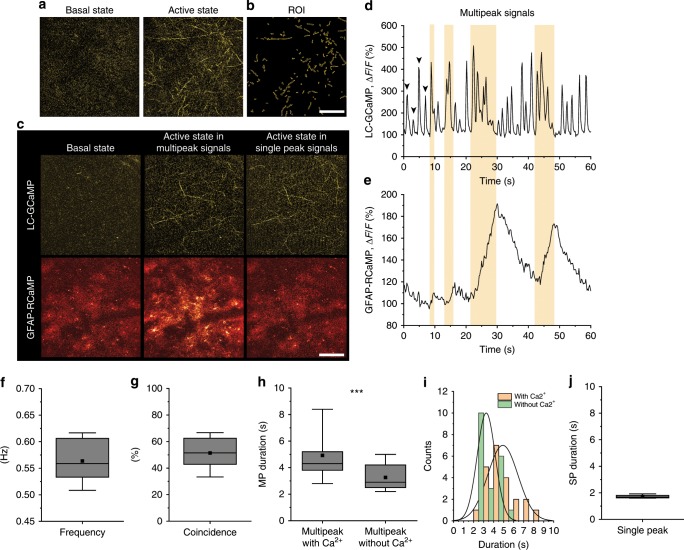
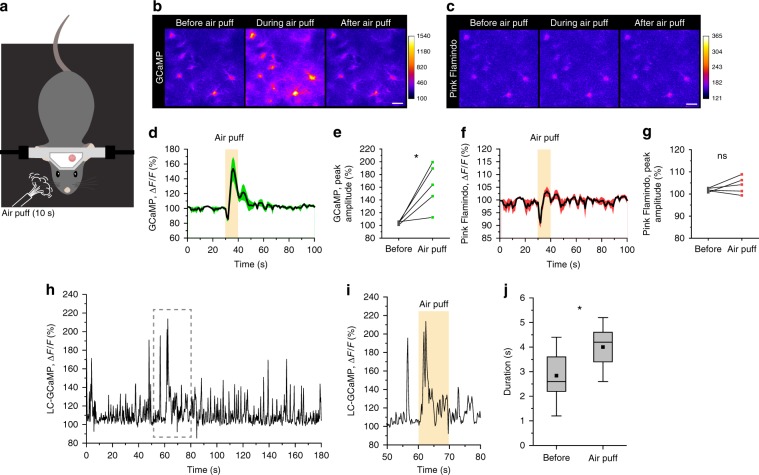
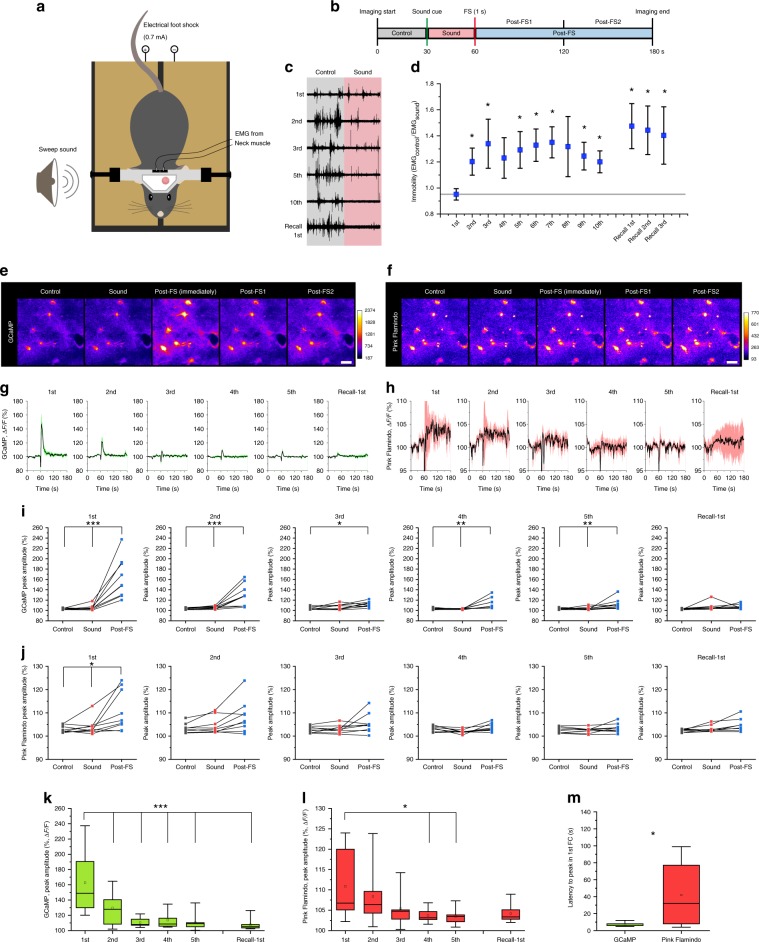
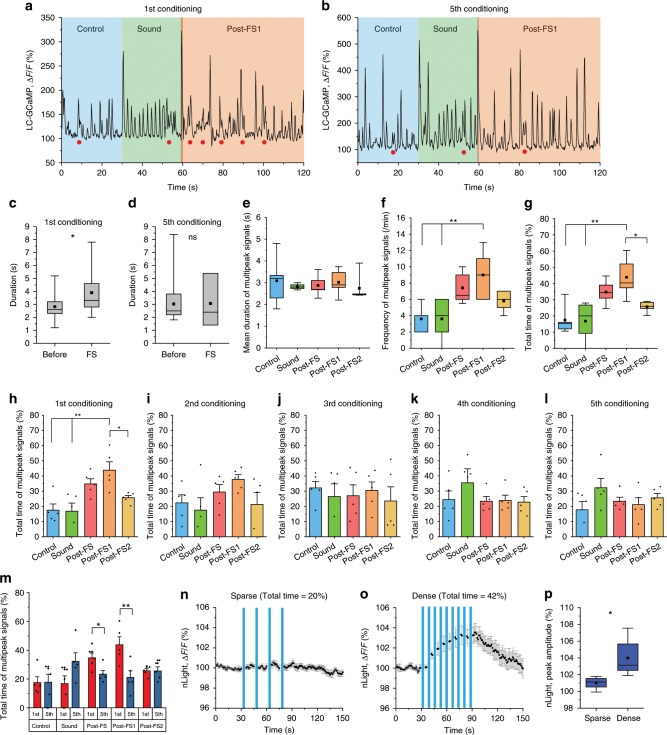
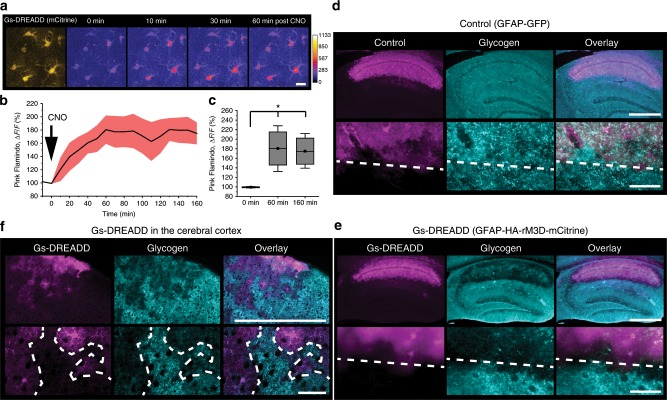
Astrocytes may function as mediators of the impact of noradrenaline on neuronal function. Activation of glial α1-adrenergic receptors triggers rapid astrocytic Ca2+ elevation and facilitates synaptic plasticity, while activation of β-adrenergic receptors elevates cAMP levels and modulates memory consolidation. However, the dynamics of these processes in behaving mice remain unexplored, as do the interactions between the distinct second messenger pathways. Here we simultaneously monitored astrocytic Ca2+ and cAMP and demonstrate that astrocytic second messengers are regulated in a temporally distinct manner. In behaving mice, we found that while an abrupt facial air puff triggered transient increases in noradrenaline release and large cytosolic astrocytic Ca2+ elevations, cAMP changes were not detectable. By contrast, repeated aversive stimuli that lead to prolonged periods of vigilance were accompanied by robust noradrenergic axonal activity and gradual sustained cAMP increases. Our findings suggest distinct astrocytic signaling pathways can integrate noradrenergic activity during vigilance states to mediate distinct functions supporting memory.


Conflict of interest statement

The authors declare no competing interests.

Figures

Fig. 1
Fig. 1. Ca2+ and cAMP responses of cortical astrocytes to noradrenergic afferent activation.
a Illustration of virus injections. This image was adapted from Allen Mouse Brain Atlas. b EYFP in LC neurons 3 weeks after AAV delivery (green). LC is visualized by tyrosine hydroxylase (TH) immunohistochemistry (red). VTA: ventral tegmental area. c Magnified images of LC. d Innervation of LC NAergic neurons in the cerebral cortex. e EYFP-labeled LC-neuronal NAergic fibers overlap with TH+ fibers in the cortex. f Virtually all TH+ cells express EYFP in the LC (n = 5 images, 5 mice). g Unilateral AAV microinjection to the LC labels 50% of TH+ fibers in the cortex (n = 4 images, 3 mice). h, i Astrocytic Ca2+ and cAMP responses to optogenetically activated NAergic axons in the cortex with 5-s PS (h) and 30-s PS (i). j, k Average Ca2+ and cAMP responses of cortical astrocytes to varying NAergic fiber photostimulation (PS) length. l, m Individual cell responses are plotted and sorted by response amplitude. n, o Astrocytic Ca2+ activity analyzed by peak amplitude (n) (n = 208, 194, 139 cells, 144 cells) and active astrocytes (o) (n = 6–7 sessions, 5 mice). p, q Astrocytic cAMP activity analyzed by peak amplitude (p) (n = 161, 87, 142, 186 cells) and active astrocytes (q) (n = 5–6 sessions, 6 mice). ru Pharmacological dissection of LC/NA axon-evoked astrocytic Ca2+ and cAMP. Representative images of GCaMP and Pink Flamindo with prazosin or propranolol application (r). Comparison of GCaMP (s) and Pink Flamindo (t) signals after prazosin or propranolol application. Pink Flamindo responses after betaxolol or ICI 118,551 application (u) (n = 4 mice for all plots). Analysis was performed from individual cells for n and p and from averages of individual sessions for the others. All astrocyte responses represent somatic signals hereinafter unless otherwise noted. Scale bars: b, 500 μm; c, d, h, i, 100 μm; r, 50 μm; e, 10 μm. Bar graphs: mean + SEM. Box plots: box range, 25–50–75% quatile; square, mean; whiskers, max–min. One-way ANOVA with Turkey’s test: nq; paired t-test: su; *p < 0.05, **p < 0.01, ***p < 0.001.
Fig. 2
Fig. 2. LC/NA-driving PS duration is highly correlated with extracellular NA concentration in the cerebral cortex.
a Representative cortical images of nLight before and after 30-s LA/NA axon PS. Scale bar: 100 μm. b nLight responses by varying PS duration. Asterisks indicate significant differences of peak amplitude after PS compared with the basal signal (n = 5–6 sessions, 4 mice). c Comparison of peak nLight response amplitude for the data in b (n = 5–6 sessions, 4 mice). d, e nLight signals before and after desipramine injection (NA reuptake inhibitor, 10 mg/kg, i.p. 30 min before imaging). Traces represent mean ± SEM (d). Peak amplitude was quantified at 30 and 300 s after PS (e, n = 5 sessions, 4 mice). Analysis was performed from the average of individual sessions. Box plots: box range, 25–50–75% quatile; square, mean; whiskers, max–min. One-way ANOVA with Turkey’s test: c; paired t-test: b, d; *p < 0.05, **p < 0.01, ***p < 0.001.
Fig. 3
Fig. 3. Distinct dynamics of astrocytic Ca2+ and cAMP.
ad Simultaneous imaging of GCaMP and Pink Flamindo with repetitive [3 s × 10, 7 s inter-stimulus interval] (a) and continuous [30 s] (b) PS. The peak amplitude of Pink Flamindo differs substantially between the two PS paradigms, whereas GCaMP shows similar peak amplitudes (n = 4–7 sessions, 4–6 mice) (c). Durations of astrocytic Ca2+ and cAMP responses to 30-s PS are distinct (d) (n = 6 sessions, 4 mice). ek 120-s PS of NAergic fibers. The long-time stimulation of NAergic fibers consists of 10-s PS and 2-s imaging that repeats 12 times (e). GCaMP signals show faster response and shorter duration (f, g), and Pink Flamindo signals exhibit slower increase and long-lasting duration (f, h). The dynamics of extracellular NA similarly long with that of astrocytic cAMP (i). Quantification of time to peak (j, n = 4–8 sessions, 4–6 mice) and duration (k, n = 4–8 sessions, 4–6 mice). Scale bar: 20 μm. ln GCaMP and Pink Flamindo responses classified into active cells and less active cells (l). Red and green circles indicate active and less active cells, respectively. Combinatorial classification of GCaMP and Pink Flamindo responsiveness (m). Correlation of GCaMP signal changes and Pink Flamindo signal changes (n, n = 249 cells, 7 mice, Pearson correlation; R2 = 0.32, slope = 0.557). Scale bar: 100 μm. Analysis was performed from average of individual sessions in ak. ln were analyzed from individual cell responses. Box plots: box range, 25–50–75% quatile; square, mean; whiskers, max–min. Student’s t-test with Welch’s correction: c, d; one-way ANOVA with Turkey’s test: c; paired t-test: j, k; *p < 0.05, **p < 0.01, ***p < 0.001.
Fig. 4
Fig. 4. Astrocytic Ca2+ signals are accompanied by NAergic multipeak signals in awake spontaneous states.
a, b Representative images of a basal state and an active state of NAergic fibers’ Ca2+ levels visualized by GCaMP6.f (a) and ROIs (b). Scale bar: 100 μm. c Representative pictures of LC-GCaMP and GFAP-RCaMP. Note that the GFAP-RCaMP images were acquired with a 5-s delay from the respective LC-GCaMP images. Only active states with MP signals accompany astrocytic Ca2+ elevation. Scale bar: 100 μm. d, e One minute simultaneous recording of LC-GCaMP and GFAP-RCaMP. NAergic signals are composed of SP signals (arrowhead) and MP signals (yellow period) (d). Astrocytic Ca2+ is correlated with NAergic MP signals (e). f Frequency of combined single and MP events. Individual MP signals were counted as single events (n = 1276 s recording, five mice for all analyses). g Coincidence of astrocytic Ca2+ with NAergic MP signals. h, i Durations of divided multipeak signals testing whether they accompany astrocytic Ca2+ are plotted in box plot (h) and histogram (i). j Durations of SP signals. Analysis was performed from individual SP or MP signals. Box plots: box range, 25–50–75% quatile; square, mean; whiskers, max–min. Student’s t-test with Welch’s correction: h; ***p < 0.001.
Fig. 5
Fig. 5. Startle by abrupt air-puff stimulation induces astrocytic Ca2+ elevations and LC/NA axon multipeak Ca2+ signals without a cAMP surge.
a Illustration of air-puff stimulation under two-photon microscopy. b, d, e Astrocytes show clear Ca2+ elevations by facial air-puff stimulation (b). Air puffs presented for 10 s induce significant Ca2+ increases (d, e; n = 5 sessions, 3 mice). c, f, g Astrocytes do not show detectable cAMP signal changes by air puff (n = 5 sessions, 3 mice). h, i Ca2+ activity of LC/NA axons in the cortex was imaged for 3 min (h). The period during air puff was magnified (i), which shows a clear MP signal. j Duration of multipeak signals between before air puff (0–60 s) and during air puff (60–70 s) (n = 4 sessions, 4 mice). Scale bars 20 μm. Analysis was performed from average of individual sessions in e and g and from individual MP signals in j. Box plots: box range, 25–50–75% quatile; square, mean; whiskers, max–min. paired t-test: e; Student’s t-test with Welch’s correction: j; *p < 0.05.
Fig. 6
Fig. 6. High vigilance in head-fixed fear conditioning induces astrocytic Ca2+ and cAMP elevations.
a Illustration of head-fixed fear conditioning apparatus. b Protocol of head-fixed fear conditioning. c Representative EMG recording from neck muscles before and during sound cue. d Immobility index calculated by the ratio of EMG magnitudes before and during sound is plotted for each conditioning and recall session (n = 8 mice). e, f. Representative images of GCaMP (e) and Pink Flamindo (f) in astrocytes during the 1st conditioning. Images are averaged images of last 5 s from each phases except for post-FS (immediately). Post-FS (immediately) was averaged images of 3–7 s after PS (highest Ca2+). Scale bars: 20 μm. g, h Traces of mean ± SEM of GCaMP (g) and Pink Flamindo (h) in astrocytes for 1st–5th conditionings and 1st recall. i, j Peak amplitude of astrocyte GCaMP (i) (n = 9 mice for all analyses) and Pink Flamindo (j) in control, sound, and post-FS phase in 1–5th conditionings and 1st recall. k, l Comparison of peak amplitude in the post-FS phase of GCaMP (k) among 1–5th conditionings and 1st recall. m Latency to peak in the 1st conditioning shows a distinct difference between astrocytic Ca2+ and cAMP dynamics. Analysis was performed from the average of individual sessions. Box plots: box range, 25–50–75% quatile; square, mean; whiskers, max–min. Paired t-test (vs. 1st): d; one-way ANOVA with Turkey’s test: il; Student’s t-test with Welch’s correction: m; *p < 0.05, **p < 0.01, ***p < 0.001.
Fig. 7
Fig. 7. Head-fixed fear conditioning increases NAergic multipeak signals in 1st conditioning.
a, b Sample traces of NAergic fibers’ Ca2+ activity in 1st conditioning (a) and 5th conditioning (b). Filled red circles indicate MP signals. c, d Duration of multipeak signals were analyzed between before FS (0–60 s) and immediately after FS (60–70 s). Significant increase of duration was observed in the 1st conditioning, but disappeared in the 5th conditioning (n = 5 sessions, 5 mice). eg Quantifications of NAergic multipeak signals: mean duration (e) (n = 5 mice for all analyses), frequency (f), and total time (g). hl Total times of MP signals in 1–5th conditionings are shown. Post-FS1 has significantly longer total time only during 1st conditioning. 1st (h), 2nd (i), 3rd (j), 4th (k), and 5th conditioning (l). m Comparison of each conditioning session between 1st and 5th conditioning. Increased total time of post-FS, particularly post-FS1, in 1st conditioning disappear in 5th conditioning. np mimicking NAergic fiber activation during the head-fixed fear conditioning show that dense PS (o, p total time = 42%, corresponding to post-FS1 phase) significantly increases the extracellular NA concentration than sparse PS (n, p total time = 20%, correspond to control phase; n = 6 sessions, 4 mice). Analysis was performed from individual MP signals in c and d and average of individual sessions for other graphs. Bar graphs: mean + SEM. Box plots: box range, 25–50–75% quatile; square, mean; whiskers, max–min. Student’s t-test with Welch’s correction: c, d, p; one-way ANOVA with Turkey’s test: fh; paired t-test: m; *p < 0.05, **p < 0.01.
Fig. 8
Fig. 8. Chemogenetic elevation of astrocytic cAMP induces glycogen breakdown.
a Representative images of Gs-DREADD with mCitrine (yellow) and Pink Flamindo (pseudocolor) with CNO injection (1 mg/kg, i.p.). Pink Flamindo and Gs-DREADD (rM3D) were expressed in cortical astrocytes by co-injection of the respective AAVs. Scale bars: 20 µm. b, c Time course of Pink Flamindo signal change (b). Comparison of Pink Flamindo signal shows that the effect of Gs-DREADD lasts at least 160 min (c) (n = 4 mice, one-way ANOVA, p = 0.0087: Tukey’s test,*p < 0.05). df Glycogen immunohistochemistry on control (GFAP-GFP) (d) and Gs-DREADD (GFAP-HA-rM3D-mCitrine) in the hippocampus (e) and in the cortex (f) fixed 120 min after CNO injection. Lower images are high magnification of the upper images. White dash lines indicate the border of virus infection. Scale bars: 500 µm (upper) and 50 µm (lower). Analysis was performed from average of individual sessions. Box plots: box range, 25–50–75% quatile; square, mean; whiskers, max–min. One-way ANOVA with Turkey’s test: c; *p < 0.05.

References

    1. Cornell-Bell AH, Finkbeiner SM, Cooper MS, Smith SJ. Glutamate induces calcium waves in cultured astrocytes: long-range glial signaling. Science. 1990;247:470–473. doi: 10.1126/science.1967852. - DOI - PubMed
    1. Araque A, et al. Gliotransmitters travel in time and space. Neuron. 2014;81:728–739. doi: 10.1016/j.neuron.2014.02.007. - DOI - PMC - PubMed
    1. Bekar LK, He W, Nedergaard M. Locus coeruleus alpha-adrenergic-mediated activation of cortical astrocytes in vivo. Cereb. Cortex. 2008;18:2789–2795. doi: 10.1093/cercor/bhn040. - DOI - PMC - PubMed
    1. Takata N, et al. Astrocyte calcium signaling transforms cholinergic modulation to cortical plasticity in vivo. J. Neurosci. 2011;31:18155–18165. doi: 10.1523/JNEUROSCI.5289-11.2011. - DOI - PMC - PubMed
    1. Navarrete M, et al. Astrocytes mediate in vivo cholinergic-induced synaptic plasticity. PLoS Biol. 2012;10:e1001259. doi: 10.1371/journal.pbio.1001259. - DOI - PMC - PubMed

Publication types