Randomized Controlled Trial
. 2020 Jan 24;10(1):1157.
doi: 10.1038/s41598-020-57979-8.

Nutrimetabolomics reveals food-specific compounds in urine of adults consuming a DASH-style diet

Affiliations
Randomized Controlled Trial

Nutrimetabolomics reveals food-specific compounds in urine of adults consuming a DASH-style diet

Nichole A Reisdorph et al. Sci Rep. .

Abstract

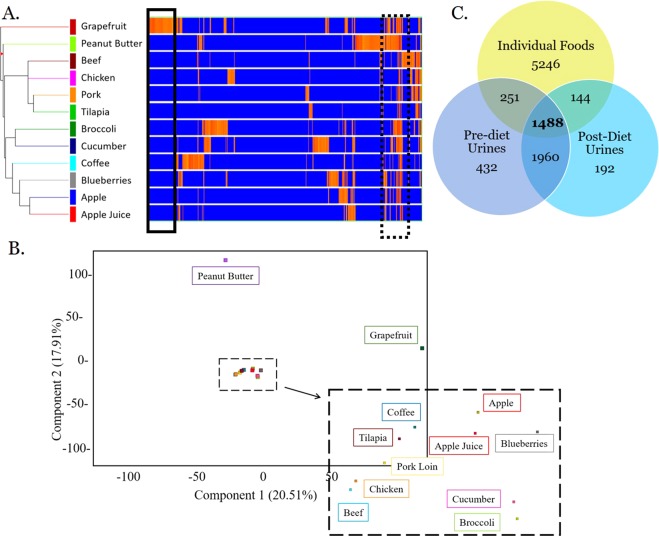
Although health benefits of the Dietary Approaches to Stop Hypertension (DASH) diet are established, it is not understood which food compounds result in these benefits. We used metabolomics to identify unique compounds from individual foods of a DASH-style diet and determined if these Food-Specific Compounds (FSC) are detectable in urine from participants in a DASH-style dietary study. We also examined relationships between urinary compounds and blood pressure (BP). Nineteen subjects were randomized into 6-week controlled DASH-style diet interventions. Mass spectrometry-based metabolomics was performed on 24-hour urine samples collected before and after each intervention and on 12 representative DASH-style foods. Between 66-969 compounds were catalogued as FSC; for example, 4-hydroxydiphenylamine was found to be unique to apple. Overall, 13-190 of these FSC were detected in urine, demonstrating that these unmetabolized food compounds can be discovered in urine using metabolomics. Although linear mixed effects models showed no FSC from the 12 profiled foods were significantly associated with BP, other endogenous and food-related compounds were associated with BP (N = 16) and changes in BP over time (N = 6). Overall, this proof of principle study demonstrates that metabolomics can be used to catalog FSC, which can be detected in participant urine following a dietary intervention.


Conflict of interest statement

The authors declare no competing interests.

Figures

Figure 1
Figure 1
Relationship between individual foods and urine samples visualized using hierarchical clustering (A), PCA (B), and Venn (C). Following metabolomics analysis, a variety of visualization techniques were applied to the dataset. (A) Hierarchical clustering of data from all 12 individual foods. The x-axis corresponds to individual compounds detected in the foods which are listed on the y-axis. Blue lines indicate less relative abundance for that compound compared to all other foods while orange/red lines indicate higher relative abundance for that compound compared to all other foods. The vertical distance between where foods split is a rough estimation of their similarity. Solid black box indicates a region of compounds that appear to be unique to grapefruit. Dotted black box highlights a region of compounds that appear to be in common among many foods. (B) PCA was performed using data from all foods. Component 1, which explains 20.51% of the variation, is shown on the x-axis and component 2, which explains 17.91% of the variation, is shown on the y-axis. The first 4 PCs explain approximately 63% of the variation. (C) Venn diagram illustrates overlap between the 7,089 compounds detected in individual foods (green circle), the 4,091 compounds detected in pre-diet urine (grey-blue), and the 3,744 compounds detected in post-diet urine. A total of 1,488 compounds were detected in all 3 sample types. A total of 1960 compounds were detected in both pre- and post-diet urine.
Figure 2
Figure 2
Relative metabolism of food-specific compounds (FSC) detected in urine. Following analysis of food samples using LC/MS, data were analyzed to determine what compounds were FSC. The aggregate of FSC for each food was considered a food-specific-signature. The abundance values for the FSC that comprised a signature were summed and used to determine relative metabolism for each food. The graph shows the intensity of the grapefruit signature plotted over time. The table illustrates the day each food was consumed, with grapefruit, for example, being consumed on days 2 and 5. (CHX = Chicken).

References

    1. Claus SP. Development of personalized functional foods needs metabolic profiling. Curr. Opin. Clin. Nutr. Metab. care. 2014;17:567–573. doi: 10.1097/MCO.0000000000000107. - DOI - PubMed
    1. Bouchard-Mercier A, Rudkowska I, Lemieux S, Couture P, Vohl MC. The metabolic signature associated with the Western dietary pattern: a cross-sectional study. Nutr. J. 2013;12:158. doi: 10.1186/1475-2891-12-158. - DOI - PMC - PubMed
    1. Rebholz CM, Lichtenstein AH, Zheng Z, Appel LJ, Coresh J. Serum untargeted metabolomic profile of the Dietary Approaches to Stop Hypertension (DASH) dietary pattern. Am. J. Clin. Nutr. 2018;108:243–255. doi: 10.1093/ajcn/nqy099. - DOI - PMC - PubMed
    1. Acar Evrim, Gürdeniz Gözde, Khakimov Bekzod, Savorani Francesco, Korndal Sanne Kellebjerg, Larsen Thomas Meinert, Engelsen Søren Balling, Astrup Arne, Dragsted Lars O. Biomarkers of Individual Foods, and Separation of Diets Using Untargeted LC-MS-based Plasma Metabolomics in a Randomized Controlled Trial. Molecular Nutrition & Food Research. 2018;63(1):1800215. doi: 10.1002/mnfr.201800215. - DOI - PubMed
    1. Ulaszewska MM, et al. Nutrimetabolomics: An Integrative Action for Metabolomic Analyses in Human Nutritional Studies. Mol. Nutr. Food Res. 2019;63:e1800384. doi: 10.1002/mnfr.201800384. - DOI - PubMed

Publication types