Comparative Study
. 2020 Feb:30:101437.
doi: 10.1016/j.redox.2020.101437. Epub 2020 Jan 20.

Comparative analysis of the mitochondrial morphology, energy metabolism, and gene expression signatures in three types of blastocyst-derived stem cells

Affiliations
Comparative Study

Comparative analysis of the mitochondrial morphology, energy metabolism, and gene expression signatures in three types of blastocyst-derived stem cells

Joonhyuk Choi et al. Redox Biol. 2020 Feb.

Abstract

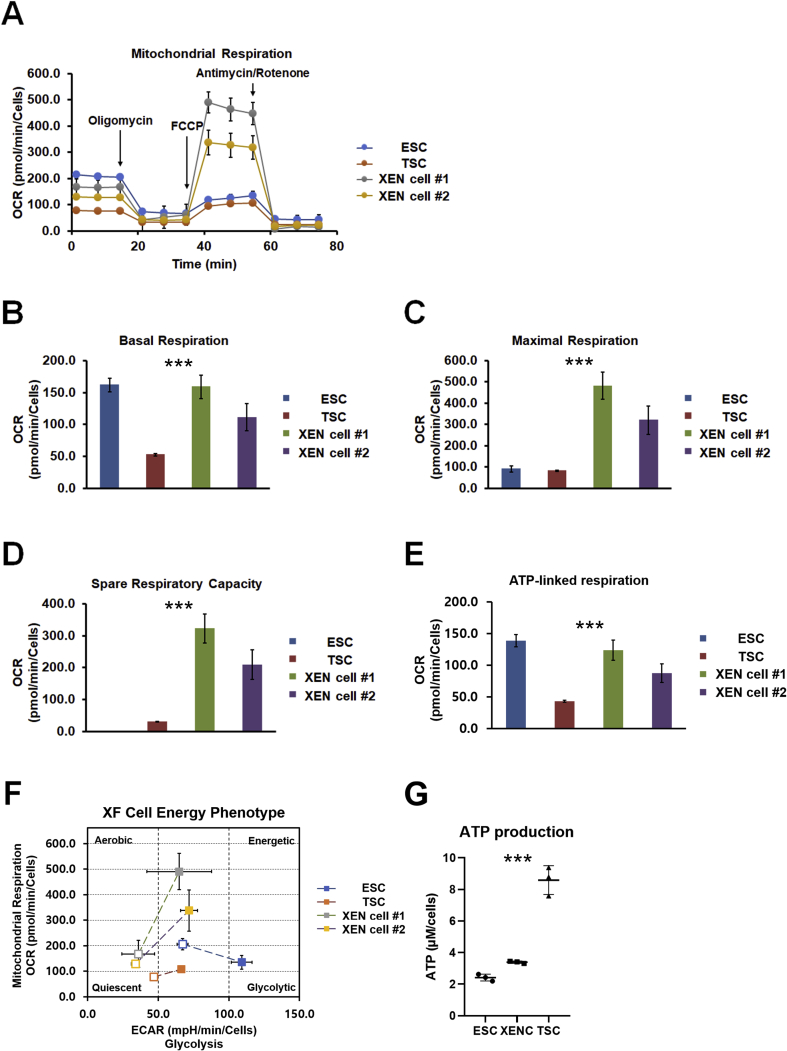
Pre-implantation mouse blastocyst-derived stem cells, namely embryonic stem cells (ESCs), trophoblast stem cells (TSCs), and extraembryonic endoderm (XEN) cells, have their own characteristics and lineage specificity. So far, several studies have attempted to identify these three stem cell types based on genetic markers, morphologies, and factors involved in maintaining cell self-renewal. In this study, we focused on characterizing the three stem cell types derived from mouse blastocysts by observing cellular organelles, especially the mitochondria, and analyzing how mitochondrial dynamics relates to the energy metabolism in each cell type. Our study revealed that XEN cells have distinct mitochondrial morphology and energy metabolism compared with that in ESCs and TSCs. In addition, by analyzing the energy metabolism (oxygen consumption and extracellular acidification rates), we demonstrated that differences in the mitochondria affect the cellular metabolism in the stem cells. RNA sequencing analysis showed that although ESCs are developmentally closer to XEN cells in origin, their gene expression pattern is relatively closer to that of TSCs. Notably, mitochondria-, mitochondrial metabolism-, transport/secretory action-associated genes were differentially expressed in XEN cells compared with that in ESCs and TSCs, and this feature corresponds with the morphology of the cells.

Keywords: Embryonic stem cells (ESCs); Extraembryonic endoderm stem cells (XEN cells); Metabolism; Mitochondria; Trophoblast stem cells (TSCs).


Conflict of interest statement

Declaration of competing interest The authors declare that they have no conflicts of interest.

Figures

Image 1
Graphical abstract
Fig. 1
Fig. 1
Derivation of embryo origin stem cells in defined conditions. (A) Representative images of embryos cultured from 2-cell stage (1.5 dpc, left side) to blastocysts (3.5–4.5 dpc, right side). Scale bars: 200 μm (B) Representative images of established stem cells derived from embryos using defined conditions. ESCs from epiblast (top), TSCs from trophectoderm (bottom) and XEN cells from primitive endoderm (middle). Scale bars: 200 μm. Student's t-test: ***p < 0.001.
Fig. 2
Fig. 2
Analysis of stem cell lineages established from blastocysts. (AC) Immunocytochemical analysis of XEN cells, TSCs, and ESCs. Scale bars: 200 μm (A) XEN cells were immunoreactive to Gata4 (red) and Sox17 (red), known as the markers of primitive endoderm, proving the primitive endodermal lineage. Nuclei were stained with DAPI (blue). (B) TSCs were stained to observe expression of Eomes (green). (C) ESCs were shown to express pluripotent markers Oct4 (green) and Nanog (red). (DG) qRT-PCR analysis of XEN cells, TSCs, and ESCs. Data are presented as mean ± SEM for n = 3 independent experiments. (D) Strong expression of Dab2, Gata6, and Pdgfra were observed in XEN cells compared with that in control ESC. (E) TSCs strongly expressed Tead4 and Cdx2, while pluripotency marker Pou5f1 expression was repressed compared to that in ESCs. (F) ESCs were analyzed with standard pluripotency marker Nanog. (G) Cell counting for comparing cell proliferation of blastocyst-derived stem cells. One-way ANOVA: ***p < 0.001. ESC, embryonic stem cells; TSC, trophoblast stem cells; XEN, extraembryonic endoderm. (For interpretation of the references to colour in this figure legend, the reader is referred to the Web version of this article).
Fig. 3
Fig. 3
Mitochondrial analysis of established stem cells. (A) Representative image of each stem cell observed through a transmission electron microscope (TEM). Nuclei (N), Endoplasmic reticulum (E), Mitochondria (M) and other organelles are observable. Scale bar: 2 μm (B) Enlarged TEM images of each stem cells focused on the mitochondria. Scale bar: 0.5 μm (C) Criteria used to analyze mitochondria morphological difference among the stem cells. (D) Quantitively analyzed mitochondrial length by using the criteria. (E) The ratio of c-Max and c-Min axes of mitochondria. Student's t-test: *p < 0.05, **p < 0.01, and ***p < 0.001. ESC, embryonic stem cells; TSC, trophoblast stem cells; XEN, extraembryonic endoderm.
Fig. 4
Fig. 4
Metabolic changes in blastocyst-derived stem cells. (A) Measurement of oxygen consumption rate (OCR) in ESC, TSC, and XEN cells. Measurement of (B) basal respiration, (C) maximal respiration, (D) spare respiratory capacity, and (E) ATP production in ESC, TSC, and XEN cells. (F) Measurement of energy phenotype in ESC, TSC, and XEN cells. The empty square shows the baseline of cell state. The filled square shows the cell state response to oxygen stress. (G) Direct measurement of ATP levels in ESC, TSC, and XEN cells. One-way ANOVA: ***p < 0.001. ESC, embryonic stem cells; TSC, trophoblast stem cells; XEN, extraembryonic endoderm.
Fig. 5
Fig. 5
RNA sequencing analysis of ESC, TSC, and XEN cells. (A) Scatterplot analysis of ESCs, TSCs, and XEN cells. (B) GO:BP analysis of enriched genes among the DEGs in ESCs, TSCs, and XEN cells. (C) Correlation matrix analysis of ESCs, TSCs, and XEN cells. (D) Heatmap of lineage-specific gene expression in ESCs, TSCs, and XEN cells. (E) Heatmap clusters of DEGs between ESCs, TSCs, and XEN cells. (F) Enlarged TEM image of swollen endoplasmic reticulum (white arrows) in XEN cell. Heatmap analyses confirmed that gene sets involved in ‘protein processing in ER’ were dramatically upregulated in XEN cells compared with that in ESCs and TSCs. Scale bar: 0.5 μm (G) Enlarged TEM image of XEN cell spurting proteins. Heatmap analyses confirmed that gene sets involved in ‘vesicle-mediated transport’ were dramatically upregulated in XEN cells compared with that in ESCs and TSCs. Scale bar: 0.5 μm. ESC, embryonic stem cells; TSC, trophoblast stem cells; XEN, extraembryonic endoderm.

References

    1. Artus J., Chazaud C. A close look at the mammalian blastocyst: epiblast and primitive endoderm formation. Cell. Mol. Life Sci. 2014;71(17):3327–3338. - PMC - PubMed
    1. Bryja V., Bonilla S., Arenas E. Derivation of mouse embryonic stem cells. Nat. Protoc. 2006;1(4):2082–2087. PubMed PMID: 17487198. - PubMed
    1. Niakan K.K., Schrode N., Cho L.T., Hadjantonakis A.K. Derivation of extraembryonic endoderm stem (XEN) cells from mouse embryos and embryonic stem cells. Nat. Protoc. 2013 Jun;8(6):1028–1041. PubMed PMID: 23640167. Pubmed Central PMCID: 3927835. - PMC - PubMed
    1. Tanaka S., Kunath T., Hadjantonakis A.-K., Nagy A., Rossant J. Promotion of trophoblast stem cell proliferation by FGF4. Science. 1998;282(5396):2072–2075. - PubMed
    1. Evans M.J., Kaufman M.H. Establishment in culture of pluripotential cells from mouse embryos. Nature. 1981;292(5819):154. - PubMed

Publication types

LinkOut - more resources