. 2020 Feb 21;23(2):100826.
doi: 10.1016/j.isci.2020.100826. Epub 2020 Jan 10.

R-Roscovitine Improves Motoneuron Function in Mouse Models for Spinal Muscular Atrophy

Affiliations

R-Roscovitine Improves Motoneuron Function in Mouse Models for Spinal Muscular Atrophy

Rocio Tejero et al. iScience. .

Abstract

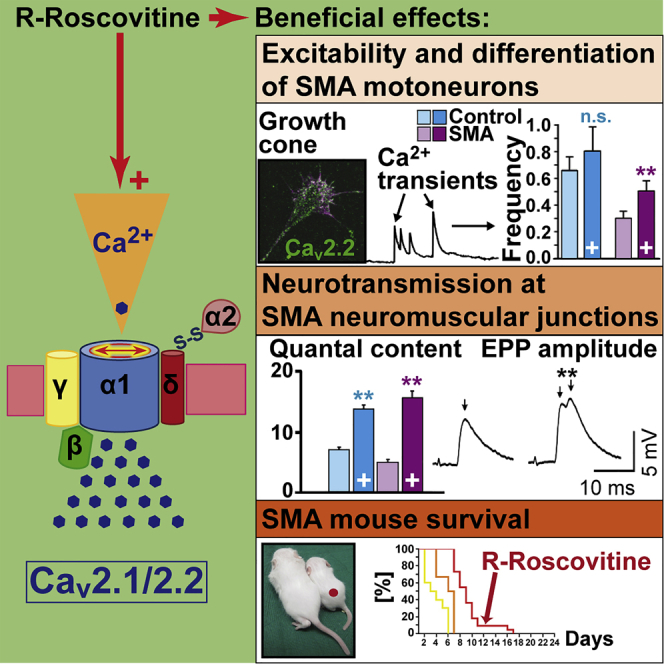
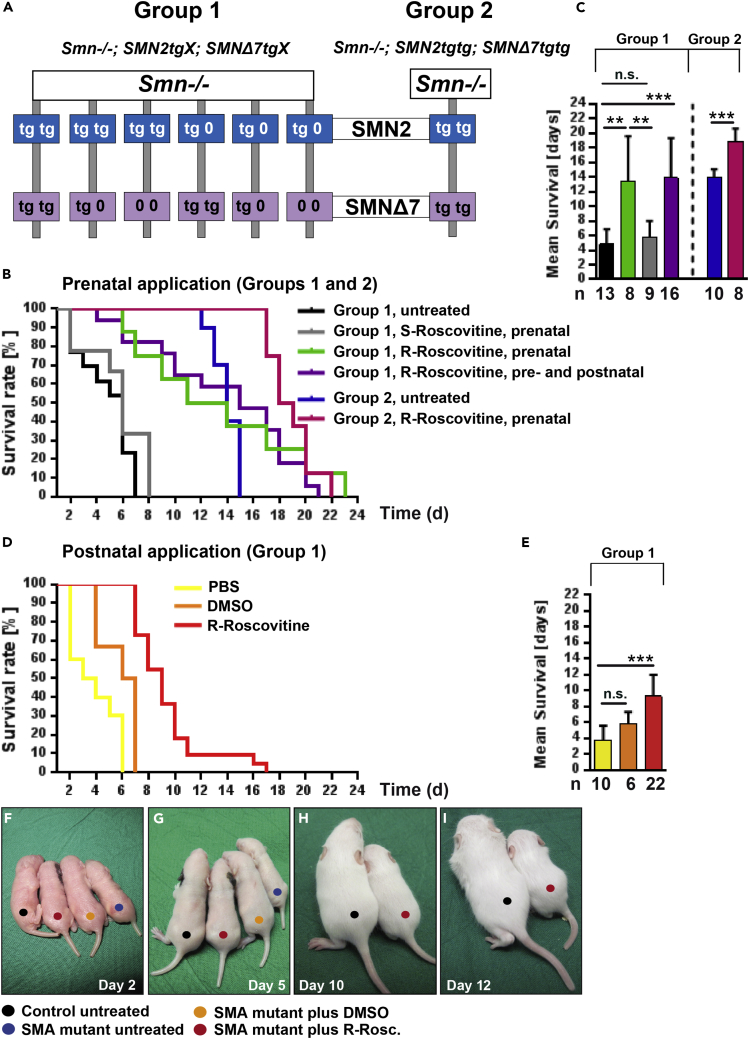
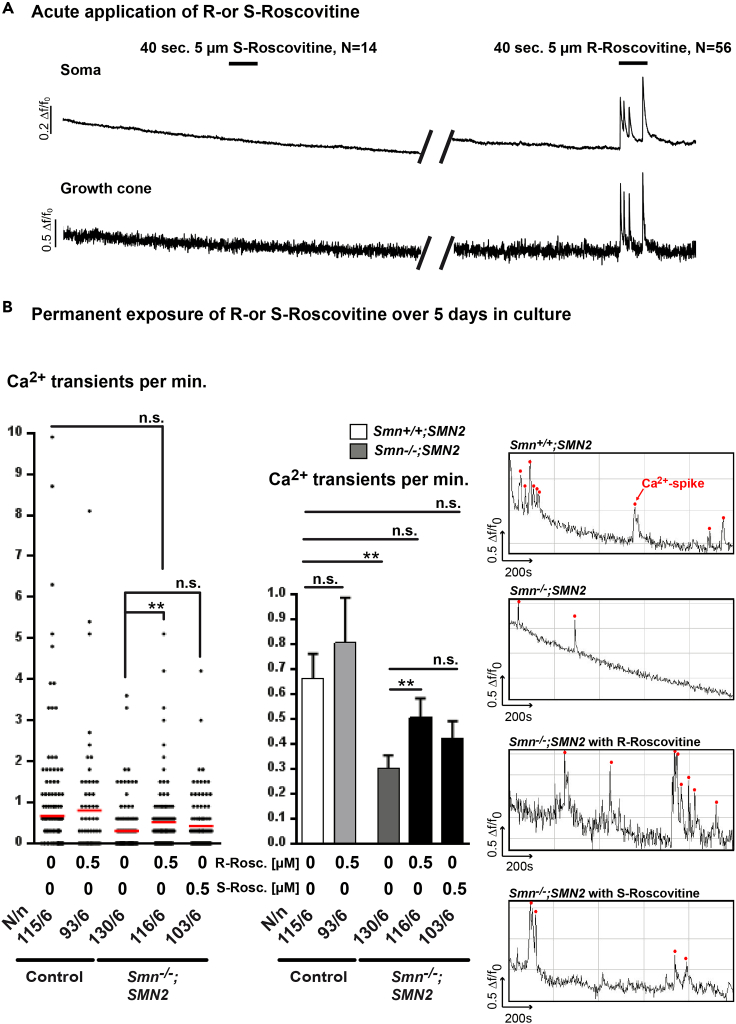
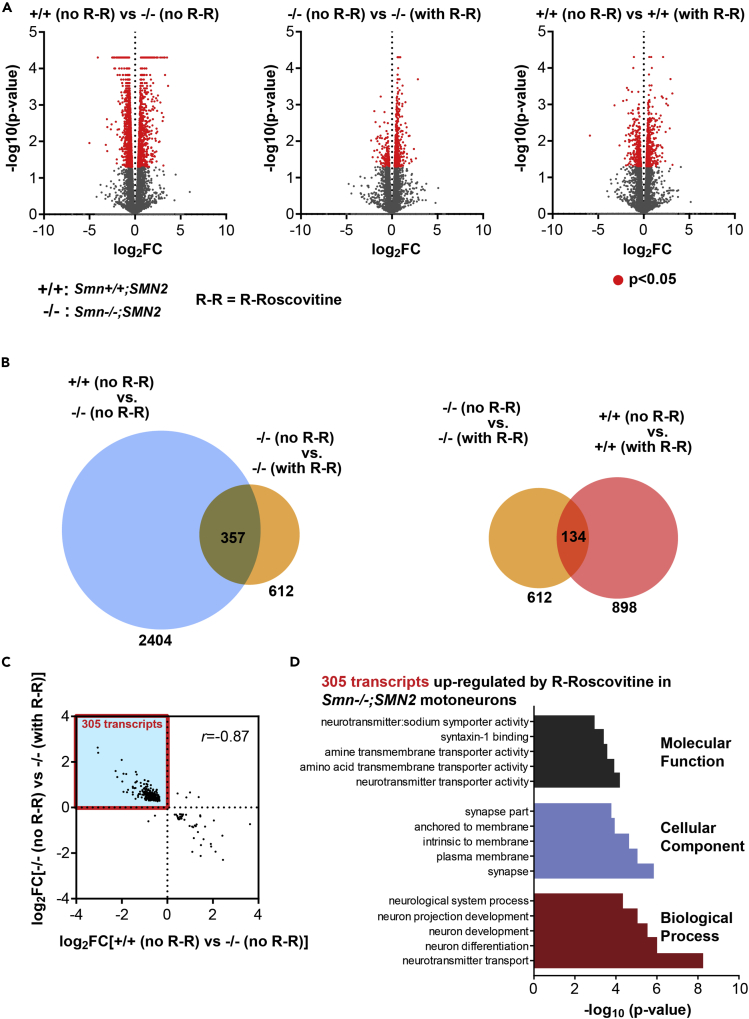
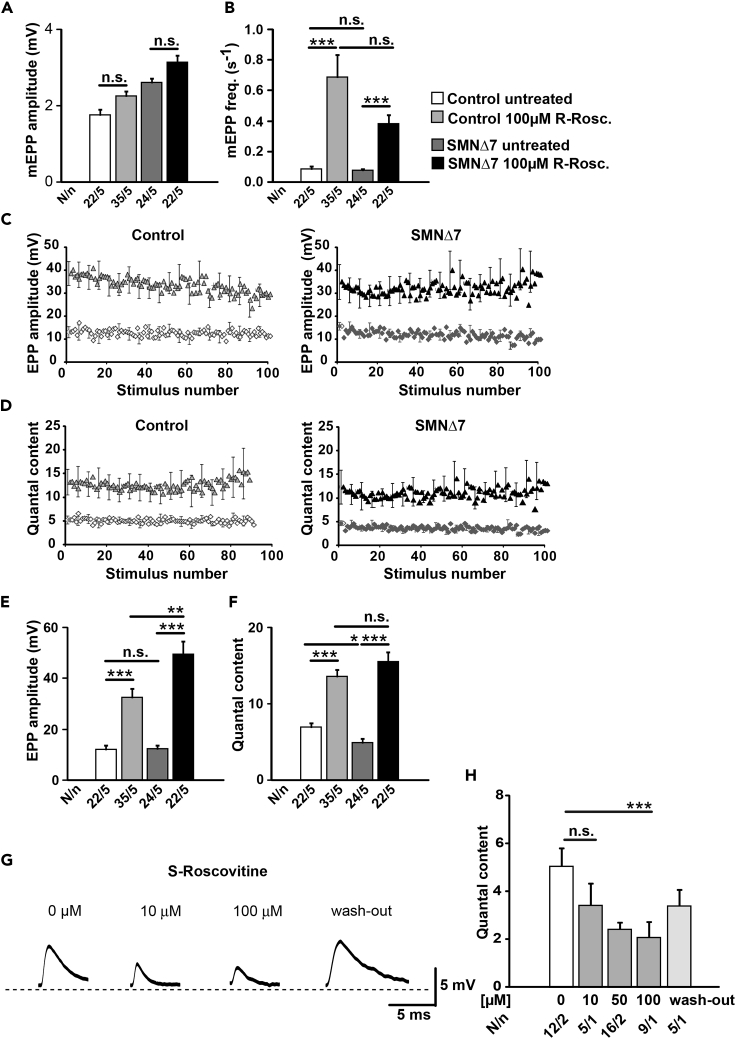
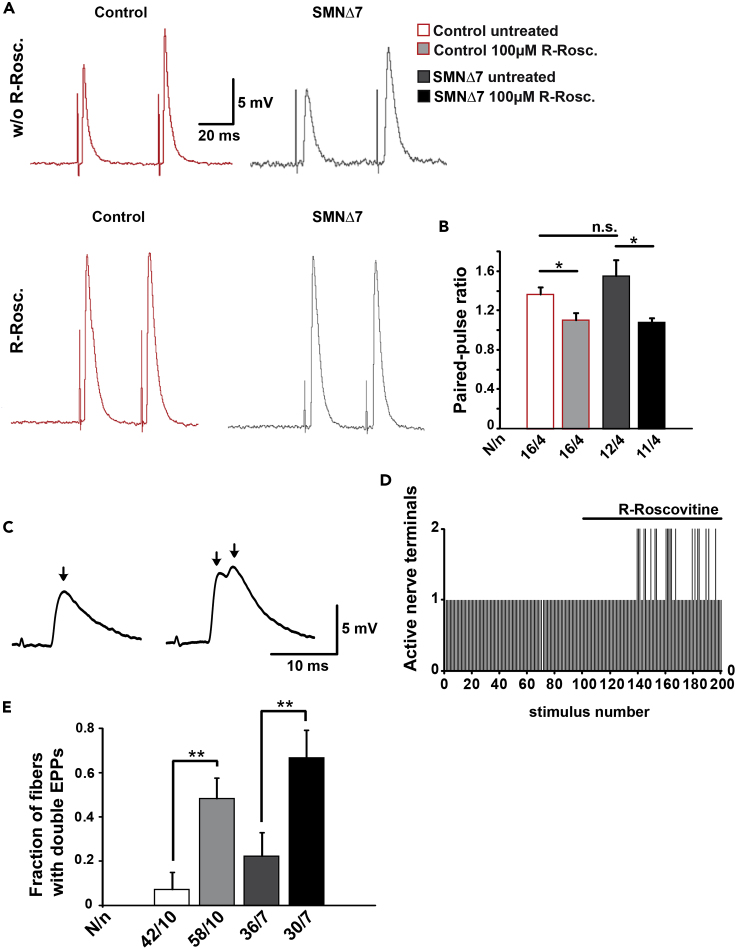
Neurotransmission defects and motoneuron degeneration are hallmarks of spinal muscular atrophy, a monogenetic disease caused by the deficiency of the SMN protein. In the present study, we show that systemic application of R-Roscovitine, a Cav2.1/Cav2.2 channel modifier and a cyclin-dependent kinase 5 (Cdk-5) inhibitor, significantly improved survival of SMA mice. In addition, R-Roscovitine increased Cav2.1 channel density and sizes of the motor endplates. In vitro, R-Roscovitine restored axon lengths and growth cone sizes of Smn-deficient motoneurons corresponding to enhanced spontaneous Ca2+ influx and elevated Cav2.2 channel cluster formations independent of its capability to inhibit Cdk-5. Acute application of R-Roscovitine at the neuromuscular junction significantly increased evoked neurotransmitter release, increased the frequency of spontaneous miniature potentials, and lowered the activation threshold of silent terminals. These data indicate that R-Roscovitine improves Ca2+ signaling and Ca2+ homeostasis in Smn-deficient motoneurons, which is generally crucial for motoneuron differentiation, maturation, and function.

Keywords: Cellular Neuroscience; Clinical Neuroscience; Neuroscience.


Conflict of interest statement

Declaration of Interests The authors declare no competing interests.

Figures

None
Graphical abstract
Figure 1
Figure 1
Prolonged Lifespan of SMA Mice under Systemic R-Roscovitine Treatment (A) Genotype of Smn-deficient mice used in the study. (B and C) (B) Survival curve and (C) mean survival rate of SMA mice in group 1: untreated (black), prenatally treated with R- or S-Roscovitine (green and gray, respectively), and pre- and postnatally treated with R-Roscovitine (purple); and in group 2: untreated (blue) and treated with R-Roscovitine (pink) (**p < 0.01; ***p < 0.001, ANOVA and U Mann-Whitney). (D and E) (D) Survival curve and (E) mean survival rate of group 1 postnatally treated SMA mice with PBS (yellow), DMSO (orange) and R-Roscovitine (red) (***p < 0.001, ANOVA). (F–I) Representative images for each example from postnatal application depicted at days (F) 2, (G) 5, (H) 10, and (I) 12. Bars represent mean ± SD; n defines the number of mice; n.s., no significance.
Figure 2
Figure 2
Prenatal Treatment with R-Roscovitine Reduces Spinal Motoneuron Loss, Ameliorates the Decrease of Excitatory Synaptic Inputs, and Increases Endplate Surface Area and Cav2.1 Accumulation Area, but Not Muscle Fiber Size In SMNΔ7 Mice (A) Quantification (right panel) of ChAT-positive L1-L2 spinal neurons (left panel) in untreated (left bars) and R-Roscovitine-treated (right bars) mice (**p < 0.01, ANOVA). (B) Representative examples of excitatory synaptic inputs onto L1-L2 motoneurons in control and SMA mice; z stack projections of confocal images, 2 μm (5 optical sections) for the indicated genotypes and conditions (left panel). Densities of VGlut2-positive inputs per soma (right panel) (**p < 0.01, ANOVA) (scale bar, 10 μm). (C) Representative images of endplates labeled with bungarotoxin (BTX) conjugated to rhodamine in control and SMA TVA muscles (left panel). Mean values of BTX surface area in all four conditions (right panel) (**p < 0.01; ***p < 0.001; ANOVA) (scale bar, 10 μm). (D) Cav2.1 channel distribution in control and Smn-deficient neuromuscular junctions (upper panel) indicated by the ratio of the P/Q-BTX area (lower panel) (*p < 0.05; ***p < 0.001, ANOVA) (scale bar, 10 μm). (E) The skeletal muscle membrane was evidenced in transversal slices (20 μm) stained against lectins with rhodamine-labeled WGA; representative images per condition (left panel); mean values for area and perimeter (right panel) (**p < 0.01, ANOVA) (scale bar, 50 μm). Bars represent mean ± SEM. The second number inside bars defines the number of mice; the first number is the number of motoneurons in (A and B), the number of neuromuscular junctions in (C and D), and the number of myofibers in (E); n.s., no significance. See also Figures S1A–S1C.
Figure 3
Figure 3
Application of R-Roscovitine Leads to Enhanced Spontaneous Ca2+ Transients in Smn−/−;SMN2 Motoneurons (A) Representative responses of control motoneurons to 40-s application of 5 μM S-Roscovitine followed by R-Roscovitine in the soma and the growth cone. (B) Permanent application of R- or S-Roscovitine over 5 days in culture. The left panel shows the frequency of Ca2+ transients per neuron at the growth cone of control and SMA motoneurons untreated and under permanent R- or S-Roscovitine exposure (**p < 0.01, ANOVA). The red line defines the mean values. The middle panel depicts the associated bar diagram (mean ± SEM) (**p < 0.01, ANOVA). The right panels show spontaneous Ca2+ spikes indicated by red dots in their corresponding growth cones. N defines number of cells, n indicates number of experiments (N/n); n.s., no significance. See also Figures S2A–S2C and S3A.
Figure 4
Figure 4
Permanent Exposure to R-Roscovitine Supports Cellular Differentiation of Smn−/−;SMN2 Motoneurons (A–C) Representative immunofluorescent images of growth cones on day 5 stained with antibodies against Cav2.2 channels (green) and phalloidin (magenta) of control (A) and SMA motoneurons, untreated (B) or permanently treated (C) with 0.5 μM R-Roscovitine (R-Rosc.) (scale bar, 5 μm). (D) The growth cone area sizes were quantified on different concentrations (0, 0.01, 0.05, 0.1, 0.5 μM) of R-Roscovitine in SMA motoneurons (**p < 0.01; ***p < 0.001; ANOVA). (E) Quantification of signal intensities representing Cav2.2 channel cluster formations at growth cones (***p < 0.001; ANOVA). (F) Axon lengths of R-Roscovitine (0.5 μM) and CTX-treated (ω-CTX-MVIIC, 0.3 μM) and untreated Smn-deficient and control motoneurons cultured on laminin-221/211 or on laminin-111 on day 7 (**p < 0.01; ***p < 0.001; ANOVA). (G) Axon lengths of S-Roscovitine (S-Rosc.)-treated Smn-deficient and control motoneurons on laminin-221/211 or laminin-111 on day 7 (*p < 0.05; ***p < 0.001, ANOVA). (H) Comparison of axon lengths between GV-58 versus S- or R-Roscovitine-treated SMA motoneurons on laminin-221/211 after 7 days in culture (*p < 0.05, ***p < 0.001; ANOVA). Bars represent mean ± SEM. Numbers inside bars define number of cells and number of experiments, respectively; n.s., no significance. See also Figures S3B, S3C, and S4A–S4C.
Figure 5
Figure 5
R-Roscovitine Affects the RNA Profile of Smn-Deficient Motoneurons (A) Volcano plots showing the significance of change (-log10(p value)) and the magnitude of change (log2(fold change), log2FC) for each transcript for the indicated differential expression analyses. Significantly altered transcripts with p < 0.05 are marked in red. For easier visualization data points for transcripts with log2FC < −10 or >10 (all of which were not significantly altered) were omitted. (B) Overlap of transcripts significantly changed (p < 0.05) in the indicated differential expression analyses. (C) Scatterplot showing the magnitude of change (log2(fold change), log2FC) of the transcripts indicated in (B) that are significantly altered in untreated Smn−/−;SMN2 compared with untreated Smn+/+;SMN2 motoneurons and also significantly altered in R-Roscovitine-treated Smn−/−;SMN2 compared with untreated Smn−/−;SMN2 motoneurons. Note that in the scatterplot only transcripts that were detectable under all conditions are shown (351 of the 357 transcripts indicated in (B)). (D) Gene ontology (GO) term analysis of the 305 transcripts indicated by the red box in (C). See also Figure S3B and Tables S1–S7.
Figure 6
Figure 6
R-Roscovitine Increases Spontaneous and Evoked Neurotransmitter Release at Control and SMNΔ7 Mouse Motor Nerve Terminals (A and B) (A) Amplitude and (B) frequency of spontaneous events (mEPPs) in both genotypes with and without R-Roscovitine (100 μM) (***p < 0.001, ANOVA). (C and D) Average EPP size (C) and quantum content (D) during 100 stimuli at 0.5 Hz in control and in SMA terminals with and without R-Roscovitine. (E and F) R-Roscovitine increases (E) mean EPP amplitude and (F) quantal content in both genotypes at low frequency of stimulation (0.5 Hz) (*p < 0.05, **p < 0.01, ***p < 0.001; ANOVA). (G) Representative EPP traces in control fibers before and after application of S-Roscovitine at the indicated concentrations. (H) Quantal content declines with S-Roscovitine concentrations higher than 10 μM (***p < 0.001, ANOVA). Bars represent mean ± SEM. N = number of muscle fibers, n = number of mice; n.s., no significance. See also Figures S2D–S2F.
Figure 7
Figure 7
R-Roscovitine Reduces Facilitation and Increases the Number of Active Motor Nerve Terminals in Control and SMNΔ7 Mice (A) Representative EPP traces from control and mutant muscle fibers before and after the application of 100 μM R-Roscovitine. (B) Quantification of paired-pulse ratio of response amplitudes in control and mutant muscle fibers with and without R-Roscovitine (*p < 0.05, ANOVA). (C) Representation of single (left) and double (right) EPPs in a control mouse. The arrows indicate the peak of each EPP. (D) Number of active terminals in the same control fiber before and after application of R-Roscovitine. (E) Proportion of recorded fibers with double EPPs with respect to the total number of fibers recorded, in control and mutant mice (**p < 0.01, ANOVA). Bars represent mean ± SEM. N = muscle fibers, n = number of mice (N/n); n.s., no significance.
Figure 8
Figure 8
R-Roscovitine Effect on Evoked Neurotransmitter Release Requires the Activation of P/Q-type Calcium Channels in Control and SMNΔ7 Mice (A) Representative EPP traces recorded in a control fiber in physiological solution (untreated), in the presence of ω-Agatoxin IVA (ω-Aga.), and with R-Roscovitine (R-Rosc.) (100 μM) plus ω-Agatoxin IVA (ω-Aga.) (upper panel). ω-Agatoxin IVA reduced the mean amplitude of EPPs (left graph) and the quantal content (right graph), and later application of R-Roscovitine did not increase the amplitude of the response (***p < 0.001, ANOVA). (B) Example of EPPs recorded in control and SMA mutants in control solution, with R-Roscovitine and with ω-Agatoxin IVA plus R-Roscovitine. Terminals treated with ω-Agatoxin IVA show a complete block of the evoked response elicited in the presence of R-Roscovitine as illustrated in EPP amplitude (left graph) and quantal content (right graph), both in control (p***<0.0005, ANOVA) and in SMA mice (p***<0.0005, ANOVA). Numbers inside bars represent the number of muscle fibers and the number of mice, respectively; n.s., no significance.

References

    1. Balezina O.P., Bogacheva P.O., Orlova T.Y. Effect of L-type calcium channel blockers on activity of newly formed synapses in mice. Bull. Exp. Biol. Med. 2007;143:171–174. - PubMed
    1. Biondi O., Grondard C., Lecolle S., Deforges S., Pariset C., Lopes P., Cifuentes-Diaz C., Li H., della G.B., Chanoine C., Charbonnier F. Exercise-induced activation of NMDA receptor promotes motor unit development and survival in a type 2 spinal muscular atrophy model mouse. J. Neurosci. 2008;28:953–962. - PMC - PubMed
    1. Biondi O., Branchu J., Sanchez G., Lancelin C., Deforges S., Lopes P., Pariset C., Lecolle S., Cote J., Chanoine C., Charbonnier F. In vivo NMDA receptor activation accelerates motor unit maturation, protects spinal motor neurons, and enhances SMN2 gene expression in severe spinal muscular atrophy mice. J. Neurosci. 2010;30:11288–11299. - PMC - PubMed
    1. Bruyere C., Meijer L. Targeting cyclin-dependent kinases in anti-neoplastic therapy. Curr. Opin. Cell Biol. 2013;25:772–779. - PubMed
    1. Buraei Z., Elmslie K.S. The separation of antagonist from agonist effects of trisubstituted purines on CaV2.2 (N-type) channels. J. Neurochem. 2008;105:1450–1461. - PubMed