

Heart rate variability measures for prediction of severity of illness and poor outcome in ED patients with sepsis
- PMID: 31982224
- PMCID: PMC7338243
- DOI: 10.1016/j.ajem.2020.01.012
Heart rate variability measures for prediction of severity of illness and poor outcome in ED patients with sepsis
Abstract
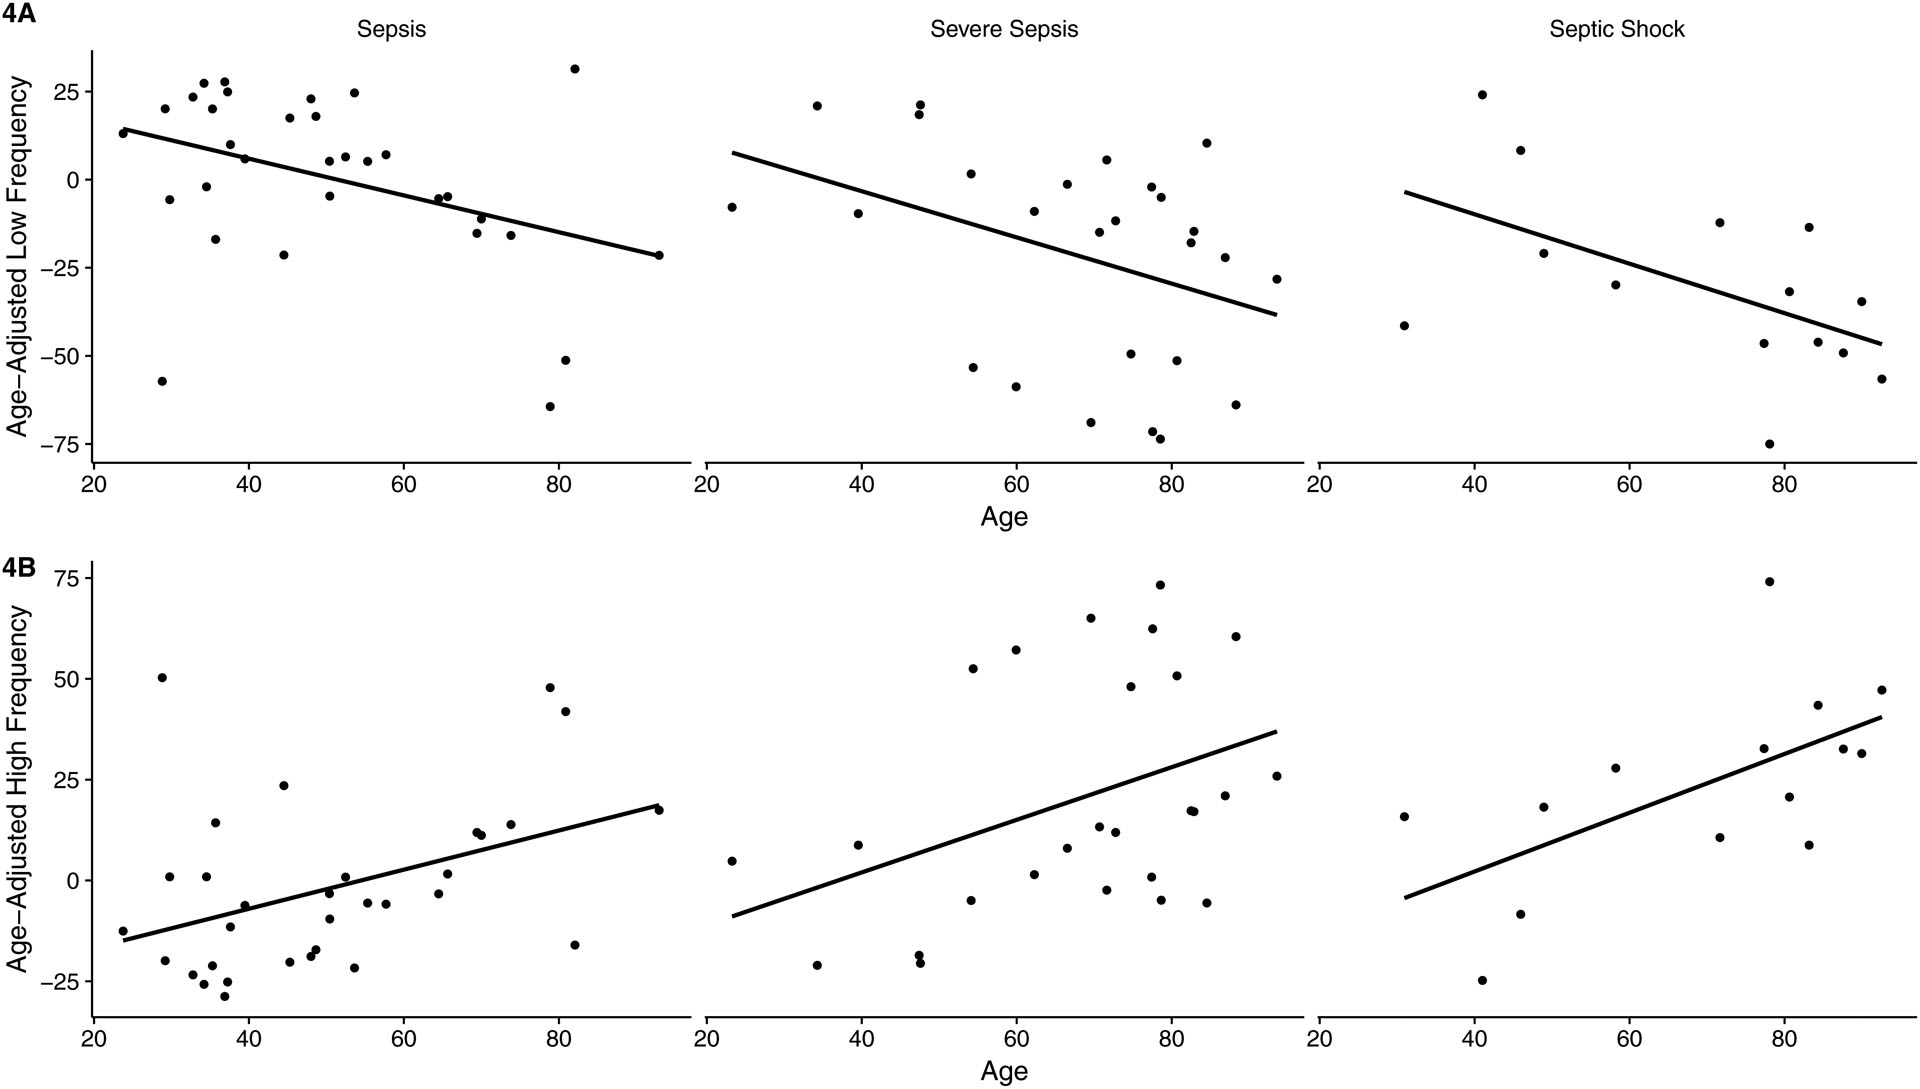
Introduction: This study evaluates the utility of heart rate variability (HRV) for assessment of severity of illness and poor outcome in Emergency Department (ED) patients with sepsis. HRV measures evaluated included low frequency (LF) signal, high frequency (HF) signal, and deviations in LF and HF signal from age-adjusted reference values.
Methods: This was a prospective, observational study. Seventy-two adult ED patients were assessed within 6 h of arrival.
Results: Severity of illness as defined by sepsis subtype correlated with decreased LF signal (sepsis: 70.68 ± 22.95, severe sepsis: 54.00 ± 28.41, septic shock: 45.54 ± 23.31, p = 0.02), increased HF signal (sepsis: 27.87 ± 19.42, severe sepsis: 44.63 ± 27.29, septic shock: 47.66 ± 20.98, p = 0.01), increasingly negative deviations in LF signal (sepsis: 0.41 ± 24.53, severe sepsis: -21.43 ± 30.09, septic shock -30.39 ± 26.09, p = 0.005) and increasingly positive deviations in HF signal (sepsis: -1.86 ± 21.09, severe sepsis: 20.07 ± 29.03, septic shock: 23.6 ± 24.17, p = 0.004). Composite poor outcome correlated with decreased LF signal (p = 0.008), increased HF signal (p = 0.03), large negative deviations in LF signal (p = 0.004) and large positive deviations in HF signal (p = 0.02). Deviations in LF and HF signal from age-adjusted reference values correlated with individual measures of poor outcome with greater consistency than LF or HF signal.
Discussion: Accounting for the influence of age on baseline HRV signal improves the predictive value of HRV measures in ED patients with sepsis.
Copyright © 2020 Elsevier Inc. All rights reserved.
Conflict of interest statement
Declaration of competing interest JEA reports no conflict of interest. JKL reports no conflict of interest. WJHF reports no conflict of interest. SC reports no conflict of interest. EF reports no conflict of interest. EJS reports no conflict of interest. RS reports no conflict of interest. PMH reports the following: 1.) Co-founder RVMetrics, LLC; 2) Sponsored research for Caretaker Medical.
Figures


Comment in
-
Non-linearity of the association between heart rate variability and severity of illness.Am J Emerg Med. 2020 Jun;38(6):1274. doi: 10.1016/j.ajem.2020.02.031. Epub 2020 Feb 19. Am J Emerg Med. 2020. PMID: 32139206 No abstract available.
-
The authors respond: Heart rate variability analytic techniques.Am J Emerg Med. 2020 Jun;38(6):1275. doi: 10.1016/j.ajem.2020.02.032. Epub 2020 Feb 21. Am J Emerg Med. 2020. PMID: 32173234 No abstract available.
References
-
- Dombrovskiy VY, Martin AA, Sunderram J, Paz HL. Rapid increase in hospitalization and mortality rates for severe sepsis in the United States: A trend analysis from 1993 to 2003. Crit Care Med. 2007;35(5):1244–50. - PubMed
-
- Angus DC, Linde-Zwirble WT, Lidicker J, et al. Epidemiology of severe sepsis in the United States: analysis of incidence, outcome, and associated costs of care. Crit Care Med 2001;29(7):1303–1310. - PubMed
-
- Xu J, Kochanek KD, Murphy SL, Tejada-Vera B. Deaths: final data for 2014. Natl Vital Stat Rep 2016;65(5):1–96. - PubMed
-
- Dellinger RP, Levy MM, Rhodes A, et al. Surviving Sepsis campaign: international guidelines for mangagement of severe sepsis and septic shock: 2012. Cit Care Med 2013;41(2):580–657. - PubMed
-
- Rhodes A, Evans LE, Alhazzani W, et al. Surviving Sepsis Campaign: International Guidelines for Management of Severe Sepsis and Septic Shock: 2016. Intensive Care Med. 2017;43(3):304–377. - PubMed
Publication types
MeSH terms
Grants and funding
LinkOut - more resources
Full Text Sources
Medical
Research Materials
Miscellaneous
