. 2020 Mar 5;77(5):970-984.e7.
doi: 10.1016/j.molcel.2019.12.023. Epub 2020 Jan 22.

Cancer Cells Employ Nuclear Caspase-8 to Overcome the p53-Dependent G2/M Checkpoint through Cleavage of USP28

Affiliations

Cancer Cells Employ Nuclear Caspase-8 to Overcome the p53-Dependent G2/M Checkpoint through Cleavage of USP28

Ines Müller et al. Mol Cell. .

Abstract

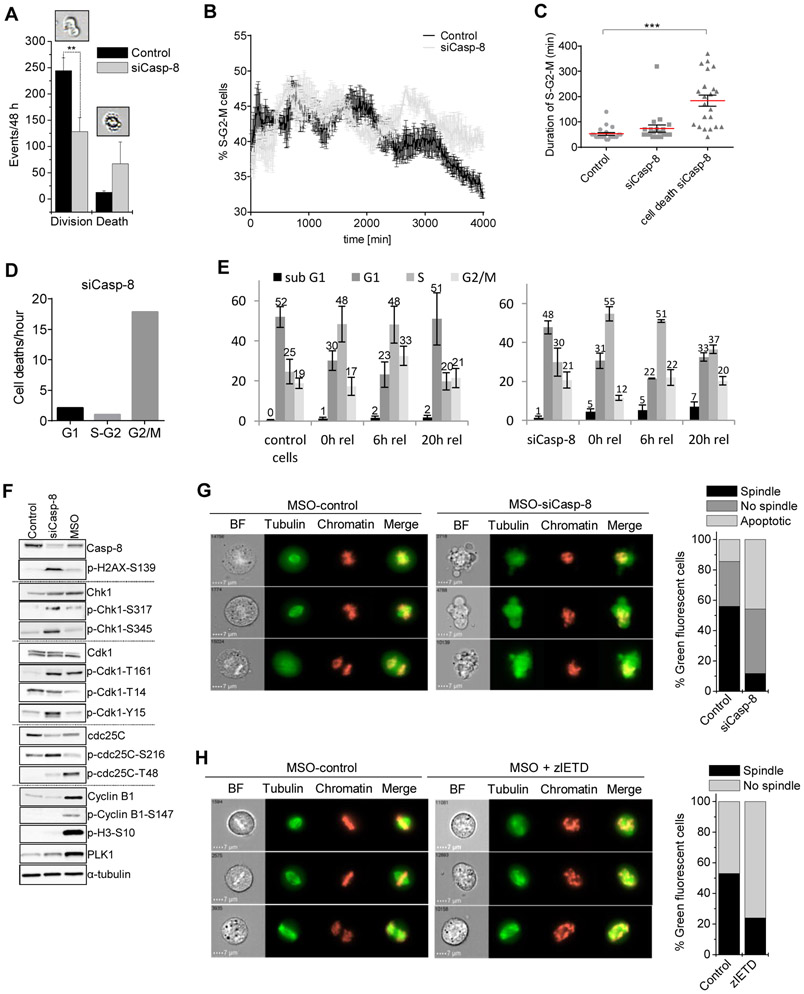
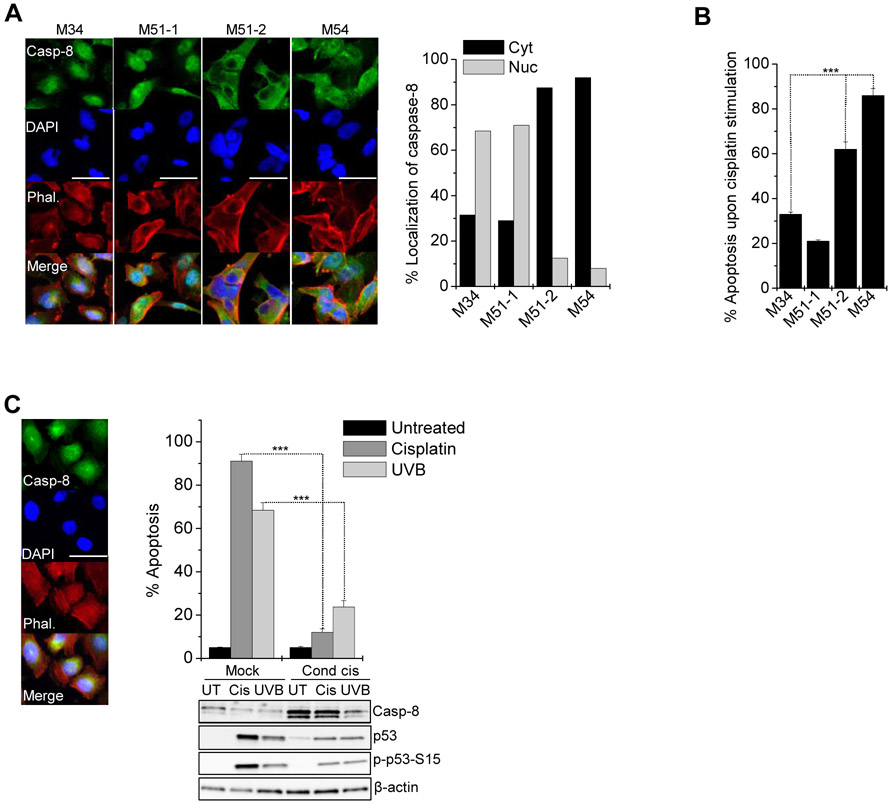
Cytosolic caspase-8 is a mediator of death receptor signaling. While caspase-8 expression is lost in some tumors, it is increased in others, indicating a conditional pro-survival function of caspase-8 in cancer. Here, we show that tumor cells employ DNA-damage-induced nuclear caspase-8 to override the p53-dependent G2/M cell-cycle checkpoint. Caspase-8 is upregulated and localized to the nucleus in multiple human cancers, correlating with treatment resistance and poor clinical outcome. Depletion of caspase-8 causes G2/M arrest, stabilization of p53, and induction of p53-dependent intrinsic apoptosis in tumor cells. In the nucleus, caspase-8 cleaves and inactivates the ubiquitin-specific peptidase 28 (USP28), preventing USP28 from de-ubiquitinating and stabilizing wild-type p53. This results in de facto p53 protein loss, switching cell fate from apoptosis toward mitosis. In summary, our work identifies a non-canonical role of caspase-8 exploited by cancer cells to override the p53-dependent G2/M cell-cycle checkpoint.

Keywords: G2/M checkpoint; USP28; apoptosis; cancer; caspase-8; p53.


Conflict of interest statement

Declaration of Interests The authors declare no competing interests.

Figures

Figure 1.
Figure 1.. Tumors with elevated and nuclear caspase-8 expression present with higher relapse rates and poor prognosis
(A) Caspase-8 gene expression was compared between human healthy and tumor samples derived from TCGA data base; ***p ≤ 0.001, **p ≤ 0.01, *p ≤ 0.05. (B) IHC analysis of caspase-8 localization in primary versus metastatic melanoma and in prostate benign and cancer tissue, respectively. Scale bar = 100 μm. (C) Quantification of caspase-8 expression level in TMAs of nevi (n=100) compared to melanoma (n=92); ***p ≤ 0.001. (D) Kaplan-Meier-Plot displaying survival rate of patients suffering from primary (n=91) melanoma with low or high caspase-8 expression level; *p ≤ 0,01. (E) Quantification of nuclear caspase-8 in TMAs of nevi (n=100), primary (n=92) and metastatic (n=48) melanoma. (F) Overall survival (days) of melanoma patients showing either nuclear (n=16) or cytosolic (n=27) staining of caspase-8; *p ≤ 0.05. (G) Ratio of caspase-8 expression derived from RNAseq analysis of patients with benign prostate phenotype (n=11), low (n=22) or high risk (n=47) prostate cancer, and NHT treated high risk prostate cancer (n=15); ***p ≤ 0.001, **p ≤ 0.005. (H) Kaplan-Meier-Plot displaying PSA recurrence free survival of Tax (n=19) or NHT (n=51) treated prostate cancer patients with low or high caspase-8 expression; *p ≤ 0,01. (I) Quantification of nuclear caspase-8 expression, in prostate cancer tissue cores of untreated (n=129/730) versus Tax-treated (n=59/107), castration resistant prostate cancer (CRPC/TURP, n=32/42) and neuroendocrine prostate cancer (NEPC, n=7/8) TMAs. (J) Quantification of nuclear caspase-8 in TMAs of untreated (n=16/47) compared to NHT treated for 1-6 months (n=15/26) and 7-12 months (n=37/43), respectively. See also Figure S1 and S2.
Figure 2.
Figure 2.. Nuclear expression of caspase-8 is mediated by distinct NES and NLS sequences
(A) Expression level of caspase-8 in primary melanocytes and different melanoma cell lines (WM115, WM35, MeWo, 451-LU, WM3211, A375) was determined by Western-blotting with GAPDH as loading control. (B) Caspase-8 was detected in cytosolic and nuclear fractions of WM115 cells by Western-blotting, compared to whole cell lysates with IκBα as a marker for cytosolic, and Histone H3 for nuclear fraction. (C) Based on a wild type myc-tagged caspase-8 expression plasmid (wtCasp-8) putative NES (Casp-8-mNES) and NLS (Casp-8-mNLS) sequences were mutated. A catalytically inactive (Casp-8-C360A) and a Death Effector Domain lacking mutant (Casp-8-ΔDED) were generated. (D) The localization of caspase-8 mutants was analyzed immune-cytochemically: anti-caspase-8 (green), anti-myc (orange), phalloidin (red), DAPI (blue). Percentage of cells (n=100) expressing mostly cytosolic (cyt) or nuclear (nuc) caspase-8 was scored. Scale bar = 20 μm. (E) Cells were stimulated with izTRAIL (100 ng/ml), irradiated with sublethal UVB (200 J/m2), or stimulated with Cispatin (Cis; 10 μM) and Temozolomide (TMZ; 2 mM), respectively, for 30 min and analyzed by immunofluorescence. Scale bar = 50 μm. (F) Cells were treated as in (E) for 1 h and the subcellular localization of cleaved caspase-8 aggregates analyzed by immunofluorescence (anti-caspase-8 or anti cleaved capsase-8 (green), DAPI (blue), phalloidin (red)). Quantification of nuclear and cytosolic cleaved caspase-8 aggregates is shown. Scale bar = 20 μm.
Figure 3.
Figure 3.. Caspase-8 knockdown induces intrinsic apoptosis in melanoma cells
(A) WM115 cells were silenced for caspase-8 with siRNA (siCasp-8) or a siRNA smart pool (spCasp-8) for 72 h and apoptosis determined by Cell Death Detection ELISA (CDDE). Caspase-8 knockdown was documented by Western-blotting with GAPDH as loading control. (B) Cells silenced for caspase-8 were irradiated with sub-lethal UVB (200 J/m2) and apoptosis assessed 24 h later using CDDE; **p ≤ 0.005. (C) Cells were treated with QVD (5 μM), Necrostatin-1S (Nec-1S, 15 μM) or both for 1 h prior to caspase-8 silencing. After 72 h apoptosis was determined by CDDE; **p ≤ 0.005. (D) Cells were silenced for caspase-8 alone or co-silenced for RIP1 and RIP3, respectively. After 72 h apoptosis was assessed by CDDE, and knockdown of RIP1, RIP3, and caspase-8 documented by Western-blotting with GAPDH as loading control. (E) Expression of proteins involved in intrinsic apoptosis (p53, p-p53-Ser15, Bax, Bak, Puma, Noxa, caspase-9, caspase-3, PARP) in untreated, siCasp-8 and mitotic (MSO) cells was documented by Western-blotting with α-tubulin as loading control. (F) Endogenous caspase-8 was silenced in cells stably expressing moTAP-tagged wtCasp-8 or mutCasp-8 (C360A) for 72 h and apoptosis determined by CDDE; **p ≤ 0.005. Expression of caspase-8 and p53 was determined by Western-blotting with GAPDH as loading control. (G) Caspase-8 was detected in cytosolic and nuclear fractions of WM115 cell clones 30 and 150, stably expressing preferably nuclear caspase-8 and clones 213 and 215 expressing preferably cytosolic caspase-8 by Western-blotting. IκBα served as a marker for cytosolic, Histone H3 for nuclear fractions. (H) The same clones as characterized in (G) were stimulated with cisplatin (10 μM) or temozolomide (2 mM). After 24 h apoptosis was assessed by CDDE; *p≤0.05; **p≤0.01; ***p≤0.005. Error bars are shown as mean ± SD. See also Figure S3.
Figure 4.
Figure 4.. Cancer cells with nuclear caspase-8 overcome cell cycle arrest at the G2/M checkpoint
(A) siCasp-8 WM115 cells were subjected to live cell imaging and dividing versus dying cells were quantified morphologically; **p ≤ 0.01. (B) FUCCI2-HeLa cells were transfected with siCasp-8 or siLacZ. After 24 h, cells were subjected to life cell imaging for 48 h. Percentage of green cells (S-G2-M) over time was determined by evaluating microscopic images (timeframe 10 min). (C) Scatter dot blot showing the duration of S-G2-M phase of control versus siCasp-8 cells (n=25); ***p≤ 0.001. (D) Number of cell deaths/hour of siCasp-8 transfected FUCCI2-HeLa in G1 (red), S-G2 (yellow), and G2/M (green) transition. (E) WM115 cells were subjected to LacZ or caspase-8 knockdown and synchronized in S-phase using a double thymidine block. 0 h, 6 h and 20 h after release cell cycle analysis was performed. Average percentages of cells in the particular cell cycle phase are given. (F) Expression of proteins involved in mitotic transition (caspase-8, p-H2AX-S139, Chk1, p-CHk1-S317, p-CHk1-S345, Cdk1, p-Cdk1-T161, p-Cdk1-T14, p-Cdk1-Y15, cdc25C, p-cdc25C-Ser216, p-cdc25C-T48, cyclin B1, p-cyclin B1-S147, p-H3-S10, PLK1) in untreated, siCasp-8 and mitotic (MSO) cells was documented by Western-blotting with α-tubulin as loading control. (G and H) HKF1_H2B-mCherry_αTubulin-mEGFP cells (G) silenced for caspase-8 or (H) treated with the caspase-8 inhibitor zIETD (20 μM) for 72 h were harvested via mitotic shake off (MSO). Chromatin structure and spindle formation were evaluated by image stream analysis. 500 cells were quantified. Scale bar = 7 μm. Error bars are shown as mean ± SD. See also Figure S4.
Figure 5.
Figure 5.. Caspase-8 regulates p53 stability at the G2/M checkpoint through cleavage of USP28
(A) Recombinant p53 was subjected to MDM2-mediated ubiquitination in vitro. De-ubiquitination of p53 by addition of recombinant USP28 (0.9 μM) was analyzed by immunoblotting. Addition of recombinant active caspase-8 (400 ng) resulted in cleavage and inactivation of USP28. (B) Expression of p53, USP28 and MDM2 in untreated, siCasp-8 and mitotic (MSO) WM115 cells was documented by Western-blotting with GAPDH as loading control. (C) Cells were treated with the proteasome inhibitor MG132 (10 μM), transfected with siCasp-8 or siUSP28. After 72 h recombinant USP28 (0.5 μM) was added to siUSP28 cell lysates. Level of p53 and K48-ubiquitin were analyzed in whole cell lysates by immunoblotting with β-actin as loading control. Ratio of p53 versus ubiquitin was calculated; *p ≤ 0.05; **p ≤ 0.005; ***p≤ 0.001. (D) Cells were treated with siCasp-8, siUSP28 or sip53. After 72 h TUBE-assay identifying the ubiquitination status of p53 was performed; *p ≤ 0.05. (E and F) Apoptosis of cells silenced for (E) USP28, Casp-8, or both, or (F) Casp-8, p53 or both was determined after 72 h by CDDE; ***p ≤ 0.001. Expression of caspase-8, USP28 and p53 was determined by Western-blotting with β-actin or GAPDH as loading controls. (G) Cells were synchronized in S-Phase with a double aphidicolin block. 5 h and 6 h after release cells were harvested and the status of cleaved caspase-8, USP28 and p53 determined by Western-blotting with β-actin as loading control. (H) Protein lysates of cells expressing recombinant wtUSP28, mutUSP28(D119E) or mutUSP28(D240E) were treated with recombinant Caspase-8 (400 ng). Cleavage of USP28 and caspase-8 was documented by Western-blotting with β-actin as loading control. (I) Apoptosis of cells expressing wtUSP28 or mutUSP28(D119E) was determined by CDDE 24 h after transfection; ***p ≤ 0.005. Status of USP28, p53 and ub-K48 was documented by Western-blotting with β-actin as loading control. (J) Caspase-8 was silenced in cells expressing wtUSP28 or mutUSP28(D119E). After 48 h apoptosis was assessed by CDDE; ***p ≤ 0.005. (K and L) Casp-8-mNES cell clone 30 stably expressing preferably nuclear caspase-8 and Casp-8-mNLS cell clone 213 expressing preferably cytosolic caspase-8 were transfected with wtUSP28 or mutUSP28(D119E), respectively, and stimulated with UVB (300 J/m2), cisplatin (10 μM) or Temozolomide (2 mM). (K) After 24 h apoptosis was assessed by CDDE; **p ≤ 0.01, and (L) the protein status of USP28 and p53 documented by Western-blotting with β-actin as loading control. Error bars are shown as mean ± SD. See also Figures S5 and S6.
Figure 6.
Figure 6.. Nuclear caspase-8 causes progression and survival of cancer cells harboring wild-type p53
(A) 17 different cancer cells lines (melanoma: WM115, 451-LU, A375, MeWo; prostate: PC3, DU145; breast: MCF-7, T47D; colon: HCT116, Colo-205; glioma: A172, T98G; pancreas: Panc89, liver: HepG3B, HUH-7, bladder: UM-UC-3, UC-1) expressing either wt or mut p53 were silenced for caspase-8. After 72 h apoptosis was assessed by CDDE. (B) p53 was stably knocked down using shRNA in cells stably expressing moTAP-tagged wtCasp-8 or mutCasp-8 (C360A), followed by single cell clone selection. The percentage of cell clones still expressing either wtCasp-8 (n=50) or mutCasp-8 (n=50) was quantified. (C) Examples of clones expressing different levels of caspase-8 and p53 was determined by immunoblotting with β-actin as loading control. (D) Apoptosis of clones 79 and 80 expressing lower endogenous p53 level was determined 72 h after caspase-8 knockdown by CDDE; ***p ≤ 0.001. Expression of caspase-8 and p53 was determined by immunoblotting with GAPDH as loading control. (E) Proliferation of clones 15, 17, 24 and 52 expressing different level of caspase-8 and p53, as indicated by immunoblotting (loading control: β-actin), was determined; ***p ≤ 0.001, **p ≤ 0.01, *p ≤ 0.05. (F) Cells were treated with the caspase-8 inhibitor zIETD and clonogenic outgrowth determined after 72 h by cristal violet staining; **p ≤ 0.01. (G) Caspase-8 was silenced in primary keratinocytes, fibroblasts and melanocytes, as well as in melanoma cells freshly isolated from patients metastases (M10, M20, M45). After 72 h apoptosis was determined by CDDE. The p53 mutation status in M10, M20 and M45 was assessed by sequence analysis. (H) Expression of caspase-8 and p53 in keratinocytes, fibroblasts, melanocytes, M10, M20 and M45 was determined by Western-blotting with GAPDH as loading control. (I) RNAseq data for Casp-8, the p53 mutation and survival status of patients as deduced from TCGA database were analyzed in a bioinformatics approach. Groups were split into high and low Casp-8 expression based on its median expression values. Percentages indicate the patient's vital status based on the Casp-8 expression and the corresponding p53 mutation status. Error bars are shown as mean ± SD. See also Figures S7.
Figure 7.
Figure 7.. Nuclear caspase-8 confers resistance to genotoxic stress in metastatic melanoma
(A) Localization of endogenous caspase-8 in cells isolated from melanoma metastases (M34, M51-1, M51-2, M54) was analyzed immunocytochemically: anti-caspase-8 (green), phalloidin (red), DAPI (blue). Percentage of cells (n=100) expressing mostly cytosolic (cyt) or nuclear (nuc) caspase-8 was scored. Scale bar = 50 μm. (B) Metastatic melanoma cells were treated with cisplatin (30 μM) for 24 h and apoptosis determined by CDDE; ***p ≤ 0.001. (C) The localization of endogenous caspase-8 in A375 cells was analyzed immunocytochemically as in (A). Parental cells (mock) and cells conditioned to cisplatin (cond cis., 1 μM) for 6 months were treated with lethal doses of cisplatin (30 μM) or UVB (400 J/m2). After 24 h apoptosis was assessed by CDDE; ***p ≤ 0.001. Status of Caspase-8, p53 and phospho-p53 was determined by Western-blotting with β-actin as loading control. Scale bar = 50 μm. Error bars are shown as mean ± SD.

References

    1. Allende-Vega N, Dayal S, Agarwala U, Sparks A, Bourdon JC, and Saville MK (2013). p53 is activated in response to disruption of the pre-mRNA splicing machinery. Oncogene 32, 1–14. - PubMed
    1. Barbero S, Mielgo A, Torres V, Teitz T, Shields DJ, Mikolon D, Bogyo M, Barila D, Lahti JM, Schlaepfer D, and Stupack DG (2009). Caspase-8 association with the focal adhesion complex promotes tumor cell migration and metastasis. Cancer Res. 69, 3755–3763. - PMC - PubMed
    1. Berglind H, Pawitan Y, Kato S, Ishioka C, and Soussi T (2008). Analysis of p53 mutation status in human cancer cell lines: a paradigm for cell line cross-contamination. Cancer Biol. Ther 7, 699–708. - PubMed
    1. Bieging KT, Mello SS, and Attardi LD (2014). Unravelling mechanisms of p53-mediated tumour suppression. Nat. Rev. Cancer 14, 359–370. - PMC - PubMed
    1. Boege Y, Malehmir M, Healy ME, Bettermann K, Lorentzen A, Vucur M, Ahuja AK, Bohm F, Mertens JC, Shimizu, et al. (2017). A Dual Role of Caspase-8 in Triggering and Sensing Proliferation-Associated DNA Damage, a Key Determinant of Liver Cancer Development. Cancer Cell 32, 342–359. - PMC - PubMed

Publication types

MeSH terms