. 2020 May;158(6):1728-1744.e14.
doi: 10.1053/j.gastro.2020.01.027. Epub 2020 Jan 23.

Identification of Lineage-Specific Transcription Factors That Prevent Activation of Hepatic Stellate Cells and Promote Fibrosis Resolution

Affiliations

Identification of Lineage-Specific Transcription Factors That Prevent Activation of Hepatic Stellate Cells and Promote Fibrosis Resolution

Xiao Liu et al. Gastroenterology. 2020 May.

Abstract

Background & aims: Development of liver fibrosis is associated with activation of quiescent hepatic stellate cells (HSCs) into collagen type I-producing myofibroblasts (activated HSCs). Cessation of liver injury often results in fibrosis resolution and inactivation of activated HSCs/myofibroblasts into a quiescent-like state (inactivated HSCs). We aimed to identify molecular features of phenotypes of HSCs from mice and humans.

Methods: We performed studies with LratCre, Ets1-floxed, Nf1-floxed, Pparγ-floxed, Gata6-floxed, Rag2-/-γc-/-, and C57/Bl6 (control) mice. Some mice were given carbon tetrachloride (CCl4) to induce liver fibrosis, with or without a peroxisome proliferator-activated receptor-γ (PPARγ) agonist. Livers from mice were analyzed by immunohistochemistry. Quiescent, activated, and inactivated HSCs were isolated from livers of Col1α1YFP mice and analyzed by chromatin immunoprecipitation and sequencing. Human HSCs were isolated from livers denied for transplantation. We compared changes in gene expression patterns and epigenetic modifications (histone H3 lysine 4 dimethylation and histone H3 lysine 27 acetylation) in primary mouse and human HSCs. Transcription factors were knocked down with small hairpin RNAs in mouse HSCs.

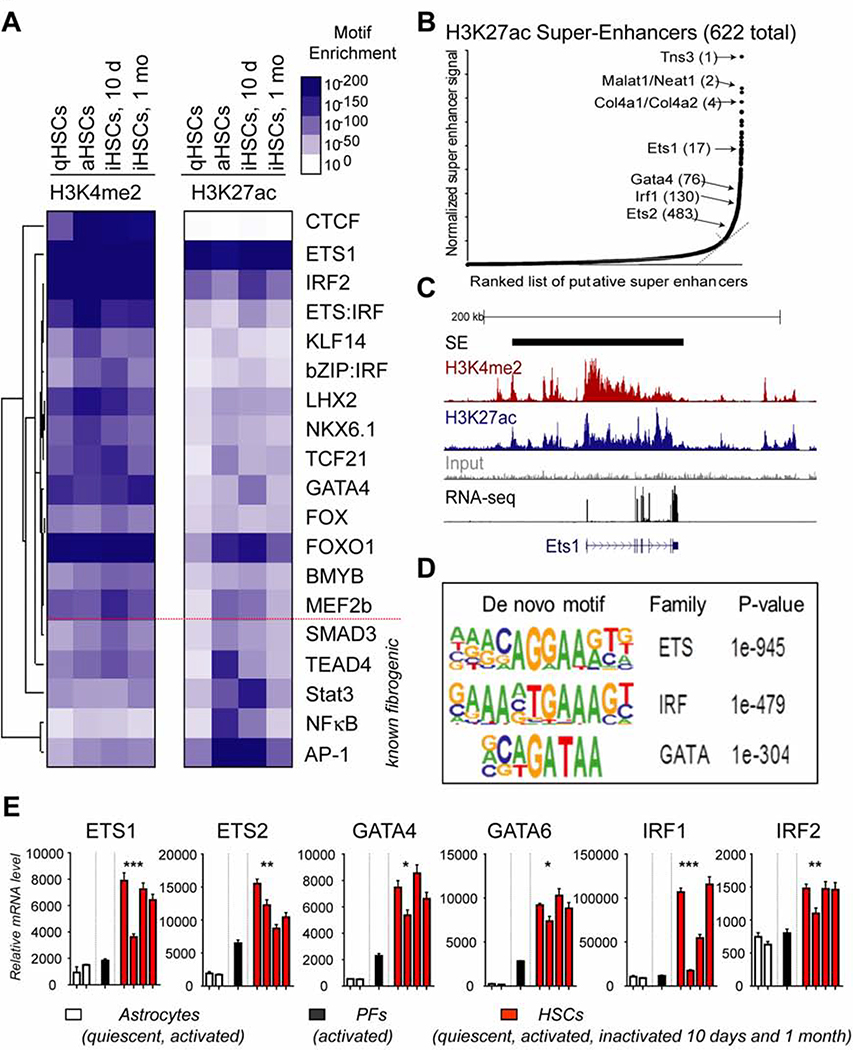
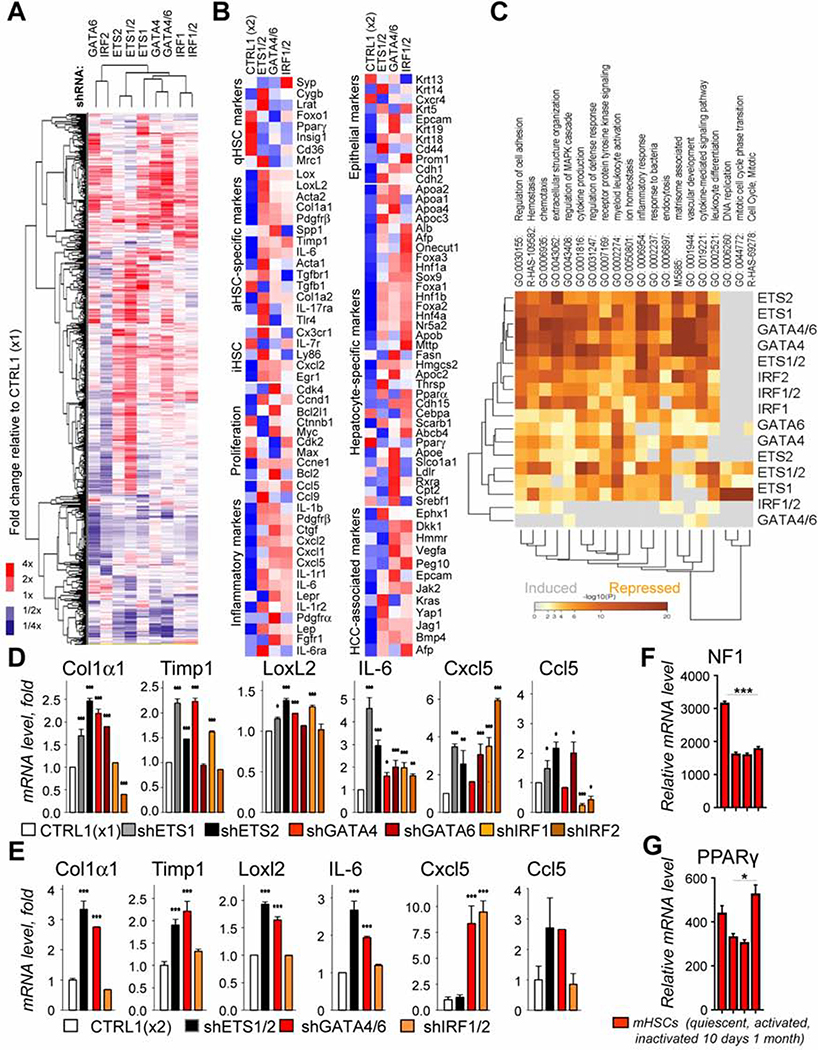
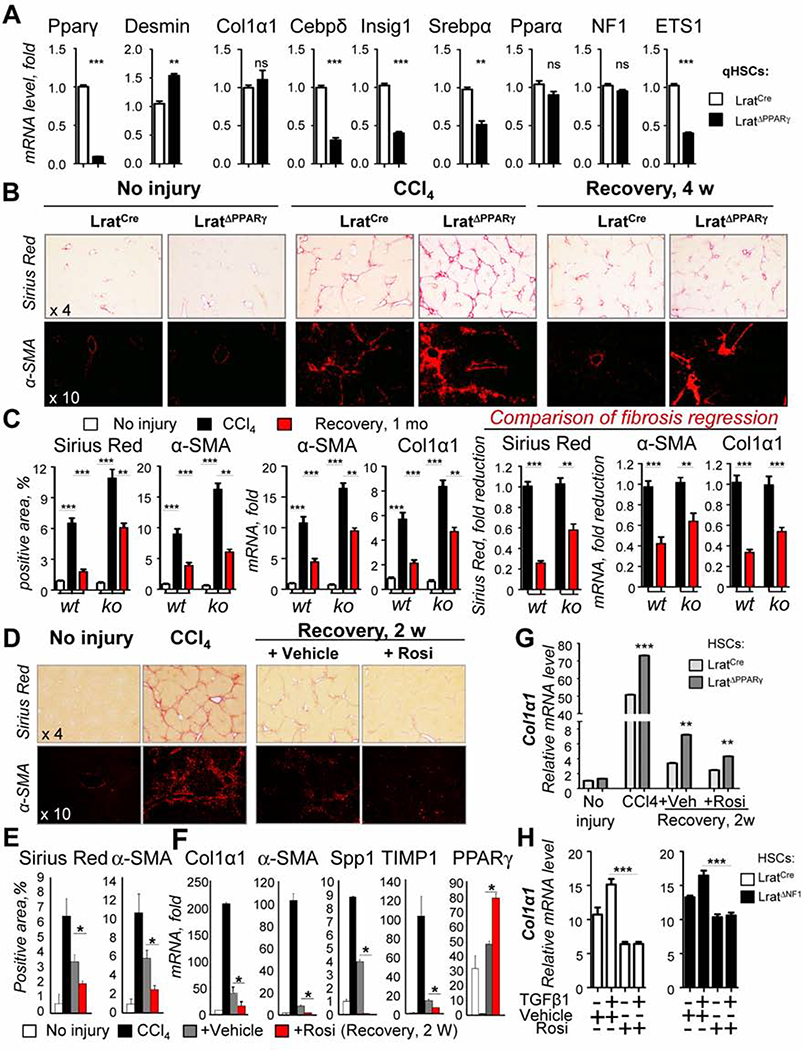
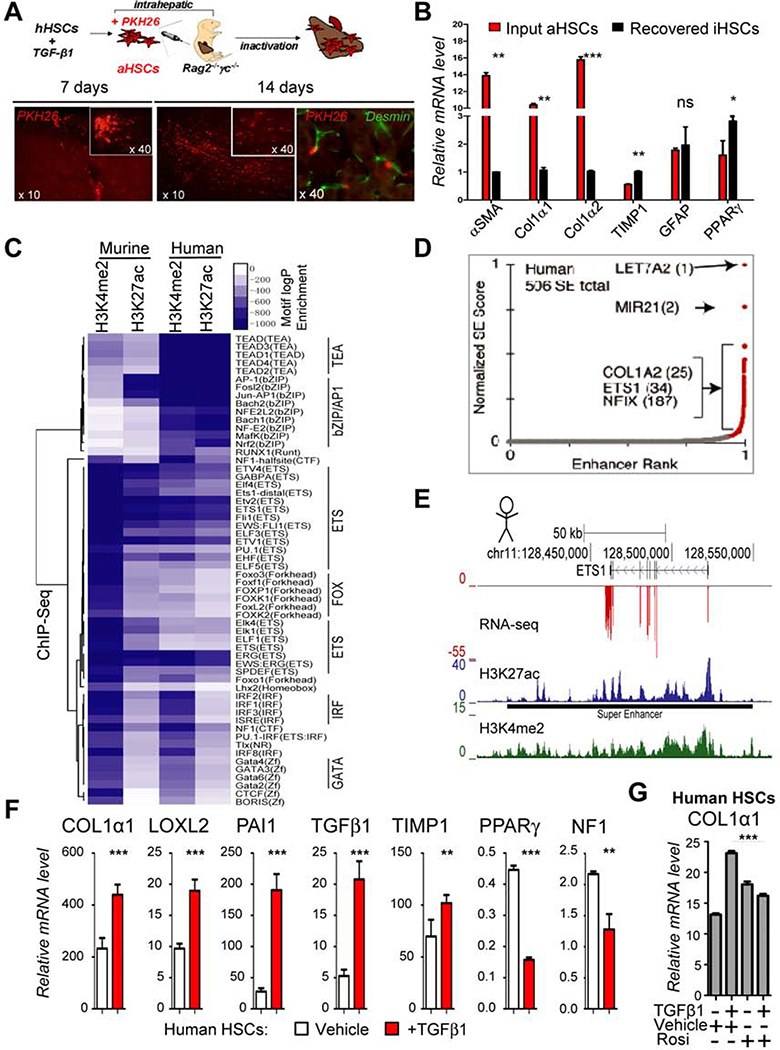
Results: Motif enrichment identified E26 transcription-specific transcription factors (ETS) 1, ETS2, GATA4, GATA6, interferon regulatory factor (IRF) 1, and IRF2 transcription factors as regulators of the mouse and human HSC lineage. Small hairpin RNA-knockdown of these transcription factors resulted in increased expression of genes that promote fibrogenesis and inflammation, and loss of HSC phenotype. Disruption of Gata6 or Ets1, or Nf1 or Pparγ (which are regulated by ETS1), increased the severity of CCl4-induced liver fibrosis in mice compared to control mice. Only mice with disruption of Gata6 or Pparγ had defects in fibrosis resolution after CCl4 administration was stopped, associated with persistent activation of HSCs. Administration of a PPARγ agonist accelerated regression of liver fibrosis after CCl4 administration in control mice but not in mice with disruption of Pparγ.

Conclusions: Phenotypes of HSCs from humans and mice are regulated by transcription factors, including ETS1, ETS2, GATA4, GATA6, IRF1, and IRF2. Activated mouse and human HSCs can revert to a quiescent-like, inactivated phenotype. We found GATA6 and PPARγ to be required for inactivation of human HSCs and regression of liver fibrosis in mice.

Keywords: Epigenetic Regulation; Inactivation of Fibrogenic Myofibroblasts; Lineage-Determining Transcription Factors; Resolution of Liver Fibrosis.


Conflict of interest statement

Conflict of interests: nothing to declare

Figures

Figure 1.
Figure 1.. Gene expression profiling and ChIP-Seq analysis of qHSCs, aHSCs, and iHSCs.
(A) qHSCs, aHSCs, iHSCs were sort purified from livers of Col1α2YFP mice and subjected to gene expression microarray. (B) Expression of selected genes is shown. (C) Heatmap displaying relative expression of transcription factor (TF) mRNA levels depending on activation status of HSCs. (D-F) qHSCs, aHSCs, iHSCs were sort purified from livers of Col1α1YFP mice and subjected to gene expression microarray. ChIP-Seq analysis of (10 d and 1 mo): (D) Heatmap and clustering analysis of relative changes in H3K4me2 levels at H3K4me2 promoter-distal peaks. Clusters 1–6-mark major clusters of H3K4me2 peaks with clear regulatory patterns. (E) Heatmap depicting the relative TF motif enrichment at H3K4me2 peaks (± 500 bp) associated with each of the clusters from (D) relative to random genomic regions. (F) Heatmap displaying clustering analysis of the dynamic regulation of H3K27ac-defined enhancers, showing the relative changes in H3K27ac levels, the top five TFs enriched at enhancers in the cluster, and the most enriched pathways associated with the genes located closest to the enhancers defined in each cluster.
Figure 2.
Figure 2.. Analysis of H3K4me2 and H3K27ac binding sites identified HSC lineage-specific TFs in mouse HSCs.
(A) Heatmap showing clustering analysis of the top 20 TF motifs enriched at the most-changing H3K4me2- and H3K27ac-marked genomic locations in qHSCs, aHSCs, and iHSCs (10 d and 1 mo). (B) Super enhancer plot depicting the normalized level of H3K27ac signal at enhancers relative to the enhancer rank (sorted by H3K27ac levels, super enhancers defined where the slope exceeds a value of 1). Super enhancers found near key genes or transcription factors are indicated with the rank of the super enhancer in parentheses. (C) H3K4me2 and H3K27ac signal at the ETS1 gene/super-enhancer in HSCs. (D) Sequence logos corresponding to enriched sequence elements of HSC lineage-specific TFs identified by de novo motif analysis (enriched over background >10−100). (E) mRNA expression of HSC lineage-specific TFs in Astrocytes activated Portal Fibroblasts (PFs), and HSCs (p<0.05).
Figure 3.
Figure 3.. shRNA-knockdown of putative lineage-specific TFs and relationship.
(A) Primary HSCs (1 × 10⁶ cells) were infected with TF-specific shRNA- or non-targeting lentiviruses, followed by ± puromycin (5μg/ml) selection. >2 targeted and control vectors were tested). The data are representative of > 3 independent experiments, p<0.03 (see Table 1, see Suppl. Table 2). (B-C) qRT-PCR of gene expression of targeted HSCs, in which (B) individual HSC lineage-determining TF (C) or their families were shRNA-knocked down (vs CTRL1, infected with x 1 or x 2 non-coding viruses). mRNA expression of targeted HSCs was compared to control HSCs, * p < 0.05, ** p < 0.01, *** p < 0.001, student’s One-way ANOVA. (D) RNA-Seq: expression of selected genes in ETS1-knockdown HSCs (vs CTRL1), * p < 0.05, ** p < 0.01, *** p < 0.001, student’s t test. (E) Cross regulation between TFs (is based on the combined qRT-PCR/RNA-Seq analysis of the TF expression in targeted HSCs, (B-C, E) fold change, * p < 0.05, ** p < 0.01, *** p < 0.001, student’s One-way ANOVA.
Figure 4.
Figure 4.. shRNA-knockdown of putative lineage-specific TFs and their families caused over-activation of targeted HSCs.
(A-B) RNA-Seq-based heatmap analysis of expression of (A) all genes (arranged in rows by hierarchical clustering), or (B) selected genes in shRNA-targeted HSCs (vs CTRL1). Relative expression HSC function-specific genes are shown. (C) Gene Ontology/Pathway enrichment across sets of genes either induced (grey) or repressed (yellow) by shRNA targeting of key TFs or their families (vs CTRL1) was performed using Metascape software. (D-E) Expression of fibrogenic/inflammatory genes in targeted HSCs, in which each individual HSC lineage-determining TF (D) or their families (E) were shRNA-knocked down (vs CTRL1). (F-G) Expression of NF1 and PPARγ in HSCs (Whole Mouse Genome Microarray, * p < 0.05, ** p < 0.01, *** p < 0.001, student’s One-way ANOVA).
Figure 5.
Figure 5.. Deletion of GATA6, ETS1+/− and NF1 in HSCs exacerbates development of liver fibrosis in CCl4-injured LratΔGATA6, LratETS1+/−and LratΔNF1 mice.
(A) Livers from uninjured or CCl4-injured LratCre, LratΔGATA6, LratETS1+/− and LratΔNF1 mice (n=8–12/group) were analyzed by immunohistochemistry, representative micrographs (x 4 objective), positive area was quantified as percent. (B-D) Livers from (B) LratCre and LratΔGATA6, (C) livers and aHSCs from LratCre and LratETS1+/−, (D) LratCre and LratΔNF1 were analyzed by qRT-PCR, * p < 0.05, ** p < 0.01, *** p < 0.001, student’s t test.
Figure 6.
Figure 6.. Deletion of PPARγ in HSCs facilitates development of liver fibrosis and prevents fibrosis regression in LratΔPPARγ mice.
(A) qHSC isolated from LratCre and LratΔPPARγ mice were analyzed by qRT-PCR. * p < 0.05, ** p < 0.01, *** p < 0.001, student’s t test. (B) Livers from LratCre (wt) and LratΔPPARγ mice (n=8–12/group), uninjured, CCl4-injured, or after CCl4 cessation (1 mo) analyzed by immunohistochemistry (micrographs x 4, and x 10 objectives); (C) Positive staining areas were quantified. Livers were analyzed by qRT-PCR. (D) CCl4-injured wt mice (C57Bl/6, n=8–12/group) were treated with rosiglitazone (5 mg/kg, daily) or vehicle for 2 weeks after CCl4 cessation. (E) Livers were analyzed by immunohistochemistry (positive area was quantified), or (F) by qRT-PCR (G) qHSCs, aHSCs, and iHSCs were isolated from LratCre (wt) and LratΔPPARγ mice (n=8–12/group: uninjured, CCl4-injured, or treated with rosiglitazone (5 mg/kg, daily) or vehicle for 2 weeks after CCl4 cessation) and analyzed by qRT-PCR. * p < 0.05, ** p < 0.01, *** p < 0.001, student’s one-way ANOVA. (H) Primary LratCre (wt) and LratNF1-deficient qHSCs (5 × 10⁵ cells) were treated with TGFβ1 (5 ng/ml, 24 h) ± rosiglitazone (20 μM, or vehicle), analyzed by qRT-PCR, * p < 0.05, ** p < 0.01, *** p < 0.001, student’s one-way ANOVA.
Figure 7.
Figure 7.. Identification of the lineage-determining TFs in human HSCs.
(A) PKH26-labeled TGFβ1-activated human HSCs (1 × 10⁶ cells) were intrahepatically injected into Rag2−/−γc−/− pups (1 day old). Livers analyzed by immunohistochemistry or fluorescent microscopy (x 10 objectives or x40). (B) Sort purified. Input and recovered human iHSCs were analyzed by qRT-PCR * p < 0.05, ** p < 0.01, *** p < 0.001, student’s t test. (C) Heatmap depicting enrichment for known transcription factor motifs in H3K27ac and H3K4me2 peaks in human and mouse HSC enhancer repertoires. (D) Super enhancer hockey stick plot depicting the normalized level of H3K27ac signal at enhancers as a function of the enhancer rank for human HSC. (E) Normalized RNA-seq and H3K27ac/H3K4me2 ChIP-seq read densities from primary human HSCs are depicted at the ETS1 locus in the human genome (hg38). (F-G) Human HSCs were treated with ± TGFβ1 (5 ng/ml, 24 h) (F) ± rosiglitazone (20nM, or vehicle) (G), and analyzed by qRT-PCR, *p < 0.05, ** p < 0.01, *** p < 0.001, student’s t test and one-way ANOVA.

References

    1. Kisseleva T, Cong M, Paik Y, et al. Myofibroblasts revert to an inactive phenotype during regression of liver fibrosis. Proc Natl Acad Sci U S A 2012;109:9448–53. - PMC - PubMed
    1. Iredale JP, Benyon RC, Pickering J, et al. Mechanisms of spontaneous resolution of rat liver fibrosis. Hepatic stellate cell apoptosis and reduced hepatic expression of metalloproteinase inhibitors. J Clin Invest 1998;102:538–49. - PMC - PubMed
    1. Troeger JS, Mederacke I, Gwak GY, et al. Deactivation of hepatic stellate cells during liver fibrosis resolution in mice. Gastroenterology 2012;143:1073–83 e22. - PMC - PubMed
    1. Heintzman ND, Stuart RK, Hon G, et al. Distinct and predictive chromatin signatures of transcriptional promoters and enhancers in the human genome. Nat Genet 2007;39:311–8. - PubMed
    1. Heinz S, Benner C, Spann N, et al. Simple combinations of lineage-determining transcription factors prime cis-regulatory elements required for macrophage and B cell identities. Mol Cell 2010;38:576–89. - PMC - PubMed

Publication types

MeSH terms