. 2020 Mar 15:430:34-46.
doi: 10.1016/j.neuroscience.2020.01.013. Epub 2020 Jan 23.

Unisensory and Multisensory Responses in Fetal Alcohol Spectrum Disorders (FASD): Effects of Spatial Congruence

Affiliations

Unisensory and Multisensory Responses in Fetal Alcohol Spectrum Disorders (FASD): Effects of Spatial Congruence

Brian A Coffman et al. Neuroscience. .

Abstract

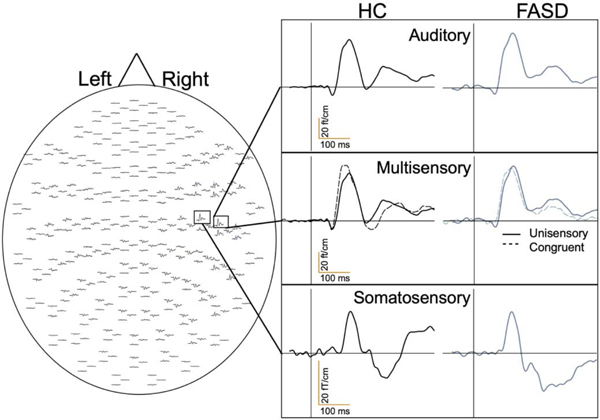
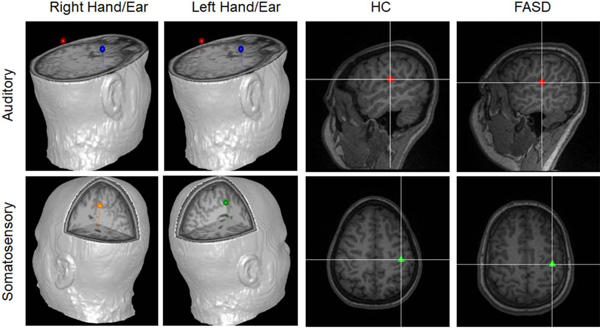
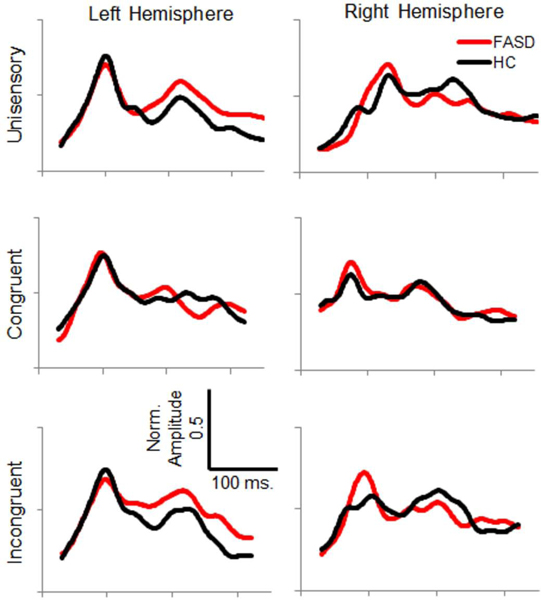
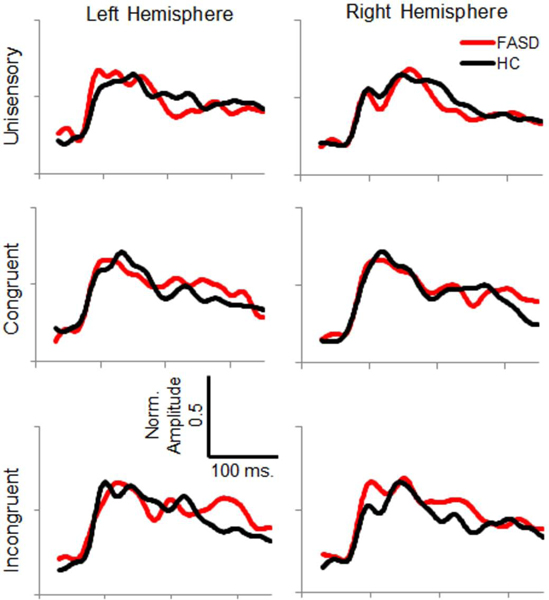
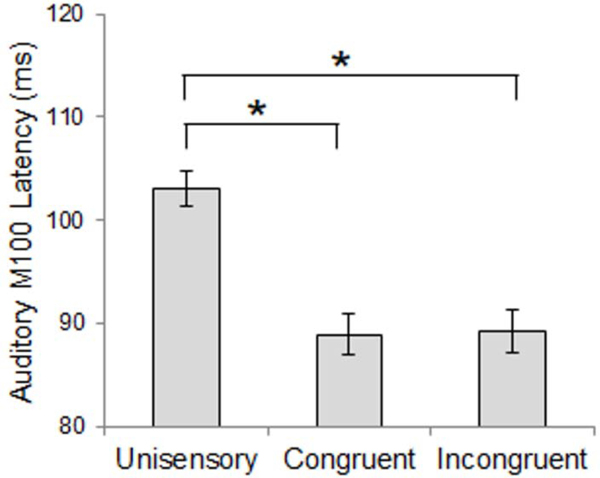
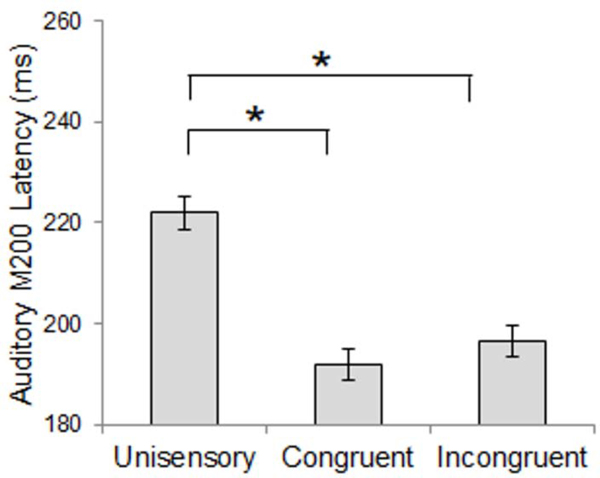
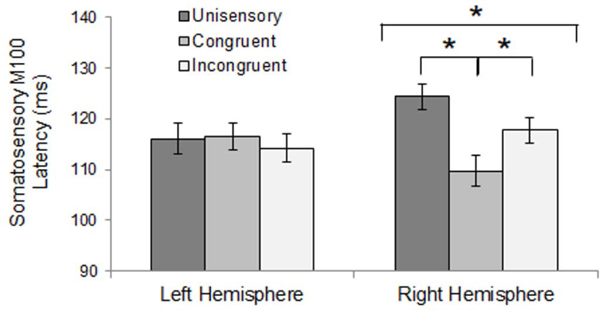
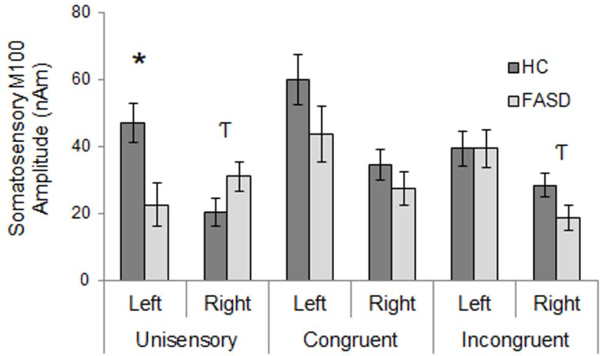
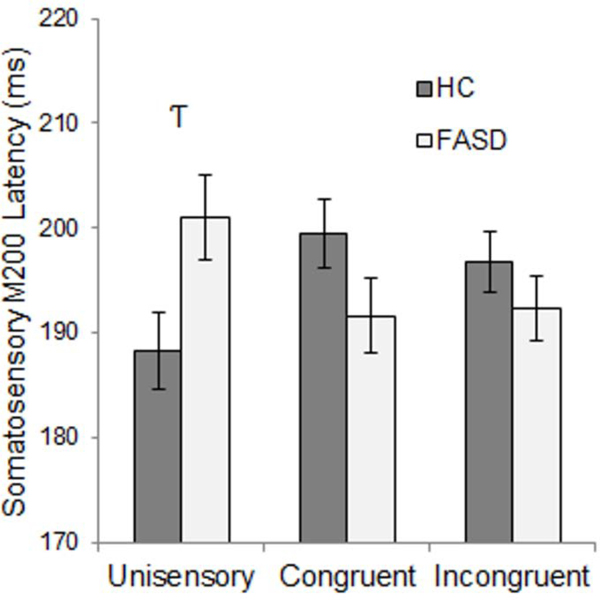
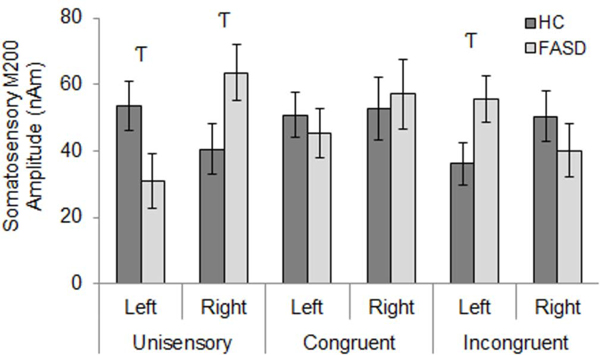
While it is generally accepted that structural and functional brain deficits underlie the behavioral deficits associated with Fetal Alcohol Spectrum Disorders (FASD), the degree to which these problems are expressed in sensory pathology is unknown. Electrophysiological measures indicate that neural processing is delayed in visual and auditory domains. Furthermore, multiple reports of white matter deficits due to prenatal alcohol exposure indicate altered cortical connectivity in individuals with FASD. Multisensory integration requires close coordination between disparate cortical areas leading us to hypothesize that individuals with FASD will have impaired multisensory integration relative to healthy control (HC) participants. Participants' neurophysiological responses were recorded using magnetoencephalography (MEG) during passive unisensory or simultaneous, spatially congruent or incongruent multisensory auditory and somatosensory stimuli. Source timecourses from evoked responses were estimated using multi-dipole spatiotemporal modeling. Auditory M100 response latency was faster for the multisensory relative to the unisensory condition but no group differences were observed. M200 auditory latency to congruent stimuli was earlier and congruent amplitude was larger in participants with FASD relative to controls. Somatosensory M100 response latency was faster in right hemisphere for multisensory relative to unisensory stimulation in both groups. FASD participants' somatosensory M200 responses were delayed by 13 ms, but only for the unisensory presentation of the somatosensory stimulus. M200 results indicate that unisensory and multisensory processing is altered in FASD; it remains to be seen if the multisensory response represents a normalization of the unisensory deficits.

Keywords: Fetal Alcohol Spectrum Disorders; auditory; magnetoencephalography; multisensory integration; somatosensory.


Conflict of interest statement

None of the authors have potential conflicts of interest to be disclosed.

Figures

Figure 1:
Figure 1:
Representative MEG Sensor-Based Group Averaged Timecourses. The MEG sensor array and group-averaged sensor-based timecourses are shown to demonstrate average auditory responses, unisensory auditory with congruent multisensory responses, and somatosensory responses within the right hemisphere for healthy controls (HC) and participants with fetal alcohol spectrum disorder (FASD).
Figure 2:
Figure 2:
Source Locations. Example source locations are shown for auditory (upper panels) and somatosensory (lower panels) responses to stimuli presented to (from left to right) the right sensory hemifield, left sensory hemifield, a HC participant, and a FASD participant. HC and FASD examples are in response to stimuli presented to the left sensory hemifield. Dipole locations corresponding for left hemisphere auditory responses are shown in red, right hemisphere auditory responses are shown in blue, left hemisphere somatosensory responses are shown in orange and right hemisphere somatosensory responses are shown in red.
Figure 3:
Figure 3:
Average Normalized Auditory Source Timecourses – Timecourse of primary auditory cortex source activity is shown for healthy controls (HC, black) and participants with FASD (red) for each stimulation condition and hemisphere.
Figure 4:
Figure 4:
Average Normalized Somatosensory Source Timecourses – Timecourse of primary somatosensory cortex source activity is shown for healthy controls (HC, black) and participants with FASD (red) for each stimulation condition and hemisphere.
Figure 5:
Figure 5:
Auditory M100 Latency – Stimulus Condition Effect. M100 responses were earlier for multisensory stimuli compared to unisensory stimuli. Data shown are collapsed across participant groups. Asterisks represent significant differences (p<0.05).
Figure 6:
Figure 6:
Auditory M200 Latency – Stimulus Condition Effect. M200 responses were earlier for multisensory stimuli compared to unisensory stimuli. Data shown are collapsed across participant groups. Asterisks represent significant differences (p<0.05).
Figure 7:
Figure 7:
Somatosensory M100 Latency – Hemisphere x Stimulus Condition Interaction. Right hemisphere M100 response latency was earlier for congruent multisensory stimuli than unisensory or incongruent stimuli. No effect of stimulus condition was found for left hemisphere. Asterisks represent significant differences (p<0.05).
Figure 8:
Figure 8:
Somatosensory M100 Amplitude – Group x Stimulus Condition x Hemisphere Interaction. Responses were generally reduced for FASD compared to HC, with the exception of right hemisphere responses to unisensory stimuli which were greater amplitude for FASD compared to HC. Asterisks represent significant differences (p<0.05, corrected). Hooked T’s represent trend-level effects (p<0.1, uncorrected).
Figure 9:
Figure 9:
Somatosensory M200 Latency – Group x Stimulus Condition Interaction. Response latency differences between healthy controls (HC) and participants with FASD were greater for unisensory and congruent multisensory stimuli, however, these differences were trend-level effects. Hooked T’s represent trend-level effects (p<0.1, uncorrected).
Figure 10:
Figure 10:
Somatosensory M200 Amplitude – Group x Stimulus Condition x Hemisphere Interaction. Left hemisphere responses to unisensory stimuli were reduced in FASD compared to HC, while right hemisphere responses to unisensory stimuli and left hemisphere responses to incongruent multisensory stimuli were increased in FASD relative to HC. Hooked T’s represent trend-level effects (p<0.1, uncorrected).

References

    1. Aine C, Huang M, Stephen J, Christner R (2000) Multistart algorithms for MEG empirical data analysis reliably characterize locations and time courses of multiple sources. NeuroImage 12:159–172. - PubMed
    1. Bhuvaneswar C, Chang G, Epstein L, Stern T (2007) Alcohol use during pregnancy: Prevalence and Impact. Prim Care Companion J Clin Psychiatry 9:455–460. - PMC - PubMed
    1. Bjuland KJ, Lohaugen GC, Martinussen M, Skranes J (2013) Cortical thickness and cognition in very-low-birth-weight late teenagers. Early Hum Dev 89:371–380. - PubMed
    1. Brandwein AB, Foxe JJ, Butler JS, Frey HP, Bates JC, Shulman LH, Molholm S (2015) Neurophysiological indices of atypical auditory processing and multisensory integration are associated with symptom severity in autism. J Autism Dev Disord 45:230–244. - PMC - PubMed
    1. Brett-Green BA, Miller LJ, Gavin WJ, Davies PL (2008) Multisensory integration in children: a preliminary ERP study. Brain Res 1242:283–290. - PMC - PubMed

Publication types