. 2020 Mar 6:19:877-889.
doi: 10.1016/j.omtn.2019.12.022. Epub 2020 Jan 9.

Effects of miR-34b/miR-892a Upregulation and Inhibition of ABCB1/ABCB4 on Melatonin-Induced Apoptosis in VCR-Resistant Oral Cancer Cells

Affiliations

Effects of miR-34b/miR-892a Upregulation and Inhibition of ABCB1/ABCB4 on Melatonin-Induced Apoptosis in VCR-Resistant Oral Cancer Cells

Ming-Ju Hsieh et al. Mol Ther Nucleic Acids. .

Abstract

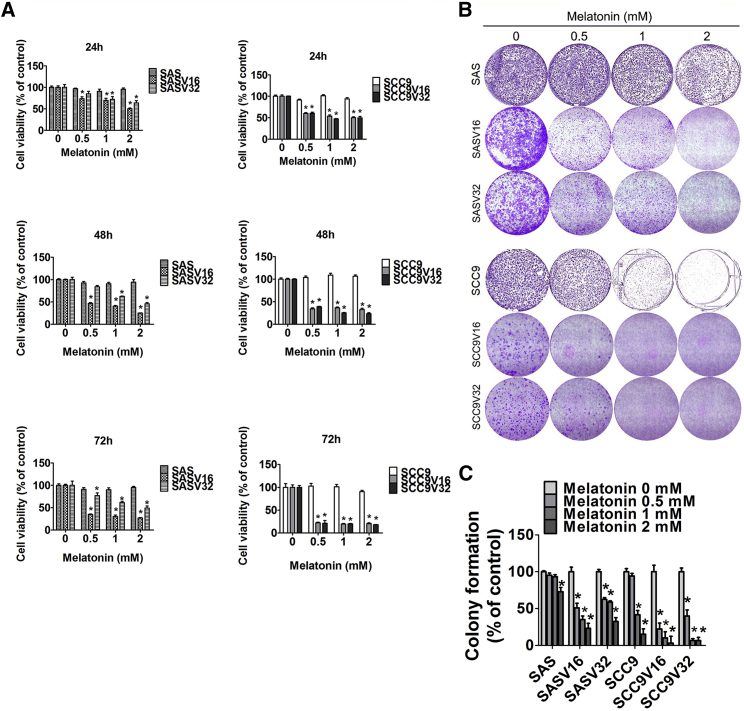
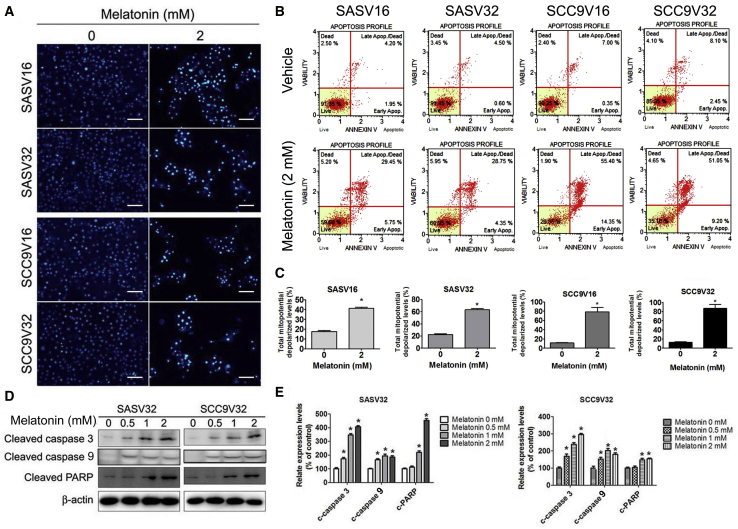
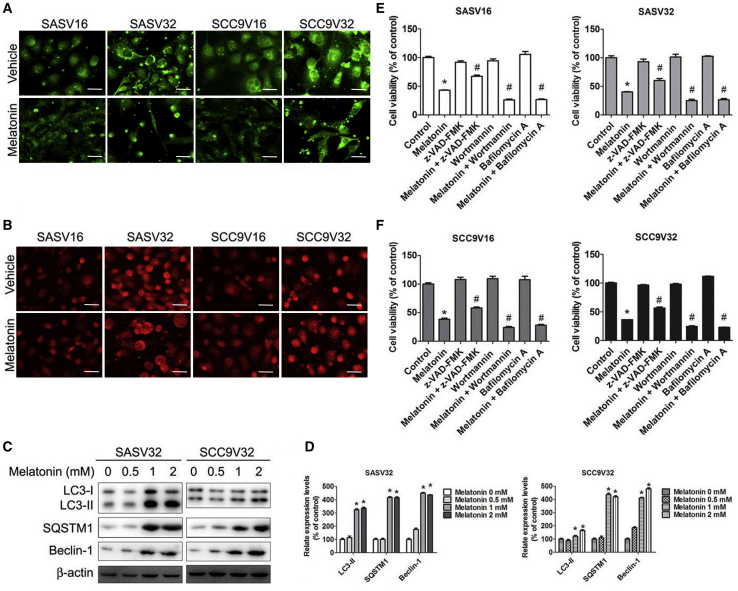
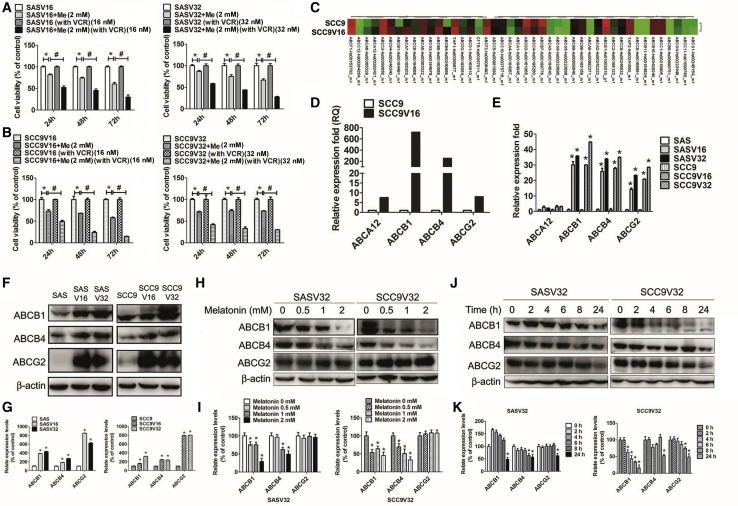
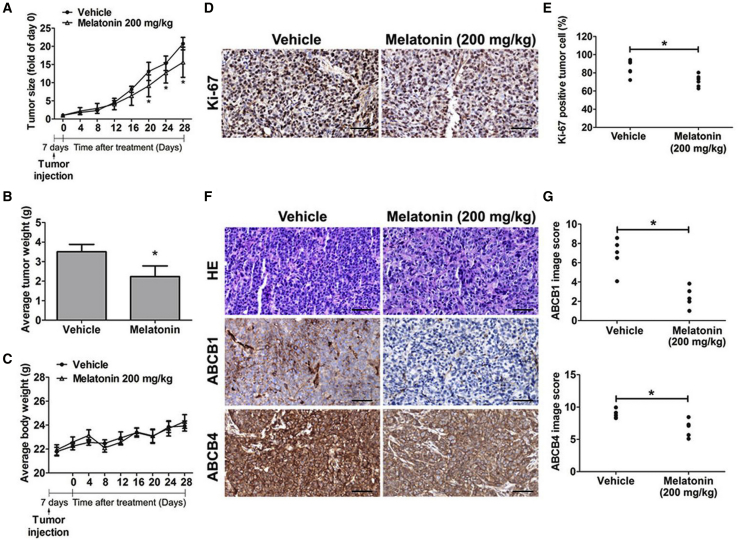
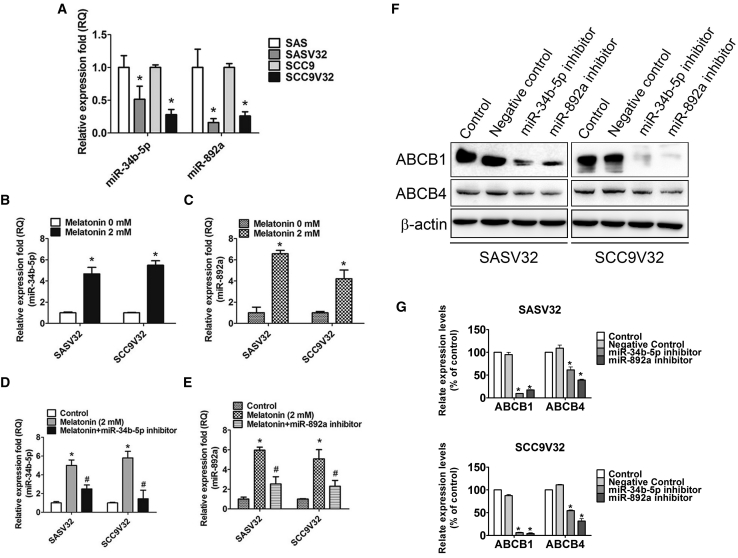
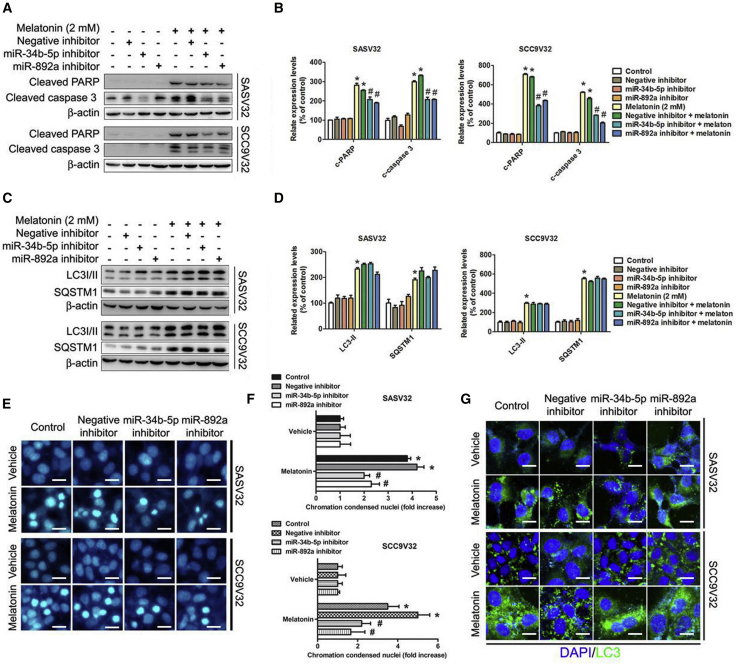
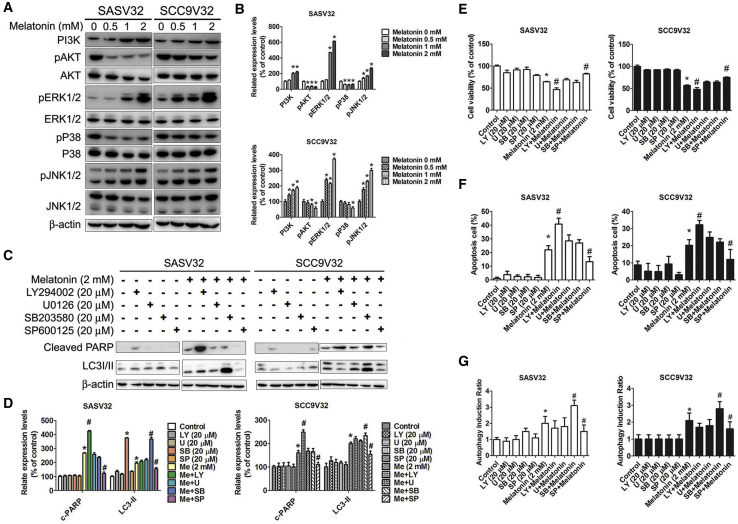
Multidrug resistance (MDR) is the resistance of cells toward various drugs commonly used in tumor treatment. The mechanism of drug resistance in oral cancer is not completely understood. Melatonin is an endogenously produced molecule involved in active biological mechanisms including antiproliferation, oncogene expression modulation, antitumor invasion and migration, and anti-inflammatory, antioxidant, and antiangiogenic effects. Despite these functions, the effects of melatonin on vincristine (VCR)-resistant human oral cancer cells remain largely unknown. This study analyzed the role of melatonin in VCR-resistant human oral cancer cells along with the underlying mechanism. We determined that melatonin induced the apoptosis and autophagy of VCR-resistant oral cancer cells; these actions were mediated by AKT, p38, and c-Jun N-terminal kinase (JNK). Melatonin inhibited ATP-binding cassette B1 (ABCB1) and ABCB4 expression in vitro and in vivo. Melatonin reduced the drug resistance and promoted the apoptosis of VCR-resistant oral cancer cells through the upregulation of microRNA-892a (miR-892a) and miR-34b-5p expressions. The expression of miR-892a and miR-34b-5p was related to melatonin-induced apoptosis, but not autophagy. Therefore, melatonin is a potential novel chemotherapeutic agent for VCR-resistant human oral cancer cell lines.

Keywords: P-glycoprotein; apoptosis; autophagy; melatonin; microRNA; multi-drug resistance.


Figures

Figure 1
Figure 1
The Influence of Melatonin on Cell Cytotoxicity in VCR-Resistant Oral Cancer Cells (A) Two oral cancer cells (SAS and SCC9) and four VCR-resistant oral cancer cell lines (SASV16, SASV32, SCC9V16, and SCC9V32) were treated with different concentrations of melatonin and analyzed by MTT assay. (B) Four VCR-resistant oral cancer cells were treated with melatonin for 2 weeks. (C) The formazan crystals were restored by DMSO, and the absorbance was measured. The experiments were repeated at least three times. Values are presented as the mean ± SE of three independent experiments. *p < 0.05, compared with the control group.
Figure 2
Figure 2
The Influence of Melatonin on Cell Apoptosis in VCR-Resistant Oral Cancer Cells (A) Four VCR-resistant oral cancer cells were treated with melatonin (2 mM) for 24 h, and then DAPI staining. (B) Apoptosis cells were measured by Muse Cell Analyzer Assays. (C) Mitochondrial membrane potential was performed by Muse Cell Analyzer Assays. (D) The expression change of cleaved caspase-3, −9, and PARP were analyzed by specific primary antibody, respectively. (E) Bar graphs represent the relative density of each band normalized to β-actin. The experiments were repeated at least three times. Values are presented as the mean ± SE of three independent experiments. *p < 0.05, compared with the control group.
Figure 3
Figure 3
Melatonin Causes Autophagy in VCR-Resistant Oral Cancer Cells (A) Four VCR-resistant oral cancer cells were treated with vehicle or melatonin (2 mM) for 24 h, and then cells were stained with Cell Meter Autophagy Assay Kit fluorescent dye. After staining, cells were observed under a fluorescence microscope, which is an indicator of autophagosome formation. (B) After treatment, cells were stained with acridine orange (AO) for acidic vesicular organelles (AVOs) formation, which was examined under a fluorescence microscope. The amount of AVOs (orange-red fluorescence) can be used as a marker of autophagosomes. (C) A representative western blot for expression of LC3-I/II, SQSTM1, and Beclin-1 in cells were treated with increasing concentrations of melatonin. (D) Bar graphs represent the relative density of each band normalized to β-actin. (E) SASV16 and SASV32 oral cancer cells were pretreated with z-VAD-FMK (20 μM), wortmannin (50 μM), or bafilomycin A (1 nM) for 2 h followed by treatment with or without melatonin (2 mM) for 24 h. (F) SCC9V16 and SCC9V32 oral cancer cells were pretreated with z-VAD-FMK (20 μM), wortmannin (50 μM), or bafilomycin A (1 nM) for 2 h followed by treatment with or without melatonin (2 mM) for 24 h. Cell viability was analyzed by MTT assay. The experiments were repeated at least three times. Results are shown as mean ± SEM. *p < 0.05, compared with the control group. #p < 0.05, compared with the only melatonin group.
Figure 4
Figure 4
The Influence of Melatonin on ABCB1 and ABCB4 Expression in VCR-Resistant Oral Cancer Cells (A and B) (A) SASV16 and SASV32 and (B) SCC9V16 and SCC9V32 oral cancer cells were treated with/without melatonin (2 mM) in conditioned medium (with/without VCR) (16 nM or 32 nM), and then analyzed by MTT assay. (C) Heatmap depiction of ABC transporter superfamily gene differentially expressed between SCC9 cells versus SCC9V16 cells, analyzed by gene-expression array plates. (D) Average expression fold change in ABC transporter superfamily gene expression. (E) Quantified PCR validation of differentially expressed genes between oral cancer cells and VCR-resistant oral cancer cells selected from the microarray analysis. (F) The expression of ABCB1, ABCB4, and ABCG2 between oral cancer cells and VCR-resistant oral cancer cells. (G) Bar graphs represent the relative density of each band normalized to β-actin. (H) The expression of ABCB1, ABCB4, and ABCG2 was treated with melatonin (0.5–2 mM). (I) Bar graphs represent the relative density of each band normalized to β-actin. (J) Cells were incubated with melatonin (2 mM) for the indicated time intervals and the expression levels of ABCB1, ABCB4, and ABCG2 were examined by western blot. (K) Bar graphs represent the relative density of each band normalized to β-actin. All experiments were repeated at least three times. Results are shown as mean ± SEM. *p < 0.05, compared with the control group. #p < 0.05, compared with the only melatonin group.
Figure 5
Figure 5
The Influence of Melatonin on Anti-Tumor Growth In Vivo After injection, nude mice were received treatment with melatonin (200 mg/kg). (A–C) The difference changes of (A) tumor size, (B) average tumor weight, or (C) mice body weight are shown. (D) Ki67-positive cells were counted at 200× magnification per tumor section. (E) A quantified value of the Ki67-positive tumor cells expression percentage. (F) Tumor tissues were detected by H&E staining (upper panel) and anti-ABCB1, -ABCB4 IHC staining. Original magnifications: 200×. (G) The ABCB1 (upper panel) and ABCB4 (lower panel) image score is indicated by counting the number of cells. Results are shown as mean ± SEM. *p < 0.05, compared to the vehicle groups.
Figure 6
Figure 6
Melatonin Induces miR-34b-5p and miR-892a Expression (A) miR-34b-5p and miR-892a expression changes between oral cancer cells and VCR-resistant oral cancer cells were confirmed by real-time PCR. (B and C) After incubation with melatonin (2 mM) for 24 h, (B) miR-34b-5p and (C) miR-892a were examined by real-time PCR. (D and E) After transfection with (D) miR-34b-5p inhibitor (1 μM) or (E) miR-892a inhibitor (1 μM) for 24 h, following melatonin treatment for an extra 24 h. The miR-34b-5p and miR-892a expression changes were confirmed by real-time PCR. (F) After transfection with miR-34b-5p inhibitor (1 μM) or miR-892a inhibitor (1 μM) for 24 h, the expression levels of ABCB1 and ABCB4 were examined by western blot. (G) Bar graphs represent the relative density of each band normalized to β-actin. All experiments were repeated at least three times. Results are shown as mean ± SEM. *p < 0.05, compared with the control group. #p < 0.05, compared with the only melatonin group.
Figure 7
Figure 7
Relationship of miR-34b-5p and miR-892a with Melatonin-Induced Apoptosis and Autophagy (A) After transfection with miR-34b-5p inhibitor (1 μM) or miR-892a inhibitor (1 μM) for 24 h, melatonin (2 mM) treatment for an extra 24 h. Protein expression were detected by specific primary antibody, respectively. (B) Bar graphs represent the relative density of each band normalized to β-actin. (C) Cells were transfected with miR-34b-5p inhibitor (1 μM) or miR-892a inhibitor (1 μM) for 24 h, and then melatonin (2 mM) treatment for an extra 24 h. Protein expression was detected by specific primary antibody, respectively. (D) Bar graphs represent the relative density of each band normalized to β-actin. (E) After treatment, cells were fixed and stained with DAPI solution. Nuclear fragmentation and condensation were observed under fluorescence microscope. (F) Bar graphs represent the relative density of nuclear fragmentation and condensation. (G) Results were examined under a confocal microscope. All experiments were repeated at least three times. Results are shown as mean ± SEM. *p < 0.05, compared with the control group. #p < 0.05, compared with the only melatonin (2 mM) group.
Figure 8
Figure 8
The Effect of Melatonin-Induced Apoptosis and Autophagy on Activation of AKT and MAPKs in VCR-Resistant Oral Cancer Cells (A) The expression change of PI3K, AKT, p38, ERK1/2, and JNK1/2 in cells. (B) Bar graphs represent the relative density of each band normalized to β-actin. (C) Cells were pretreated with LY (LY294002), U (U0126), SB (SB203580), or SP (SP600125), and then treated with melatonin for 24 h. Effects of the inhibition of AKT, ERK1/2, p38, and JNK1/2 were assessed by specific primary antibody, respectively. (D) Bar graphs represent the relative density of each band normalized to β-actin. (E) Living cells were detected by MTT assay. (F and G) Apoptosis cells (F) and autophagy induction (G) ratio were detected by Muse Cell Analyzer Assays. All experiments were repeated at least three times. Results are shown as mean ± SEM. *p < 0.05, compared with the control group. #p < 0.05, compared with the only melatonin (2 mM) group.

References

    1. Torre L.A., Bray F., Siegel R.L., Ferlay J., Lortet-Tieulent J., Jemal A. Global cancer statistics, 2012. CA Cancer J. Clin. 2015;65:87–108. - PubMed
    1. Su S.C., Lin C.W., Liu Y.F., Fan W.L., Chen M.K., Yu C.P., Yang W.E., Su C.W., Chuang C.Y., Li W.H. Exome Sequencing of Oral Squamous Cell Carcinoma Reveals Molecular Subgroups and Novel Therapeutic Opportunities. Theranostics. 2017;7:1088–1099. - PMC - PubMed
    1. Yang S.F., Huang H.D., Fan W.L., Jong Y.J., Chen M.K., Huang C.N., Chuang C.Y., Kuo Y.L., Chung W.H., Su S.C. Compositional and functional variations of oral microbiota associated with the mutational changes in oral cancer. Oral Oncol. 2018;77:1–8. - PubMed
    1. Chien M.H., Lin C.W., Cheng C.W., Wen Y.C., Yang S.F. Matrix metalloproteinase-2 as a target for head and neck cancer therapy. Expert Opin. Ther. Targets. 2013;17:203–216. - PubMed
    1. Granzotto M., Rapozzi V., Decorti G., Giraldi T. Effects of melatonin on doxorubicin cytotoxicity in sensitive and pleiotropically resistant tumor cells. J. Pineal Res. 2001;31:206–213. - PubMed