. 2020 Apr:205:110994.
doi: 10.1016/j.jinorgbio.2020.110994. Epub 2020 Jan 13.

Multiple drug binding modes in Mycobacterium tuberculosis CYP51B1

Affiliations

Multiple drug binding modes in Mycobacterium tuberculosis CYP51B1

Molly M Lockart et al. J Inorg Biochem. 2020 Apr.

Abstract

The Mycobacterium tuberculosis (Mtb) genome encodes 20 different cytochrome P450 enzymes (CYPs), many of which serve essential biosynthetic roles. CYP51B1, the Mtb version of eukaryotic sterol demethylase, remains a potential therapeutic target. The binding of three drug fragments containing nitrogen heterocycles to CYP51B1 is studied here by continuous wave (CW) and pulsed electron paramagnetic resonance (EPR) techniques to determine how each drug fragment binds to the heme active-site. All three drug fragments form a mixture of complexes, some of which retain the axial water ligand from the resting state. Hyperfine sublevel correlation spectroscopy (HYSCORE) and electron-nuclear double resonance spectroscopy (ENDOR) observe protons of the axial water and on the drug fragments that reveal drug binding modes. Binding in CYP51B1 is complicated by the presence of multiple binding modes that coexist in the same solution. These results aid our understanding of CYP-inhibitor interactions and will help guide future inhibitor design.

Keywords: Cytochrome P450; EPR; HYSCORE; Mycobacterium tuberculosis.


Conflict of interest statement

Declaration of competing interest The authors declare that they have no conflicts of interest.

Figures

Figure 1:
Figure 1:
Comparison of low-spin CYP binding modes. Left: resting state enzyme; middle: PPT has replaced the water as the axial ligand, resulting in a directly-coordinated complex; right: PPT forms a hydrogen bond to the axial water, resulting in a water-bridged complex.
Figure 2:
Figure 2:
CW EPR Spectra of CYP51B1 with no drug added (solid), and with PPT (dashes), 17-click (short dots), and 1,2,3-TRZ (dots) added. The gx, gy, and gz regions of the spectra are labeled.
Figure 3:
Figure 3:
HYSCORE spectrum of resting state CYP51B1 with no drug added at 295.5 mT.
Figure 4:
Figure 4:
CW EPR spectrum (solid line) and simulation (dotted line) of CYP51B1 bound to PPT. Bottom: the first-derivative spectrum and simulation consisting of three spectral components: component 1 (dashes), component 2 (short dots), and component 3 (short dashes). Top: The simulated spectral components plotted as absorbance rather than first-derivative to better visualize their overlap.
Figure 5:
Figure 5:
HYSCORE spectra of CYP51B1 with PPT at 280.5 mT (left) showing only the cysteine 1H and 297.0 mT (right) showing the cysteine 1H and the axial water 1H.
Figure 6:
Figure 6:
HYSCORE peak arc fits for each sample. Each plot represents frequency coordinates of points chosen along water proton HYSCORE arcs at several magnetic fields up to 300.0 mT. The points at each field are shifted to where they would appear at a common magnetic field of 293.5 mT and are fit using Eqs. 1–3 (solid line) to determine the hyperfine coupling parameters and the distance from the water protons to the heme.
Figure 7:
Figure 7:
The angles φ and θ with respect to the active site heme.
Figure 8:
Figure 8:
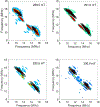
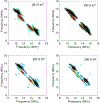
HYSCORE simulations of resting state CYP51B1 with no drug added at 288.0 mT, 291.0 mT, 295.5 mT, and 300.0 mT. HYSCORE peaks are shown in color and simulations are shown as black contour lines.
Figure 9:
Figure 9:
HYSCORE spectra and simulations of CYP51B1 in complex with PPT at 219.0 mT, 294.0 mT, 297.0 mT, and 300.0 mT. HYSCORE peaks are shown in color and simulations are shown as black contour lines.
Figure 10:
Figure 10:
HYSCORE spectra and simulations of CYP51B1 with 17-click at 291.0 mT, 296.5 mT, 298.0 mT, and 300.0 mT. HYSCORE peaks are shown in color and simulations are shown as black contour lines.
Figure 11:
Figure 11:
HYSCORE simulations of CYP51B1 with 1,2,3-TRZ at 290.0 mT, 294.0 mT, 297.0 mT, and 300.0 mT. HYSCORE peaks are shown in color and simulations are shown as black contour lines.
Figure 12:
Figure 12:
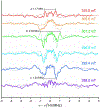
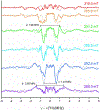
Mims difference ENDOR spectra of CYP51B1 with 1,2,3-TRZ. Peak splittings used to calulate distances are labeled.
Figure 13:
Figure 13:
Mims difference ENDOR spectra of CYP51B1 with 17-click. Peak splittings used to calulate distances are labeled.
Figure 14:
Figure 14:
Mims difference ENDOR spectra of CYP51B1 with PPT. Peak splittings used to calulate distances are labeled.

References

    1. Ouellet H, Johnston JB, Ortiz de Montellano PR, The Mycobacterium tuberculosis cytochrome P450 system, Arch. Biochem. Biophys, 493 (2010) 82–95. - PMC - PubMed
    1. McLean KJ, Warman AJ, Seward HE, Marshall KR, Girvan HM, Cheesman MR, Waterman MR, Munro AW, Biophysical characterization of the sterol demethylase P450 from Mycobacterium tuberculosis, its cognate ferredoxin, and their interactions, Biochemistry, 45 (2006) 8427–8443. - PubMed
    1. Bellamine A, Mangla AT, Nes WD, Waterman MR, Characterization and catalytic properties of the sterol 14alpha-demethylase from Mycobacterium tuberculosis, Proc. Natl. Acad. Sci. U. S. A, 96 (1999) 8937–8942. - PMC - PubMed
    1. Ortiz de Montellano PR, Potential drug targets in the Mycobacterium tuberculosis cytochrome P450 system, J. Inorg. Biochem, 180 (2018) 235–245. - PMC - PubMed
    1. Conner KP, Cruce AA, Krzyaniak MD, Schimpf AM, Frank DJ, Ortiz de Montellano P, Atkins WM, Bowman MK, Drug modulation of water-heme interactions in low-spin P450 complexes of CYP2C9d and CYP125A1, Biochemistry, 54 (2015) 1198–1207. - PMC - PubMed

Publication types

MeSH terms

Substances