. 2020 Jan;25(1):1-14.
doi: 10.1117/1.JBO.25.1.014513.

Factors associated with obesity alter matrix remodeling in breast cancer tissues

Affiliations

Factors associated with obesity alter matrix remodeling in breast cancer tissues

Yang Zhang et al. J Biomed Opt. 2020 Jan.

Abstract

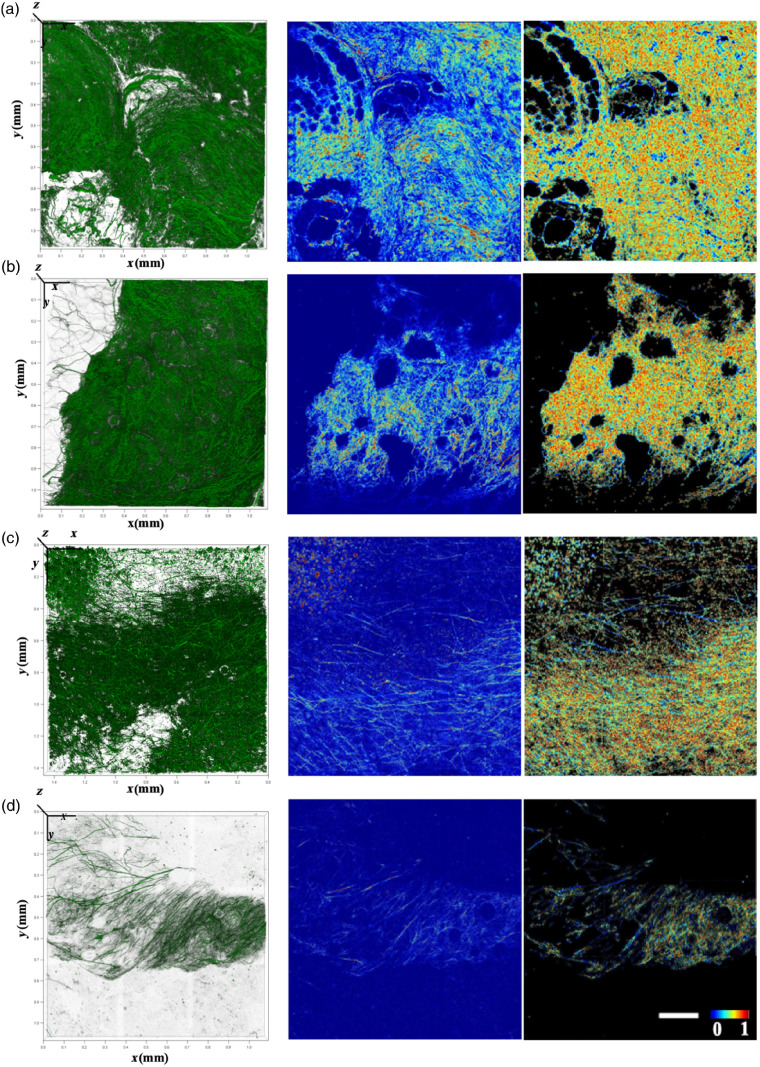
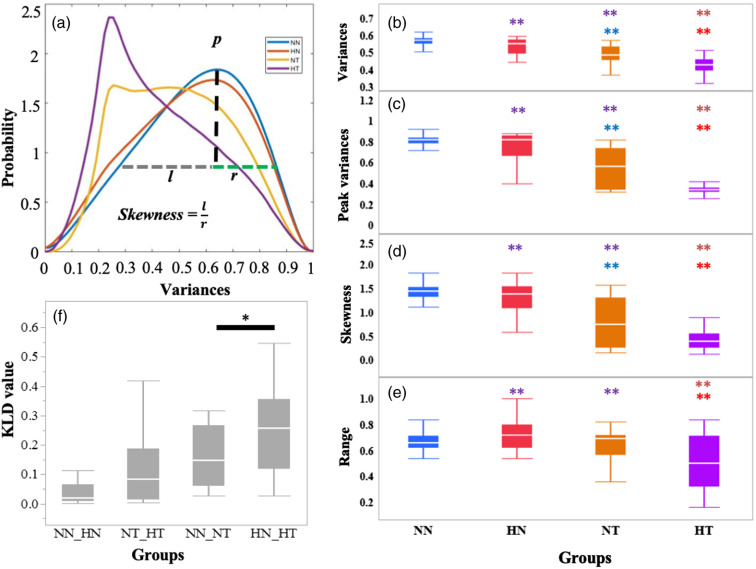
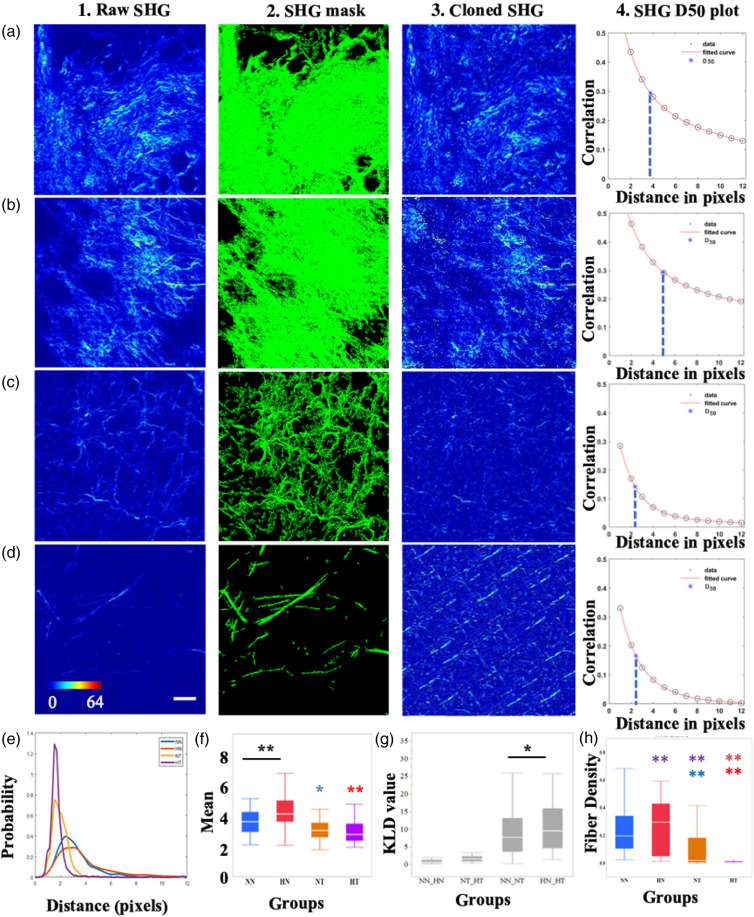
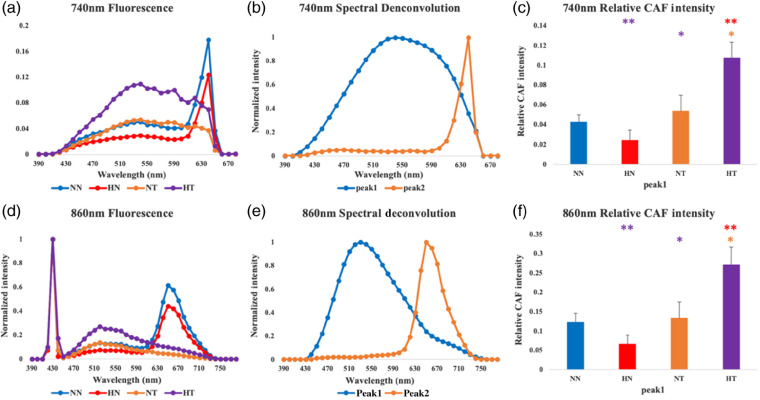
Obesity is associated with a higher risk of developing breast cancer and with worse disease outcomes for women of all ages. The composition, density, and organization of the breast tissue stroma are also known to play an important role in the development and progression of the disease. However, the connections between obesity and stromal remodeling are not well understood. We sought to characterize detailed organization features of the collagen matrix within healthy and cancerous breast tissues acquired from mice exposed to either a normal or high fat (obesity inducing) diet. We performed second-harmonic generation and spectral two-photon excited fluorescence imaging, and we extracted the level of collagen-associated fluorescence (CAF) along with metrics of collagen content, three-dimensional, and two-dimensional organization. There were significant differences in the CAF intensity and overall collagen organization between normal and tumor tissues; however, obesity-enhanced changes in these metrics, especially when three-dimensional organization metrics were considered. Thus, our studies indicate that obesity impacts significantly collagen organization and structure and the related pathways of communication may be important future therapeutic targets.

Keywords: breast cancer; collagen fiber organization; gray-level co-occurrence matrix; obesity; second-harmonic generation; three-dimensional variance; two-photon excitation fluorescence.


Figures

Fig. 1
Fig. 1
Representative volume renderings (pseudocolored green) (left column), 2-D optical sections (middle column) and corresponding 3-D variance color-coded collagen fibers (right column) from the four different tissue types. (a) NN, (b) HN, (c) NT, and (d) HT. Scale bar and color bar are the same for the panels in columns 2 and 3. Scale bar=200  μm.
Fig. 2
Fig. 2
(a) Averaged PDFs of the voxel-wise 3-D collagen fiber variance after KDE. (b) The mean value, (c) the peak of the distribution, (d) its skewness, and (e) the FWHM range are shown. * and ** denote significance at a=0.05 and a=0.01, respectively. The color with which ** is indicated denotes the comparison group. (f) KLD values for corresponding group comparisons. Each box plot conveys the median, the first and third quantiles, and the minimum and maximum values.
Fig. 3
Fig. 3
Textural analyses and representative figures. Representative detected SHG intensity images from each tissue group (a1-d1), along with corresponding SHG-positive masks (a2-d2), cloned SHG images (a3-d3), and correlation intensities as a function of pixel distance (a4-d4). (a1-a4) Normal diet, no tumor; (b1-b4) HFD, no tumor; (c1-c4) normal diet, tumor; (d1-d4) HFD, tumor. (1  pixel0.76  μm). Asterisks and blue lines signify for each plot the distance where correlation value declines to 50% of its initial value (D50) for the corresponding image. (e) PDF of D50 values from all optical sections assessed for each treatment group. (f) Box plots of the mean D50 values of each group. (g) KLD values of each D50 PDF group pairs. (h) Fiber density within the image stacks assessed for each group. Scale bar=50  μm; colorbar and scalebar are the same for columns (1) to (3), panels (a)-(d). * and ** denote significance at a=0.05 and a=0.01, respectively. The color with which ** is indicated denotes the comparison group. The intensities of images listed in columns (1) and (3), panels (a)-(d) were rescaled and separated into 64 different intensity levels, which were assigned with different pseudocolors to range from blue to red.
Fig. 4
Fig. 4
Graphs of CAF spectra at (a) 740 nm and (d) 860 nm excitation acquired with emission in the 390- to 790-nm region (steps: 10 nm) for NN, HN, NT, and HT groups. Spectral deconvolution results of the emission spectra for (b) 740 nm and (e) 860 nm excitation. Values for the weights of peak 1 in each group are shown in (c) and (f) as mean ± standard error of the mean (SEM). (*a=0.05, **a=0.01). The color with which * is indicated denotes the comparison group.

Similar articles

Cited by

References

    1. Hurt R. T., et al. , “The obesity epidemic: challenges, health initiatives, and implications for gastroenterologists,” Gastroenterol. Hepatol. 6(12), 780–792 (2010).GHEPDF - PMC - PubMed
    1. Lee K., et al. , “The impact of obesity on breast cancer diagnosis and treatment,” Curr. Oncol. Rep. 21(5), 41 (2019).10.1007/s11912-019-0787-1 - DOI - PMC - PubMed
    1. Seo B. R., et al. , “Obesity-dependent changes in interstitial ECM mechanics promote breast tumorigenesis,” Sci. Transl. Med. 7(301), 301ra130 (2015).STMCBQ10.1126/scitranslmed.3010467 - DOI - PMC - PubMed
    1. Northey J. J., Przybyla L., Weaver V. M., “Tissue force programs cell fate and tumor aggression,” Cancer Discovery 7(11), 1224–1237 (2017).10.1158/2159-8290.CD-16-0733 - DOI - PMC - PubMed
    1. Acerbi I., et al. , “Human breast cancer invasion and aggression correlates with ECM stiffening and immune cell infiltration,” Integr. Biol. 7(10), 1120–1134 (2015).10.1039/c5ib00040h - DOI - PMC - PubMed

Publication types