. 2020 Mar 10;141(10):828-842.
doi: 10.1161/CIRCULATIONAHA.119.042339. Epub 2020 Jan 27.

Myosin Sequestration Regulates Sarcomere Function, Cardiomyocyte Energetics, and Metabolism, Informing the Pathogenesis of Hypertrophic Cardiomyopathy

Affiliations

Myosin Sequestration Regulates Sarcomere Function, Cardiomyocyte Energetics, and Metabolism, Informing the Pathogenesis of Hypertrophic Cardiomyopathy

Christopher N Toepfer et al. Circulation. .

Erratum in

Abstract

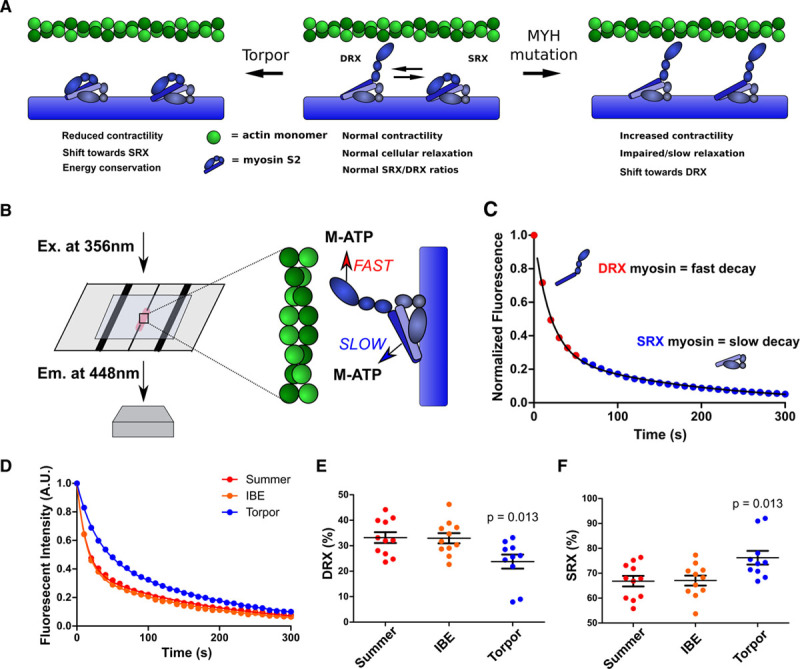
Background: Hypertrophic cardiomyopathy (HCM) is caused by pathogenic variants in sarcomere protein genes that evoke hypercontractility, poor relaxation, and increased energy consumption by the heart and increased patient risks for arrhythmias and heart failure. Recent studies show that pathogenic missense variants in myosin, the molecular motor of the sarcomere, are clustered in residues that participate in dynamic conformational states of sarcomere proteins. We hypothesized that these conformations are essential to adapt contractile output for energy conservation and that pathophysiology of HCM results from destabilization of these conformations.

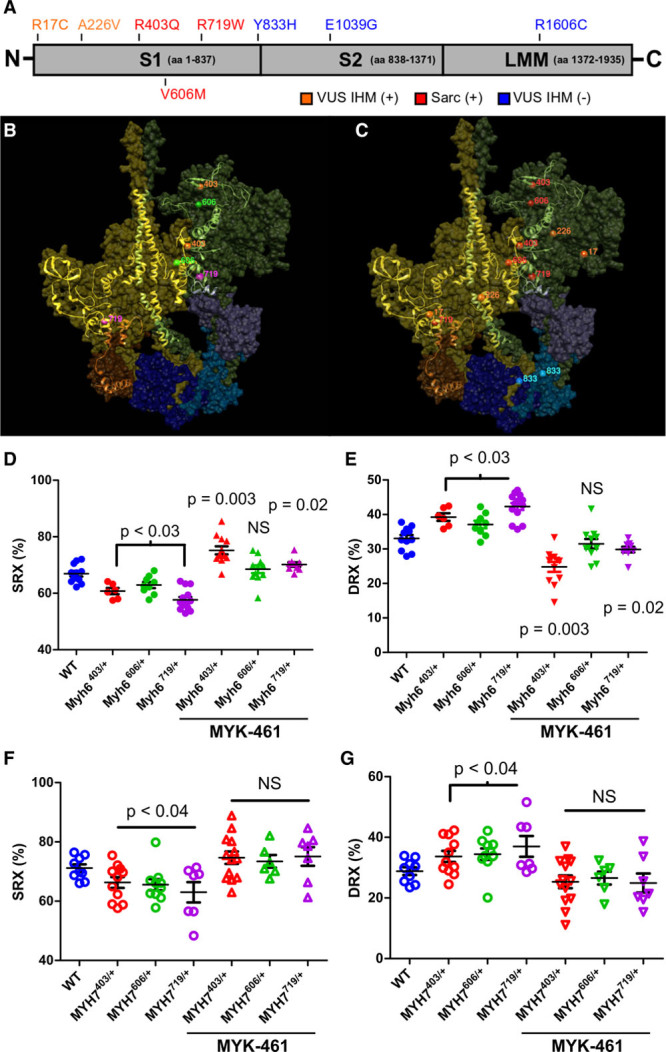
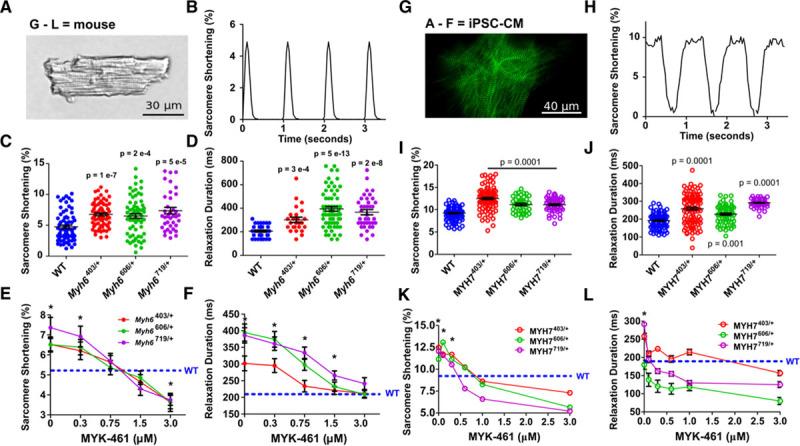
Methods: We assayed myosin ATP binding to define the proportion of myosins in the super relaxed state (SRX) conformation or the disordered relaxed state (DRX) conformation in healthy rodent and human hearts, at baseline and in response to reduced hemodynamic demands of hibernation or pathogenic HCM variants. To determine the relationships between myosin conformations, sarcomere function, and cell biology, we assessed contractility, relaxation, and cardiomyocyte morphology and metabolism, with and without an allosteric modulator of myosin ATPase activity. We then tested whether the positions of myosin variants of unknown clinical significance that were identified in patients with HCM, predicted functional consequences and associations with heart failure and arrhythmias.

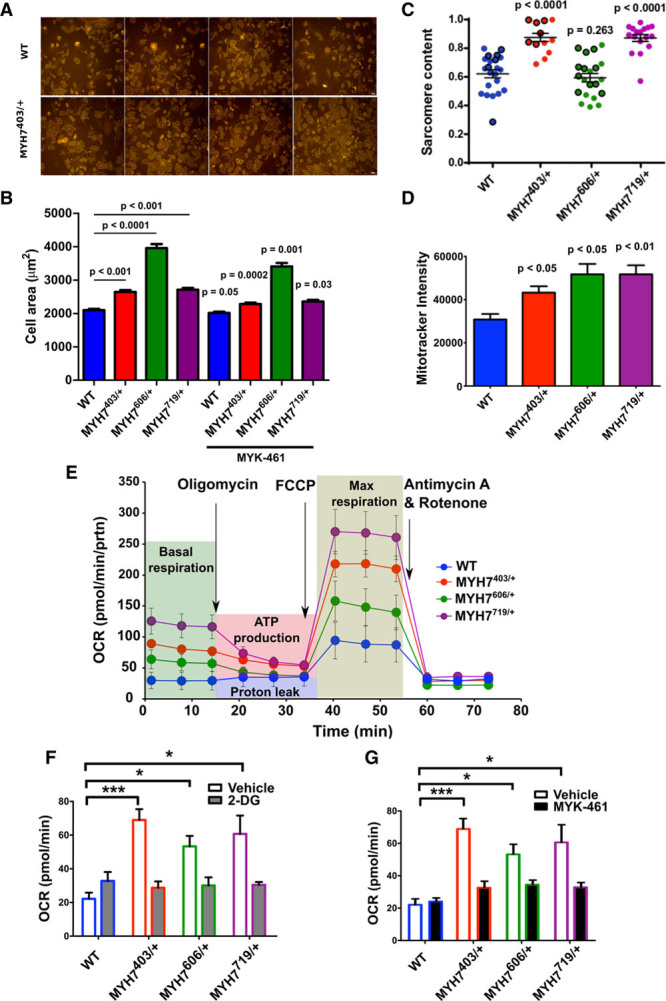
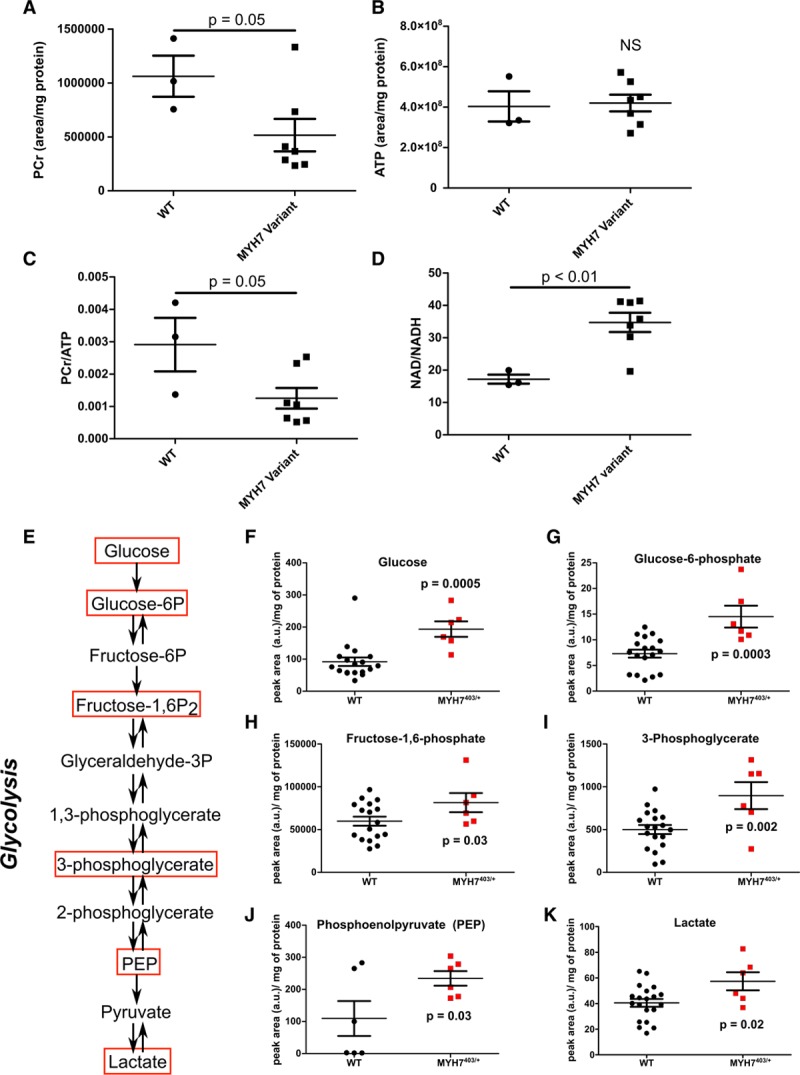
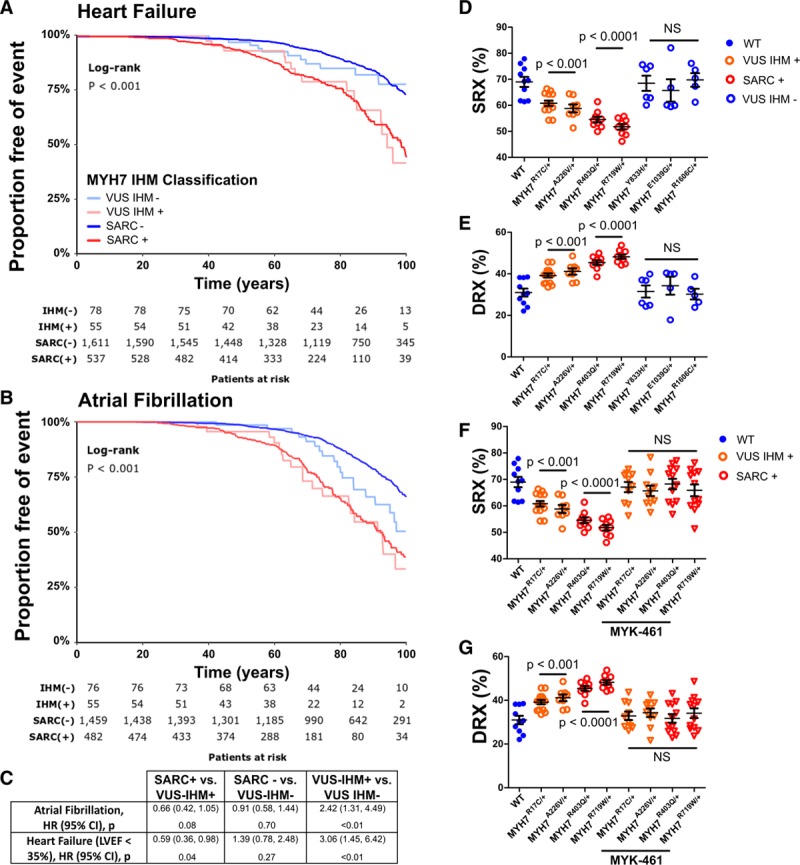
Results: Myosins undergo physiological shifts between the SRX conformation that maximizes energy conservation and the DRX conformation that enables cross-bridge formation with greater ATP consumption. Systemic hemodynamic requirements, pharmacological modulators of myosin, and pathogenic myosin missense mutations influenced the proportions of these conformations. Hibernation increased the proportion of myosins in the SRX conformation, whereas pathogenic variants destabilized these and increased the proportion of myosins in the DRX conformation, which enhanced cardiomyocyte contractility, but impaired relaxation and evoked hypertrophic remodeling with increased energetic stress. Using structural locations to stratify variants of unknown clinical significance, we showed that the variants that destabilized myosin conformations were associated with higher rates of heart failure and arrhythmias in patients with HCM.

Conclusions: Myosin conformations establish work-energy equipoise that is essential for life-long cellular homeostasis and heart function. Destabilization of myosin energy-conserving states promotes contractile abnormalities, morphological and metabolic remodeling, and adverse clinical outcomes in patients with HCM. Therapeutic restabilization corrects cellular contractile and metabolic phenotypes and may limit these adverse clinical outcomes in patients with HCM.

Keywords: cardiomyopathy, hypertrophic; cardiovascular physiological phenomena; myosins; sarcomeres.


Figures

Figure 1.
Figure 1.
Mant-ATP assays assess physiological and pathological changes in cardiac myosin conformations. A, Depiction of the predicted myosin SRX and DRX conformations, indicating the dynamic effects of the interacting heads motif, in torpor (Left), normal cardiac function, and in hypertrophic cardiomyopathy (Right). B, Schematics depicting Mant-ATP (M-ATP) infused into a flow chamber containing permeabilized cardiac tissue. A subsequent chase of dark ATP results in fast and slow fluorescence decay (detected at 448 nm using a 40× objective) from DRX and SRX conformations of myosins, respectively. C, Representative Mant-ATP fluorescent chase experiment in wild-type tissues, described by a double-exponential decay. D, Mant-ATP assays of myocardium from ground squirrel hearts, obtained during summer arousal, interbout euthermia (IBE), and torpor. E and F, Proportions of myosin heads in the DRX conformation (E) with higher rates of ATP cycling and in SRX conformation (F) with slower ATP cycling. Data were obtained from studies of 3 hearts in each physiological state, with 3 to 4 samples studied per heart and are plotted as mean±SEM, with significance tested in comparison with summer (arousal), by 1-way ANOVA with Bonferroni correction with a significance cutoff at P<0.05. A.U. indicates arbitrary units; DRX, disordered relaxed state conformation of myosin molecule; Em., emission; Ex., excitation; and SRX, super relaxed state conformation of myosin molecule.
Figure 2.
Figure 2.
Destabilization of the interacting heads motif (IHM) by pathogenic HCM variants alters the proportion of myosins in the SRX and DRX conformations in mouse myocardium and human iPSC-CMs. A, Depiction of the functional domains of myosin, subunit 1 (S1), subunit 2 (S2), and light meromyosin (LMM), and the location of human MYH7 variants in patients with HCM: pathogenic variants (red), variants of unknown significance (VUS) that alter IHM residues (VUS IHM+, orange), and variants that alter residues outside the IHM (VUS IHM–, blue). B, The Protein Data Bank 5TBY model showing relaxed paired myosin heads, one with the ATP binding site blocked (olive) or accessible (green). The associated essential light chains (brown and purple), and regulatory light chains (dark blue and blue) are shown. Residues involved in the myosin IHM are depicted as a ribbon, with the location of 3 HCM pathogenic missense variants MYH7R403Q/+ (orange), MYH7V606M/+ (magenta), and MYH7R719W/+ (green). C, The same model shown in B and depicting the 3 HCM pathogenic missense variants (red), 2 VUS IHM+ (orange), and one VUS IHM– (blue). Two other VUS IHM– studied here are not visible in this projection. D and E, Proportion of myosin heads in DRX and SRX conformations in WT, Myh6403/+, Myh6606/+, and Myh6719/+ in 8-week-old mouse LV myocardium, in the presence or absence of 0.3 μmol/L MYK-461 as indicated. (See also Figure I in the online-only Data Supplement). F and G, Proportion of myosin heads in DRX and SRX conformations in WT, MYH7403/+, MYH7606/+, and MYH7719/+ iPSC-CMs in the presence or absence of 0.3 μmol/L MYK-461 as indicated. Data are from 3 independent heart tissues or differentiations of iPSC-CMs and are presented as means±SEM. Significance was tested by 1-way ANOVA and post hoc Bonferroni corrections for significances are denoted in the figure. Significances are reported in relation to WT values; bars encompassing significance values indicate that statistical significance is shared among these samples. DRX indicates disordered relaxed state conformation of myosin molecule; HCM, hypertrophic cardiomyopathy; iPSC-CMs, isogenic cardiomyocytes derived from induced pluripotent stem cells; NS, not significant; SRX, super relaxed state conformation of myosin molecule; and WT, wild type cardiomyocytes.
Figure 3.
Figure 3.
Pathogenic hypertrophic cardiomyopathy myosin variants in mouse cardiomyocytes and iPSC-CMs exhibit hypercontractility and abnormal relaxation that is normalized by interacting heads motif restabilization with MYK-461. A, Mouse cardiomyocytes (×40 image) shows precise striations attributable to a well-organized sarcomere. B, Typical contractile waveform obtained by tracking strings of mouse cardiomyocyte sarcomeres during 1 Hz pacing. C and D, Sarcomere shortening (C) and relaxation durations (D) in WT, Myh6R403Q/+, Myh6V606M/+, and Myh6R719W/+ mouse cardiomyocytes taken from 3 hearts per genotype. E and F, Dose-dependent effects of acute MYK-461 application on sarcomere contractility (E, percent shortening) and relaxation (F) in paced mouse WT, Myh6R403Q/+, Myh6V606M/+, and Myh6R719W/+ cardiomyocytes from 3 hearts per genotype. G, Image of titin-green fluorescent protein–tagged iPSC-CM imaged at 100×, showing z-discs labeled by green fluorescence. H, Contractile waveform of a single sarcomere defined by a z-disc pair during 1 Hz pacing. I and J, Sarcomere shortening (I) and relaxation durations (J) in paced isogenic WT, MYH7R403Q/+, MYH7V606M/+, and MYH7R719W/+ iPSC-CMs from 3 separate differentiations. K and L, Dose-dependent effect of acute MYK-461 application on sarcomere contractility (K) and relaxation durations (L) in paced isogenic WT, MYH7R403Q/+, MYH7V606M/+, and MYH7R719W/+ iPSC-CMs from 3 separate differentiations. Significant differences to WT were assessed by 2-way ANOVA with post hoc Bonferroni correction from multiple comparisons, significances of P<0.05 indicated by *. All data are displayed as mean±SEM. iPSC-CMs indicates isogenic cardiomyocytes derived from induced pluripotent stem cells; and WT, wild type cardiomyocytes.
Figure 4.
Figure 4.
MYH7 variants affect sarcomere content and cell size in iPSC-CMs. A, Representative images obtained of WT and MYH7R403Q/+ iPSC-CMs used for calculating cellular spread area. B, Mean cell spreading areas observed with unconstrained seeding onto glass slides of iPSC-CMs: WT (n=632), MYH7R403Q/+ (n=530), MYH7V606M/+ (n=479), and MYH7R719W/+ (n=655), iPSC-CMs (MYH7R403Q/+, n=665; MYH7V606M/+, n=531; MYH7R719W/+, n=653) were treated with 1 μmol/L MYK-461 for 24 hours, and the spreading areas were measured. Data presented are from 3 separate differentiations with the mean±SEM displayed for each measure. Significances are measured by 2-way ANOVA with multiple comparison corrections and a significance cutoff of P<0.05. The P values above bars compare areas of untreated mutant and WT iPSC-CMs. The P values without bars reflect comparisons of MYK-461 treated to untreated cells with the same genotype. C, Sarcomere content assessed by Fast Fourier Transform analyses of WT, MYH7403/+, MYH7606/+, and MYH7719/+ iPSC-CMs. Data presented are from 3 separate differentiations with mean±SEM displayed for each measure. Statistical significance was assessed by 1-way ANOVA with post hoc Bonferroni correction for multiple comparisons with a significance cutoff of P<0.05. D, Mitochondrial abundance assessed by Mitotracker intensity between WT, MYH7403/+, MYH7606/+, and MYH7719/+ iPSC-CMs. E, Extracellular-flux analyses during experimental conditions (depicted by background shading) in WT, MYH7403/+, MYH7606/+, and MYH7719/+ iPSC-CMs. Assessment of oxygen consumption rate (OCR) was performed with the application of compounds to assess ATP production (Oligomycin), maximum (Max) respiration (FCCP, carbonyl cyanide-4 [trifluoromethoxy] phenylhydrazone) and halted respiration (antimycin A and rotenone) for WT or mutant MYH7403/+, MYH7606/+, MYH7719/+ iPSC-CMs. F, Basal OCR of naive WT MYH7403/+, MYH7606/+, and MYH7719/+ iPSC-CMs or after 24-hour MYK-461 0.3 μmol/L treatment. G, Basal OCR of naive WT MYH7403/+, MYH7606/+, and MYH7719/+ iPSC-CMs or after 2-deoxy-d-glucose (2-DG) treatment. * denotes significance of P<0.05, *** denotes a significance of P<0.005. iPSC-CMs indicates isogenic cardiomyocytes derived from induced pluripotent stem cells; and WT, wild type cardiomyocytes.
Figure 5.
Figure 5.
MYH7 variants that destabilize the interacting heads motif alter cellular metabolism. A, Mass spectrometry assessment of total cell phosphocreatine (PCr) abundance in WT, and combined MYH7403/+, MYH7606/+, and MYH7719/+ iPSC-CMs. B,Mass spectrometry assessment of total cell adenosine triphosphate (ATP) abundance in WT, and combined MYH7403/+, MYH7606/+, and MYH7719/+ iPSC-CMs. C, Mass spectrometry assessment of total cell PCr/ATP in WT, and combined MYH7403/+, MYH7606/+, and MYH7719/+ iPSC-CMs. D, Mass spectrometry assessment of total cell NAD/NADH in WT, and combined MYH7403/+, MYH7606/+, and MYH7719/+ iPSC-CMs. E, Analyses of metabolic pathways involved in glycolysis. Glycolytic intermediates marked with red boxes were assessed by mass spectrometry. F through K, Glycolytic pathway intermediates detected in WT and MYH7403/+ iPSC-CMs. (See also Figure III in the online-only Data Supplement). All data were obtained from day 30 cultures of ≥2 independent differentiations, per genotype, and are displayed as mean±SEM. One-way ANOVA and 2-way ANOVA with post hoc Bonferroni correction for multiple comparisons were used for A and C and D, respectively. t tests defined statistical significance in F through K. a.u. indicates arbitrary units; Fructose-1,6-P2, fructose 1,6-bisphosphate; iPSC-CMs, isogenic cardiomyocytes derived from induced pluripotent stem cells; NS, not significant; PEP, phosphenolpyruvate; and WT, wild type cardiomyocytes.
Figure 6.
Figure 6.
Myosin VUS that alter IHM residues are associated with higher rates of adverse clinical outcomes. A, Kaplan-Meier curves show relative time points at which SHaRe subjects, grouped according to genotype, meet composite heart failure end points (first occurrence of cardiac transplantation, LV assist device implantation, LV ejection fraction <35%, or New York Heart Association class III/IV symptoms). Genotypes are denoted as pathogenic sarcomere variants (SARC+), no pathogenic sarcomere variants (SARC–), variant of unknown significance that alters an IHM residue (VUS–IHM+), and variant of unknown significance that does not alter an IHM residue (VUS–IHM–). B, Kaplan-Meier curves demonstrate time to atrial fibrillation among SHaRe subjects with genotypes SARC+, SARC–, VUS–IHM+, and VUS–IHM–. (See also Figure IV in the online-only Data Supplement). C, Cox proportional hazard ratios comparing clinical SHaRe subjects with genotypes SARC+, SARC–, VUS–IHM+, and VUS–IHM– and adverse clinical outcomes of heart failure and atrial fibrillation. Significance was calculated using the log-rank test. D and E, Proportion of myosins in the SRX (D) and DRX conformations (E) in human ventricular tissues from healthy donor tissues (WT) or from HCM subjects with genotypes SARC+, VUS IHM+, (SARC–), and VUS IHM–. F and G, Proportion of myosin heads in SRX (F) and DRX (G) from healthy human ventricular tissues (WT) or HCM hearts with genotypes SARC+, VUS IHM+, (SARC–), and VUS IHM– region (VUS IHM +) before or after treatment with 0.3 μmol/L MYK461. All data are displayed with mean±SEM, and all significances are reported with a significance cutoff of P<0.05 after using two-way ANOVA with Bonferroni corrections for multiple comparisons. DRX indicates disordered relaxed state conformation of myosin molecule; HCM, hypertrophic cardiomyopathy; HR, hazard ratio; IHM, interacting-heads motif; LV, left ventricular; LVEF, left ventricular ejection fraction; NS, not significant; SHaRe, Sarcomeric Human Cardiomyopathy Registry; and SRX, super relaxed state conformation of myosin molecule.

References

    1. Chung JH, Biesiadecki BJ, Ziolo MT, Davis JP, Janssen PM. Myofilament calcium sensitivity: role in regulation of in vivo cardiac contraction and relaxation. Front Physiol. 2016;7:562. doi: 10.3389/fphys.2016.00562. - PMC - PubMed
    1. de Tombe PP, Mateja RD, Tachampa K, Ait Mou Y, Farman GP, Irving TC. Myofilament length dependent activation. J Mol Cell Cardiol. 2010;48:851–858. doi: 10.1016/j.yjmcc.2009.12.017. - PMC - PubMed
    1. Barry WH, Bridge JH. Intracellular calcium homeostasis in cardiac myocytes. Circulation. 1993;87:1806–1815. doi: 10.1161/01.cir.87.6.1806. - PubMed
    1. Toepfer CN, West TG, Ferenczi MA. Revisiting Frank-Starling: regulatory light chain phosphorylation alters the rate of force redevelopment (ktr) in a length-dependent fashion. J Physiol. 2016;594:5237–5254. doi: 10.1113/JP272441. - PMC - PubMed
    1. Layland J, Solaro RJ, Shah AM. Regulation of cardiac contractile function by troponin I phosphorylation. Cardiovasc Res. 2005;66:12–21. doi: 10.1016/j.cardiores.2004.12.022. - PubMed

Publication types

MeSH terms