. 2020 Nov 9;12(1):1714401.
doi: 10.1080/19490976.2020.1714401. Epub 2020 Jan 26.

Dietary restriction increases protective gut bacteria to rescue lethal methotrexate-induced intestinal toxicity

Affiliations

Dietary restriction increases protective gut bacteria to rescue lethal methotrexate-induced intestinal toxicity

Duozhuang Tang et al. Gut Microbes. .

Abstract

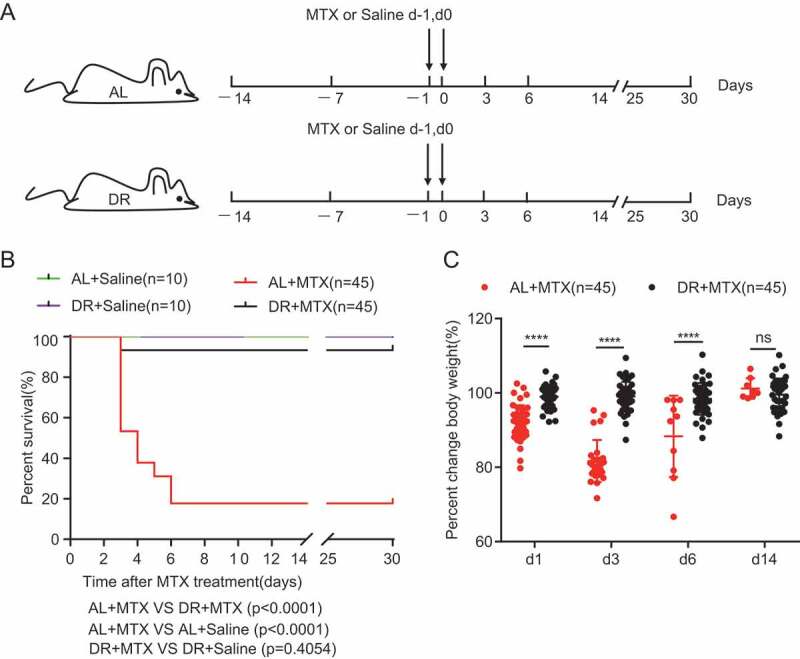
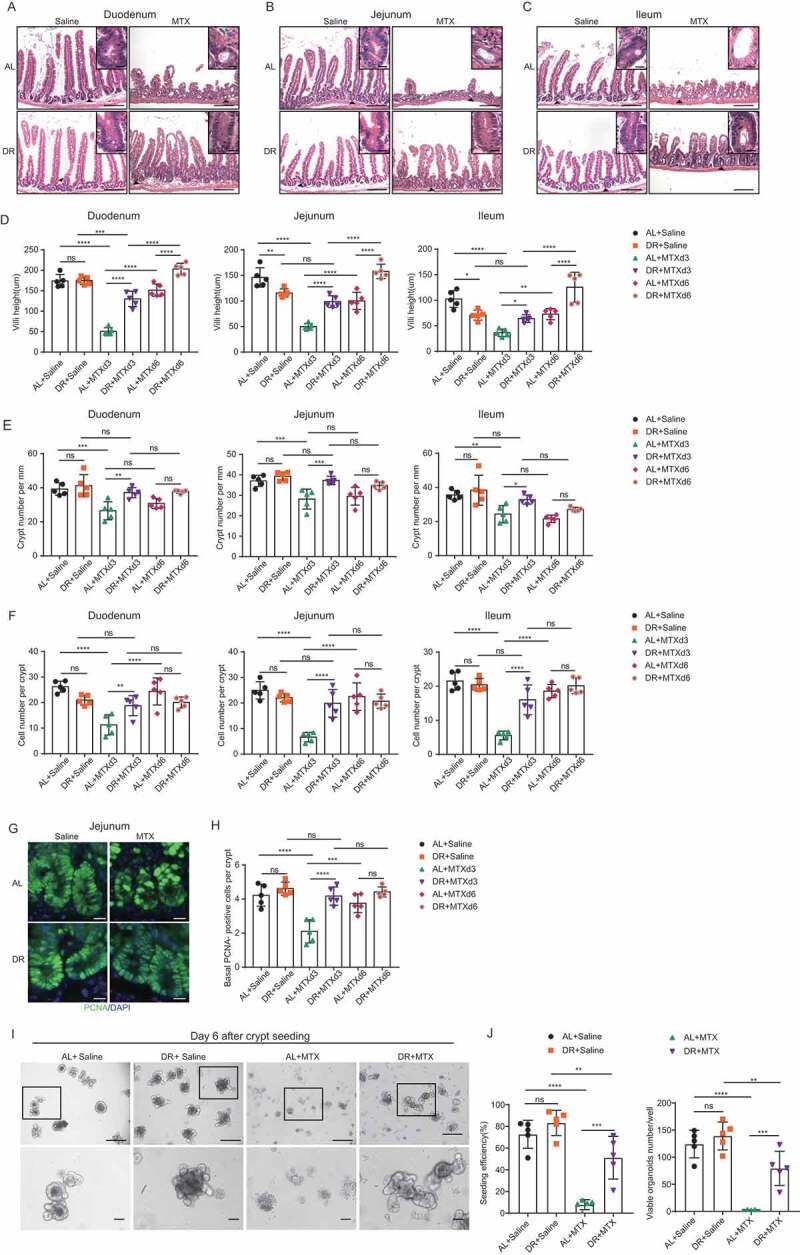
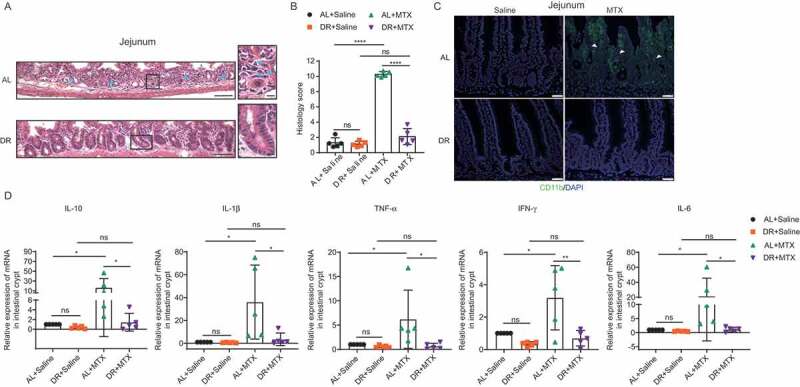
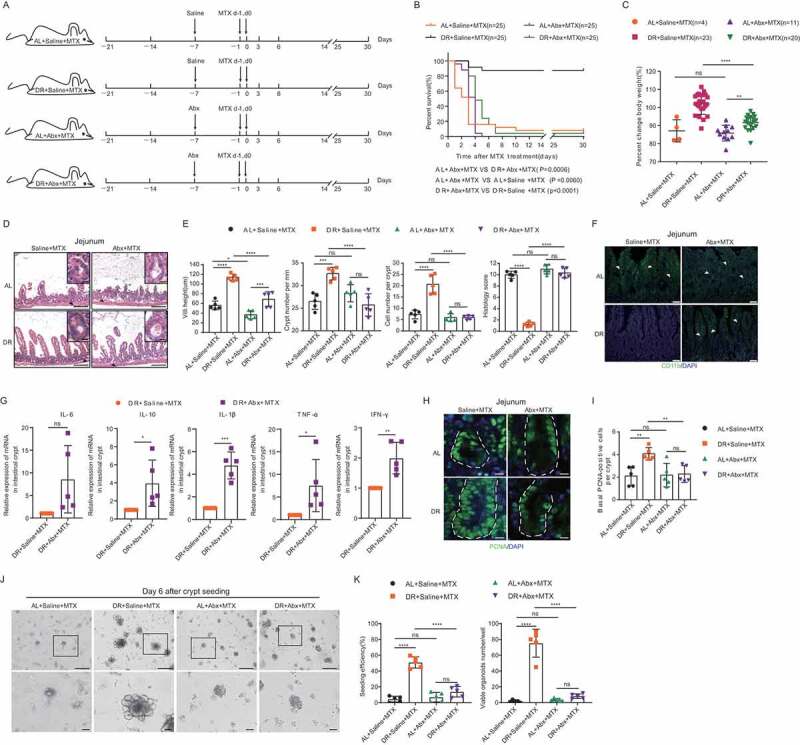
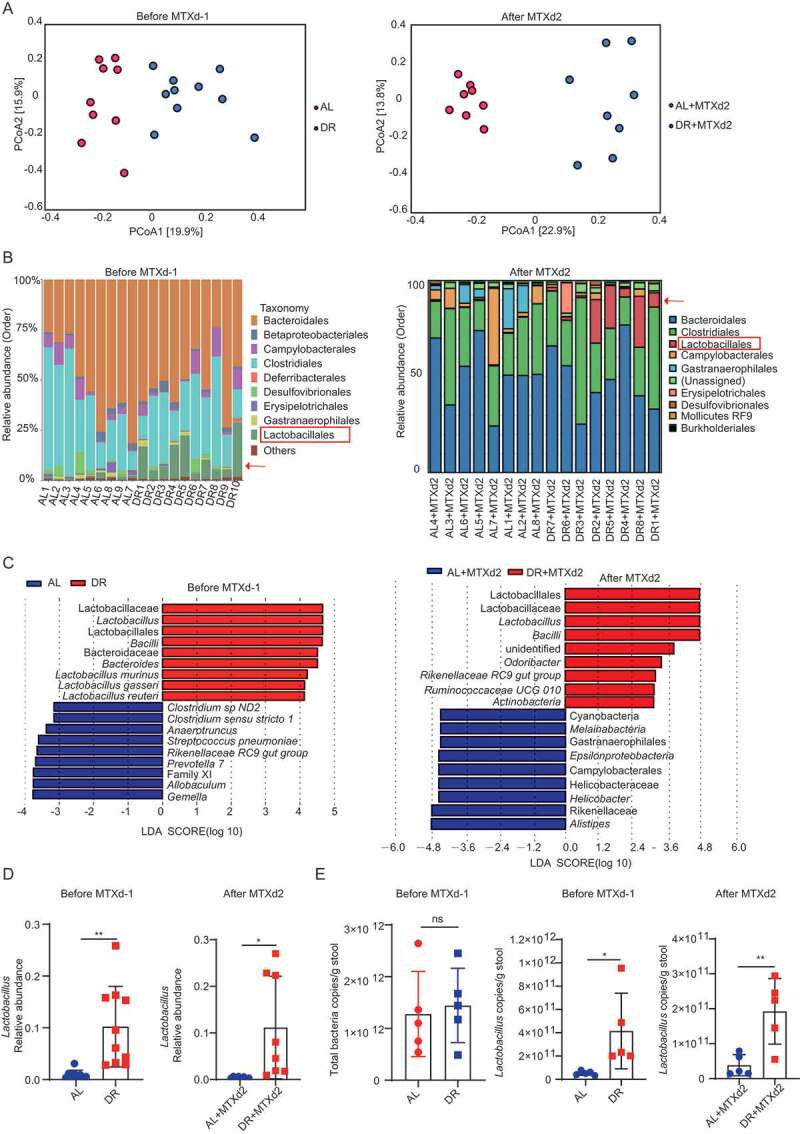
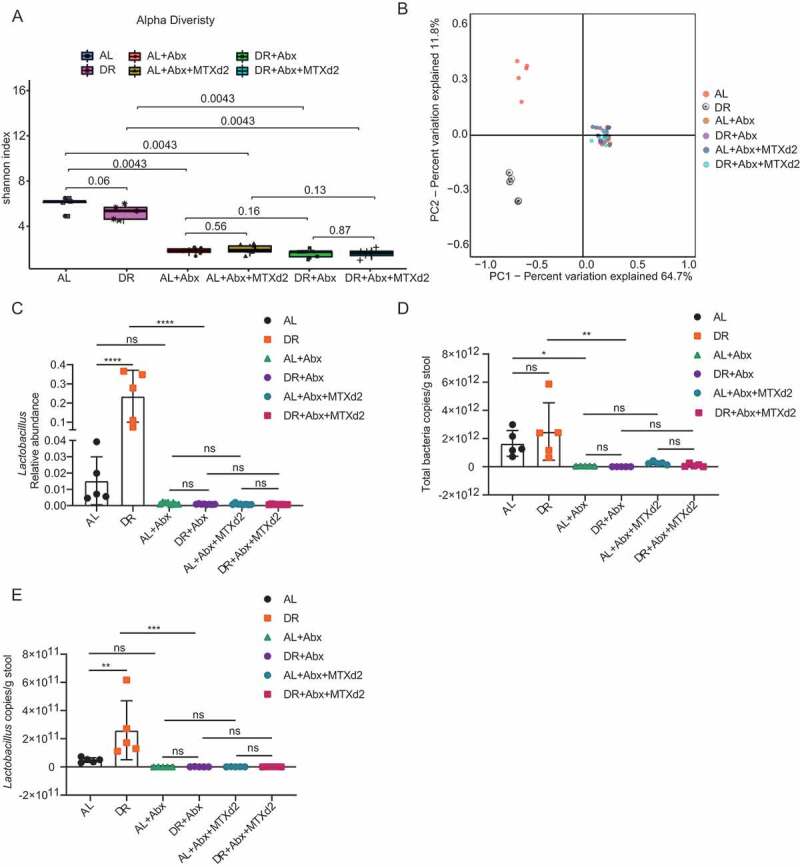
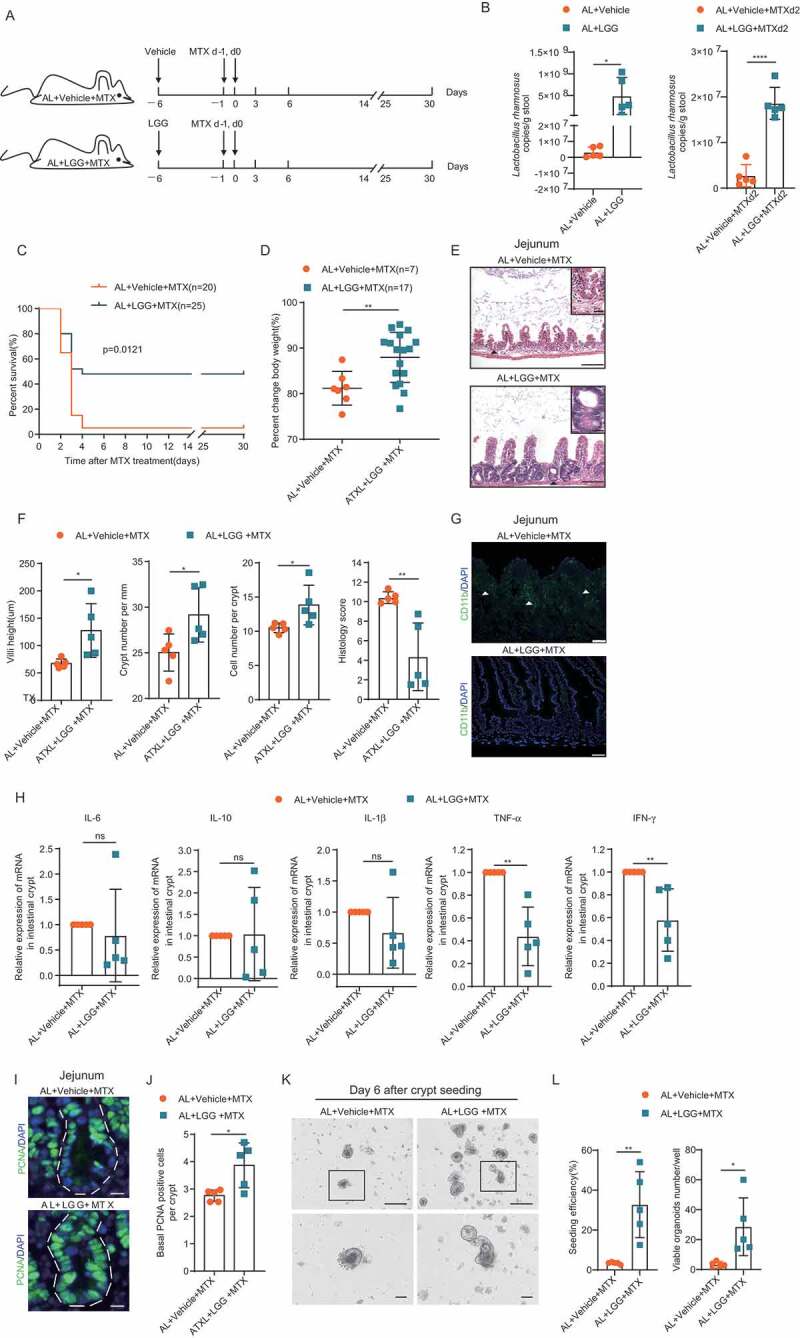
Methotrexate (MTX) is a typical chemotherapeutic drug that is widely used in the treatment of various malignant diseases as well as autoimmune diseases, with gastrointestinal toxicity being its most prominent complication which could have a significant effect on the prognosis of patients. Yet effective ways to alleviate such complications remains to be explored. Here we show that 30% dietary restriction (DR) for 2 weeks dramatically increased the survival rate of 2-month-old female mice after lethal-dose MTX exposure. DR significantly reduced intestinal inflammation, preserved the number of basal crypt PCNA-positive cells, and protected the function of intestinal stem cells (ISCs) after MTX treatment. Furthermore, ablating intestinal microbiota by broad-spectrum antibiotics completely eliminated the protective effect achieved by DR. 16S rRNA gene deep-sequencing analysis revealed that short-term DR significantly increased the Lactobacillus genus, with Lactobacillus rhamnosus GG gavage partially mimicking the rescue effect of DR on the intestines of ad libitum fed mice exposed to lethal-dose MTX. Together, the current study reveals that DR could be a highly effective way to alleviate the lethal injury in the intestine after high-dose MTX treatment, which is functionally mediated by increasing the protective intestinal microbiota taxa in mice. Keywords: Dietary restriction, Methotrexate, Gut microbiota, Intestinal stem cells, intestinal toxicity.

Keywords: Dietary restriction; gut microbiota; intestinal stem cells; intestinal toxicity; methotrexate.


Figures

Figure 1.
Figure 1.
DR significantly improves survival rate and body weight maintenance of mice exposed to lethal doses of MTX treatment. (A) Scheme of experiment. Two-month-old mice were fed with AL diet or 30% DR diet for 14 days before MTX administration and the diet regimen was continued afterward. Then, mice were intraperitoneally injected with saline as control or MTX for 2 days at a dose of 120mg/kg (d-1) and 60mg/kg (d0). (B) Survival was monitored daily after MTX administration. (Data combined from 3 independent experiments. n = 45 mice per group for the AL+MTX mice and DR+MTX mice; n = 10 mice per group for the AL+Saline mice and DR+Saline mice) Gehan-Breslow-Wilcoxon test. (C) Percent change of body weight at indicated timepoints after MTX treatment compared to before MTX treatment (n = 45 mice per group, combined from 3 independent experiments). Note that the majority of mice were dead within 7 days after MTX administration, therefore, the number of mice measured in the AL group was much reduced at later timepoints after MTX treatment. Unpaired two-tailed, Student’s t test. Results were displayed as mean±SD. n.s: nonsignificant; ****: P < .0001. AL: mice on AL diet; DR: mice on DR diet; AL+Saline: mice on AL diet and received saline injection; DR+Saline: mice on DR diet and received saline injection; AL+MTX: mice on AL diet and received MTX injection; DR+MTX: mice on DR diet and received MTX injection.
Figure 2.
Figure 2.
DR significantly protected small intestine and ISCs from lethal doses of MTX. Two-month-old mice were fed with AL diet or 30% DR diet for 14 days before MTX administration and the diet regimen was continued afterward. Then, mice were intraperitoneally injected with saline as control or MTX for 2 days at a dose of 120mg/kg (d-1) and 60mg/kg (d0). Mice were sacrificed at certain timepoints and small intestinal tissue was collected for further analysis. (A-C) Representative images of H&E staining of sections on day 3 after MTX administration (scale bar: 50μm). Square frames show the enlarged images of arrowhead pointed areas (scale bar: 20μm). (D) Villi height (30 crypts were counted for each mouse, n = 5 mice per group randomly picked from 2 independent experiments.) (E) Crypt number per millimeter (crypt number per 15 mm length was counted for each mouse, n = 5 mice per group randomly picked from 2 independent experiments.) and (F) cell number per crypt (30 crypts were counted for each mouse, n = 5 mice per group randomly picked from 2 independent experiments) at indicated timepoints after MTX administration. (G) Representative images of immunofluorescent staining of PCNA of jejunum on day 3 after MTX treatment (scale bar: 20μm). (H) Basal crypt PCNA-positive cell number per crypt counted from the whole small intestine at indicated timepoints after MTX administration (40 crypts were counted for each mouse, and n = 5 mice per group randomly picked from 2 independent experiments). (I) Representative images of cultured crypts on day 6 in culture derived from mice on day 3 after indicated treatment. Lower line: zoomed in vision of images in square frames of the upper line. Scale bars: 100 μm (upper); 50 μm (lower). (J) Seeding efficiency of cultured crypts on day 3 and number of viable organoids from cultured crypts on day 6 (n = 5 mice per group, combined from 2 independent experiments). Results were displayed as mean±SD. n.s: nonsignificant; *: P < .05; **: P < .01; ***: P < .001; ****: P < .0001 by One-way ANOVA test. AL+Saline: mice on AL diet and received saline injection; DR+Saline: mice on DR diet and received saline injection; AL+MTX: mice on AL diet and received MTX injection; DR+MTX: mice on DR diet and received MTX injection; d3: day 3 after MTX injection; d6: day 6 after MTX injection.
Figure 3.
Figure 3.
DR reduces MTX-induced intestinal inflammation. Two-month-old mice were fed with AL diet or 30% DR diet for 14 days before MTX administration and the diet regimen was continued afterward. Then, mice were intraperitoneally injected with saline as control or MTX for 2 days at a dose of 120mg/kg (d-1) and 60mg/kg (d0). Mice were sacrificed on day 3 after MTX administration and whole small intestinal tissue was collected for further analysis. (A) Representative images of H&E staining of jejunum. Representative crypts are shown in insets on the right. Note that crypts of DR mice were relatively intact while they were destroyed in AL mice with significantly increased neutrophils infiltration as pointed by blue arrows. Scale bar: 50μm (left), 20μm (right). (B) Histology score based on H&E staining. (33 vision fields were counted per mouse, n = 5 mice per group randomly picked from 2 independent experiments) of the whole small intestine. (C) Representative images of CD11b+ immunofluorescent staining for myeloid cells of jejunum. Arrow heads point to CD11b+ cells. Note the rare infiltration of CD11b+ cells in DR mice compared to the extensive infiltration of CD11b+ cells in AL mice after MTX administration. Scale bars: 20 μm. (D) Relative expression of indicated genes in freshly isolated crypt cells by qRT-PCR analysis (n = 5 mice per group randomly picked from 2 independent experiments). Results were displayed as mean±SD. n.s: nonsignificant; *: P < .05; **: P < .01; ***: P < .001; ****: P < .0001 by two-tailed, Student’s t test. AL+Saline: mice on AL diet and received saline injection; DR+Saline: mice on DR diet and received saline injection; AL+MTX: mice on AL diet and received MTX injection; DR+MTX: mice on DR diet and received MTX injection.
Figure 4.
Figure 4.
Ablating the gut microbiota eliminates the protective effect of DR. (A) Scheme of experiments. Two-month-old mice were fed with AL diet or 30% DR diet for 14 days before MTX administration and the diet regimen was continued afterward. Then, all mice were intraperitoneally injected with MTX for 2 days at a dose of 120mg/kg (d-1) and 60mg/kg (d0). Seven days prior to MTX administration, mice were fed by gavage for 5 days and then in drinking water for the following days with broad-spectrum antibiotics or saline. (B) Survival was monitored daily after MTX administration. Number of mice in each group was indicated. Gehan-Breslow-Wilcoxon test (n = 25 mice per group, combined from 2 independent experiments). (C) Percent change of body weight on day 3 after MTX treatment compared to before MTX treatment (number of mice of each group were indicated, results were from 2 combined independent experiments). Note that antibiotics treatment resulted in impaired body weight maintenance of DR mice. (D) Representative images of H&E staining of jejunum on day 3 after MTX administration. Representative crypts are shown in insets. Note that crypts of DR mice were relatively intact while they were destroyed in antibiotics treated mice after MTX administration. Scale bar: 50μm (outside), 20μm (insets). (E) Villi height (45 crypts were counted for each mouse, n = 5 mice per group randomly picked from 2 independent experiments), crypt number per millimeter (crypt number in 15 mm length as a unit was counted, and15 units were counted for each mouse, n = 5 mice per group randomly picked from 2 independent experiments), cell number per crypt (30 crypts were counted for each mouse, n = 5 mice per group randomly picked from 2 independent experiments) from the jejunum on day 3 after MTX administration were shown. Histology score was based on H&E staining (30 vision fields were counted per mouse, n = 5 mice per group randomly picked from 2 independent experiments) from the whole small intestine on day 3 after MTX administration. (F) Representative images of CD11b+ immunofluorescent staining of jejunum on day 3 after MTX administration. Arrow heads point to CD11b+ cells. Note antibiotics treatment induced the extensive infiltration of CD11b+ cells in DR mice after MTX administration. Scale bars: 20 μm. (G) Relative expression of indicated genes in freshly isolated crypt cells from whole small intestine of mice on day 3 after MTX administration by qRT-PCR analysis (n = 5 mice per group randomly picked from 2 independent experiments). Note that antibiotics treatment significantly induced expression of inflammatory genes. (H) Representative images of immunofluorescent staining of PCNA of jejunum on day 3 after MTX treatment. (I) Basal crypt PCNA-positive cell number per crypt on day 3 after MTX administration of the whole small intestine (40 crypts were counted for each mouse, and n = 5 mice per group randomly picked from 2 independent experiments). (J) Representative images of cultured crypts on day 6 in culture derived from mice on day 3 after indicated treatment. Lower line: zoomed in vision of images in square frames of the upper line, note that antibiotics treatment diminished the protective effect in DR mice. Scale bars: 100 μm (upper); 50 μm (lower). (K) Seeding efficiency of cultured crypts on day 3 and number of viable organoids of cultured crypts on day 6 (n = 5 mice per group randomly picked from 2 independent experiments). Results were displayed as mean±SD. n.s; nonsignificant; *: P < .05; **: P < .01; ***: P < .001; ****: P < .0001 by one-way ANOVA. AL+Saline+MTX: mice on AL diet and received MTX injection and saline administration; DR+Saline+MTX: mice on DR diet and received MTX injection and saline administration; AL+Abx+MTX: mice on AL diet and received MTX injection and Abx administration; DR+Abx+MTX: mice on DR diet and received MTX injection and Abx administration.
Figure 5.
Figure 5.
DR modulates composition of intestinal flora. Two-month-old mice were fed with AL diet or 30% DR diet for 14 days before MTX administration and the diet regimen was continued afterward. Then, mice were intraperitoneally injected with saline as control or MTX for 2 days at a dose of 120mg/kg (d-1) and 60mg/kg (d0) Fecal samples were randomly collected from mice before and on day 2 after MTX injection for 16S rRNA gene sequencing (n = 8–10 mice per group randomly picked from 2 independent experiments) and qPCR analysis (n = 5 mice per group randomly picked from 2 independent experiments). (A) Variation of intestinal flora structure of indicated groups along PC1 and PC2 of PCoA based on the Bray–Curtis distance. (B) Relative abundance of the intestinal flora of indicated groups on the Order level showed by 16S rRNA gene sequencing. (C) LDA scores in the fecal microbiomes of indicated groups. LDA score>2 and top nine bacteria were shown. (D) Relative abundance of the Lactobacillus showed by 16S rRNA gene sequencing. (E) qPCR analysis of the amounts of total bacteria and Lactobacillus of indicated groups (n = 5 mice per group, randomly picked from 2 independent experiments). Results were displayed as mean±SD. n.s; nonsignificant; *: P < .05; **: P < .01 by two-tailed, Student’s t test. AL: mice on AL diet; DR: mice on DR diet; AL+MTX: mice on AL diet and received MTX injection; DR+MTX: mice on DR diet and received MTX injection; d-1: day −1 before MTX injection; d2: day 2 after MTX injection.
Figure 6.
Figure 6.
Broad-spectrum-antibiotics abolished differences of gut microbiota between AL and DR mice. Two-month-old mice were fed with AL diet or 30% DR diet for 14 days before MTX administration and the diet regimen was continued afterward. Then, all mice were intraperitoneally injected with MTX for 2 days at a dose of 120mg/kg (d-1) and 60mg/kg (d0). Seven days prior to MTX administration, mice were fed by gavage for 5 days and then in drinking water for the following days with broad-spectrum antibiotics or saline. Fecal samples were randomly collected from mice after 14 days on AL or DR diet before MTX injection and on day 2 after MTX injection for 16S rRNA gene sequencing (n = 5–8 mice per group randomly picked from 2 independent experiments) and qPCR analysis (n = 5 mice per group randomly picked from 2 independent experiments). (A) Shannon index of indicated groups based on alpha diversity analysis. (B) Variation of intestinal flora structure of indicated groups along PC1 and PC2 of PCoA based on the Bray–Curtis distance. (C) Relative abundance of the Lactobacillus showed by 16S rRNA gene sequencing. (D,E) qPCR analysis of the amounts of total bacteria (D) and Lactobacillus (E) of indicated groups (n = 5 mice per group, randomly picked from 2 independent experiments). Results were displayed as mean±SD. n.s; nonsignificant; *: P < .05; **: P < .01; ***: P < .001; ****: P < .0001 by one-way ANOVA. AL: mice on AL diet; DR: mice on DR diet; AL+Abx: mice on AL diet with Abx administration before MTX injection; DR+Abx: mice on DR diet with Abx administration before MTX injection; AL+Abx+MTX: mice on AL diet with Abx administration day 2 after MTX injection; DR+Abx+MTX: mice on DR diet with Abx administration day 2 after MTX injection.
Figure 7.
Figure 7.
LGG gavage partially rescued the survival of AL mice exposed to high-dose MTX. (A) Scheme of experiment. Two-month-old mice were fed with vehicle control or LGG for 5 days before MTX administration. Then, mice were intraperitoneally injected with the vehicle as control or MTX for 2 days at a dose of 120mg/kg (d-1) and 60mg/kg (d0). All mice were fed with AL diet. (B) qPCR analysis of the amounts of total bacteria and LGG of indicated groups (n = 5 mice per group randomly picked from 2 independent experiments). (C) Survival was monitored daily after MTX administration. Gehan-Breslow-Wilcoxon test. (n = 20–25 mice per group, combined from 2 independent experiments). (D) Percent change of body weight at indicated timepoints after MTX treatment compared to before MTX treatment (n = 7–17 mice per group, combined from 2 independent experiments). (E) Representative images of H&E staining of jejunum on day 3 after MTX administration. Representative crypts are shown in insets. Scale bar: 50μm (outside), 20μm (insets). (F) Villi height (40 crypts were counted for each mouse, n = 5 mice per group randomly picked from 2 independent experiments), crypt number per millimeter (crypt number in 15 mm length was counted as a unit, and 15 units were counted for each mouse, n = 5 mice per group randomly picked from 2 independent experiments), cell number per crypt (30 crypts were counted for each mouse, n = 5 mice per group randomly picked from 2 independent experiments) from jejunum on day 3 after MTX administration were shown. Histology score was based on H&E staining (30 vision fields were counted per mouse, n = 5 mice per group randomly picked from 2 independent experiments) from the whole small intestine on day 3 after MTX administration. (G) Representative images of CD11b+ immunofluorescent staining of jejunum on day 3 after MTX administration. Arrow heads point to CD11b+ cells. Scale bars: 20 μm. (H) Relative expression of indicated genes in freshly isolated crypt cells from the whole small intestine of mice on day 3 after MTX administration by qRT-PCR analysis (n = 5 mice per group randomly picked from 2 independent experiments). (I) Representative images of immunofluorescent staining of PCNA of jejunum on day 3 after MTX treatment. (J) Basal crypt PCNA-positive cell number per crypt of the whole small intestine on day 3 after MTX administration (30 crypts were counted for each mouse, and n = 5 mice per group randomly picked from 2 independent experiments). (K) Representative images of cultured crypts on day 6 in culture derived from mice on day 3 after indicated treatment. Lower line: zoomed in vision of images in square frames of the upper line. Scale bars: 100 μm (upper); 50 μm (lower). (L) Seeding efficiency of cultured crypts on day 3 and number of viable organoids of cultured crypts on day 6 (n = 5 mice per group randomly picked from 2 independent experiments). Results were displayed as mean±SD. n.s; nonsignificant; *: P < .05; **: P < .01; ***: P < .001; ****: P < .0001 by two-tailed, Student’s t test.

References

    1. Chan ES, Cronstein BN.. Methotrexate–how does it really work? Nat Rev Rheumatol. 2010;6:175–21. PMID:20197777. doi:10.1038/nrrheum.2010.5. - DOI - PubMed
    1. Visentin M, Zhao R, Goldman ID. The antifolates. Hematol Oncol Clin North Am. 2012;26:629–48,ix. PMID:22520983. doi:10.1016/j.hoc.2012.02.002. - DOI - PMC - PubMed
    1. Bookbinder SA, Espinoza LR, Fenske NA, Germain BF, Vasey FB. Methotrexate: its use in the rheumatic diseases. Clin Exp Rheumatol. 1984;2:185–193. PMID:6398173. - PubMed
    1. Toffoli G, Russo A, Innocenti F, Corona G, Tumolo S, Sartor F, Mini E, Boiocchi M. Effect of methylenetetrahydrofolate reductase 677C–>T polymorphism on toxicity and homocysteine plasma level after chronic methotrexate treatment of ovarian cancer patients. Int J Cancer. 2003;103:294–299. PMID:12471611. doi:10.1002/ijc.10847. - DOI - PubMed
    1. Brown PM, Pratt AG, Isaacs JD. Mechanism of action of methotrexate in rheumatoid arthritis, and the search for biomarkers. Nat Rev Rheumatol. 2016;12:731–742. PMID:27784891. doi:10.1038/nrrheum.2016.175. - DOI - PubMed

Publication types

MeSH terms

LinkOut - more resources