Review
. 2020 Jun;75(6):744-754.
doi: 10.1016/j.annemergmed.2019.09.020. Epub 2020 Jan 23.

Gene Expression Profiles in Children With Suspected Sepsis

Affiliations
Review

Gene Expression Profiles in Children With Suspected Sepsis

Fran Balamuth et al. Ann Emerg Med. 2020 Jun.

Abstract

Study objective: Sepsis recognition is a clinical challenge in children. We aim to determine whether peripheral blood gene expression profiles are associated with pathogen type and sepsis severity in children with suspected sepsis.

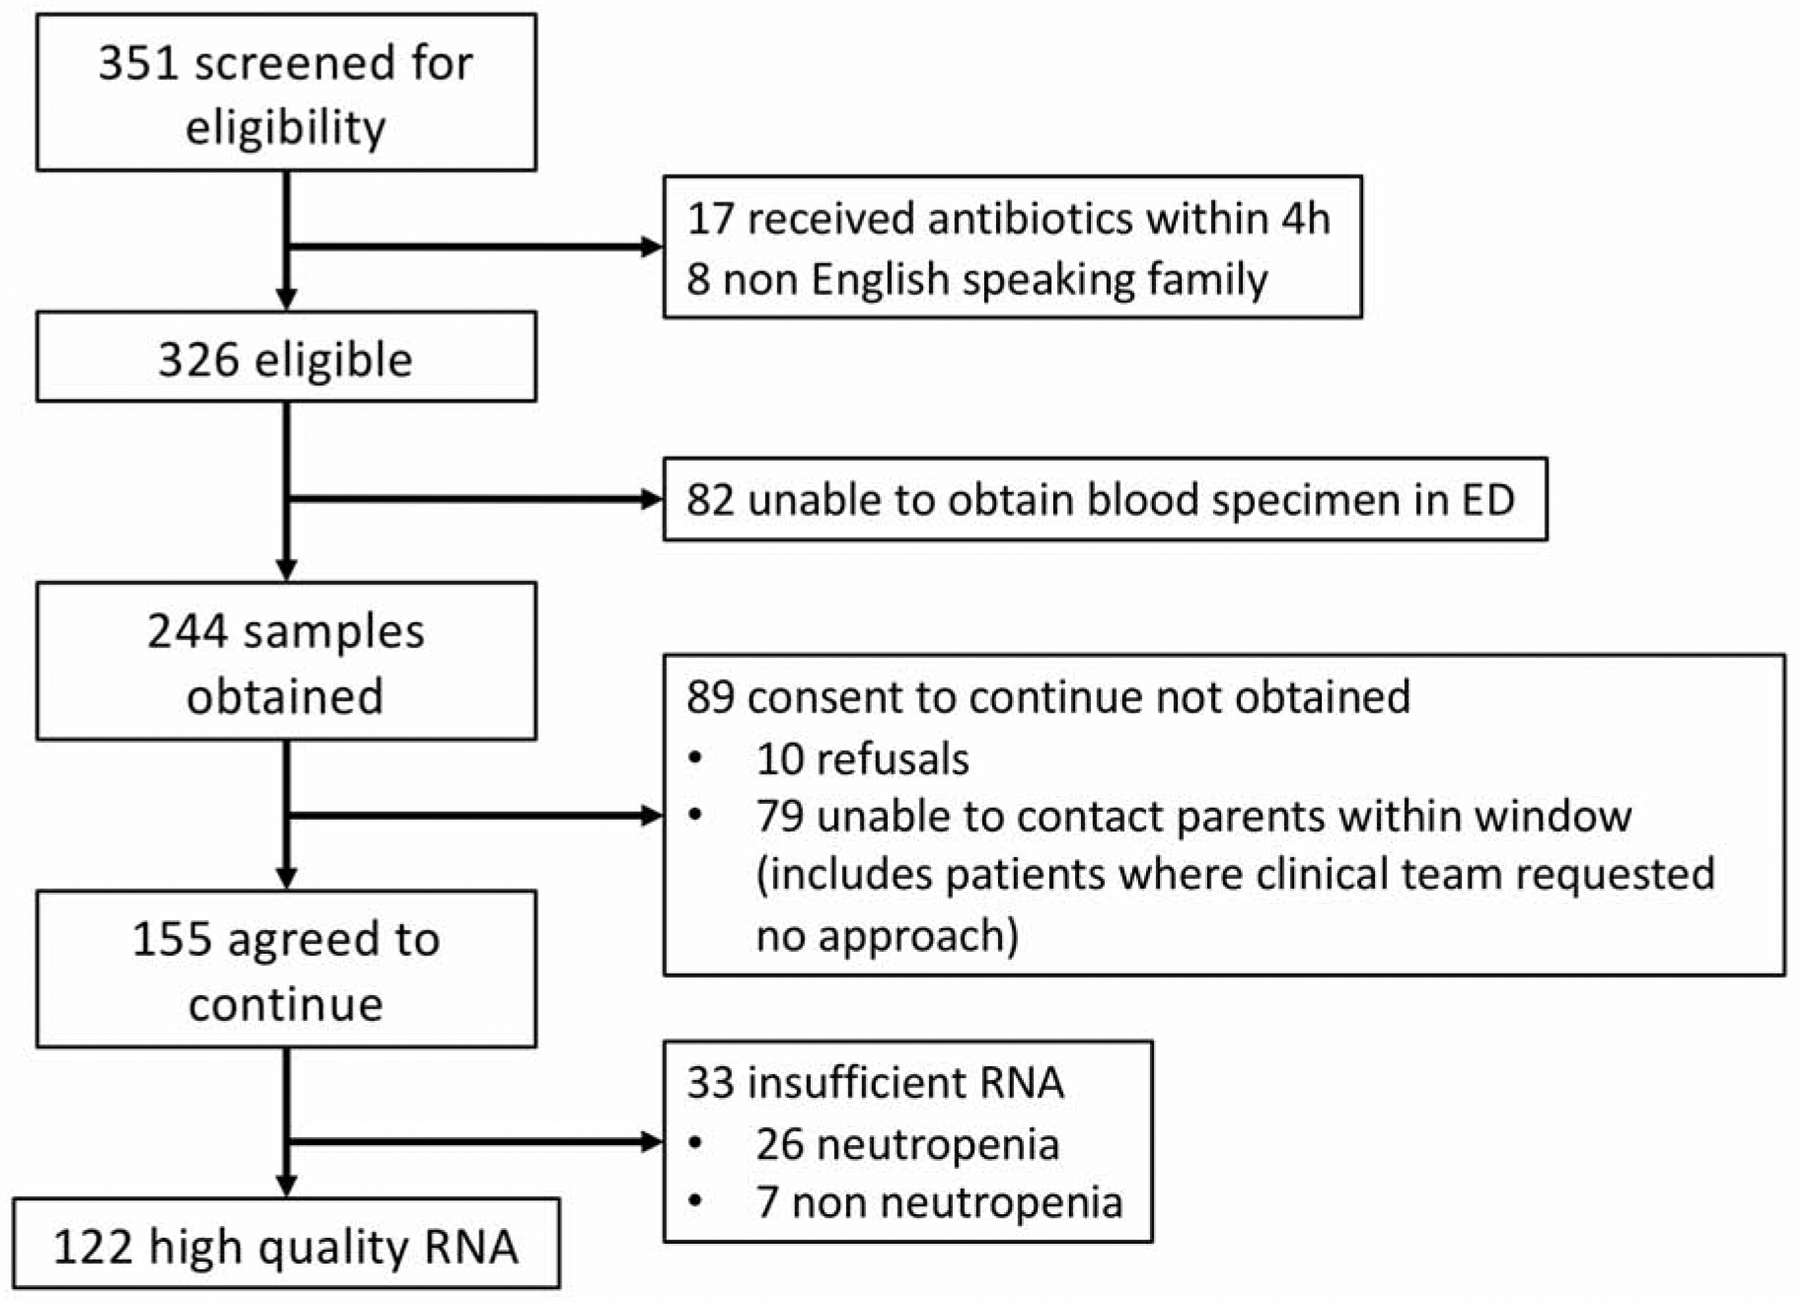
Methods: This was a prospective pilot observational study in a tertiary pediatric emergency department with a convenience sample of children enrolled. Participants were older than 56 days and younger than 18 years, had suspected sepsis, and had not received broad-spectrum antibiotics in the previous 4 hours. Primary outcome was source pathogen, defined as confirmed bacterial source from sterile body fluid or confirmed viral source. Secondary outcome was sepsis severity, defined as maximum therapy required for shock reversal in the first 3 hospital days. We drew peripheral blood for ribonucleic acid isolation at the sepsis protocol activation, obtained gene expression measures with the GeneChip Human Gene 2.0 ST Array, and conducted differential expression analysis.

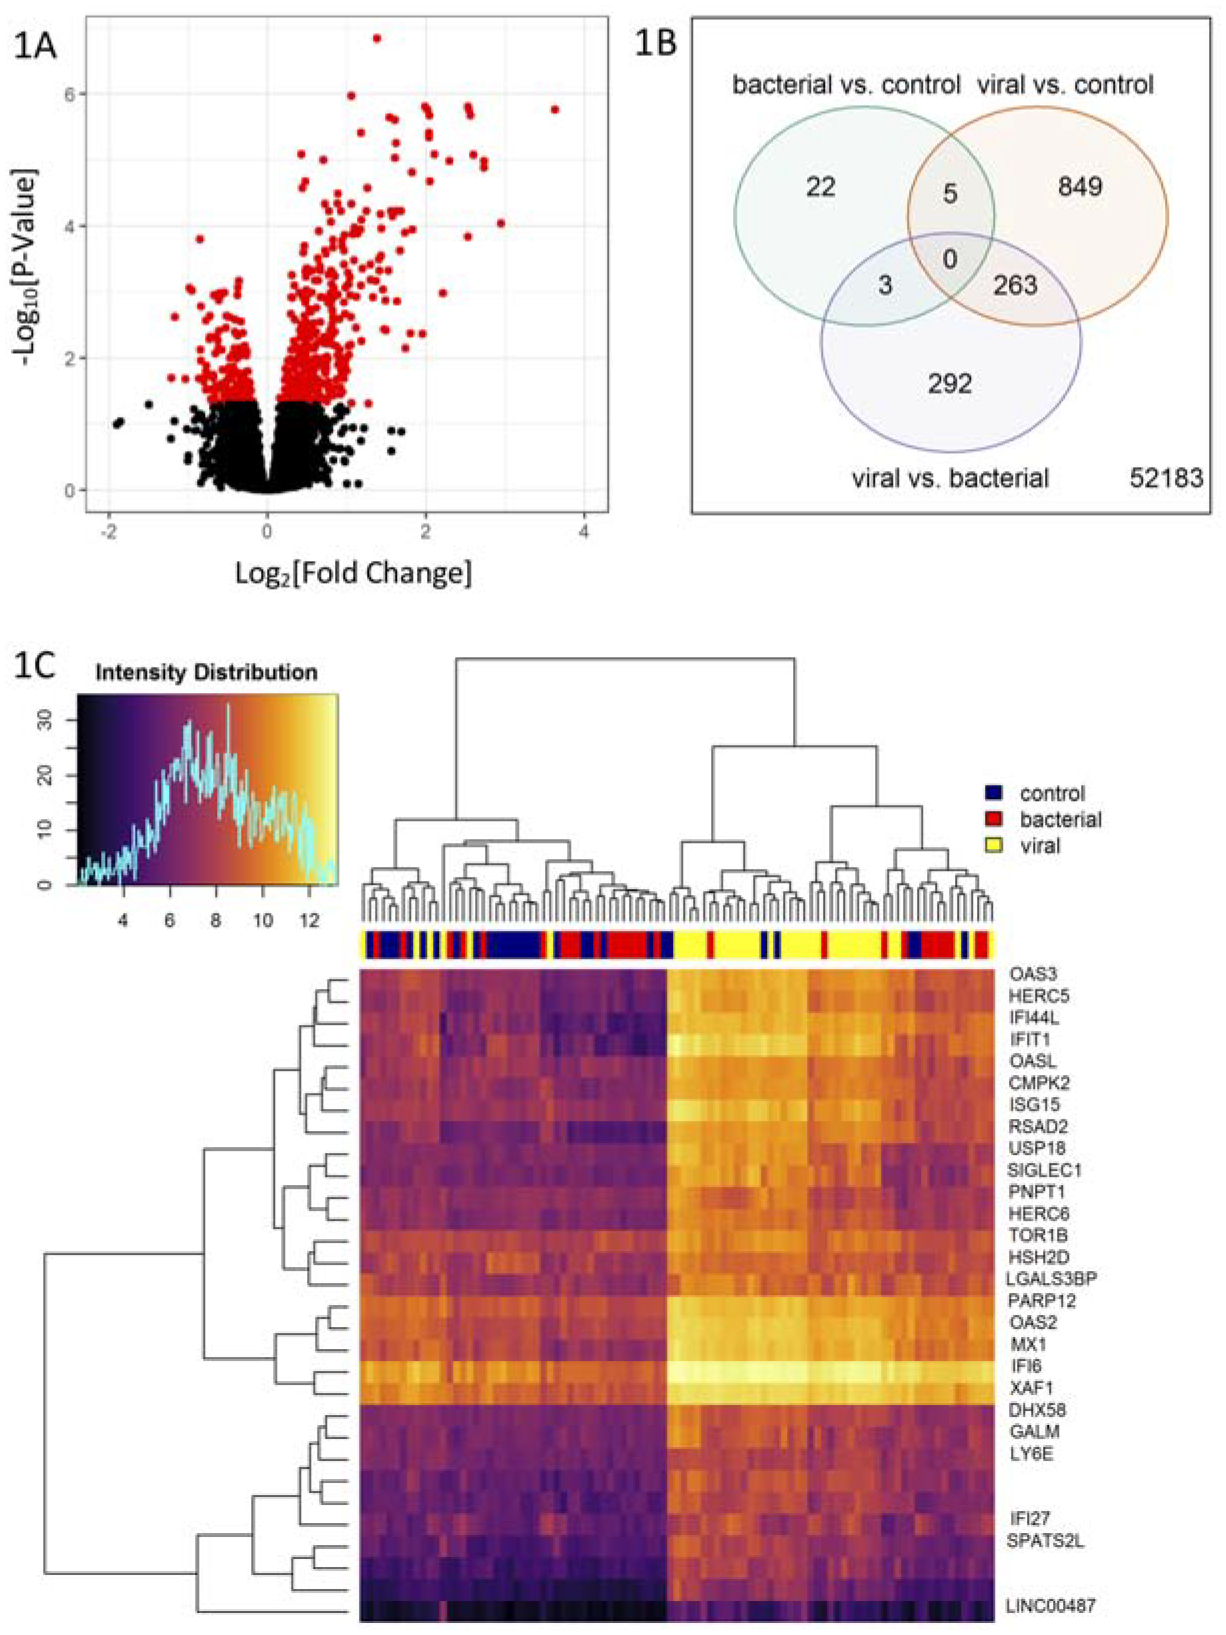
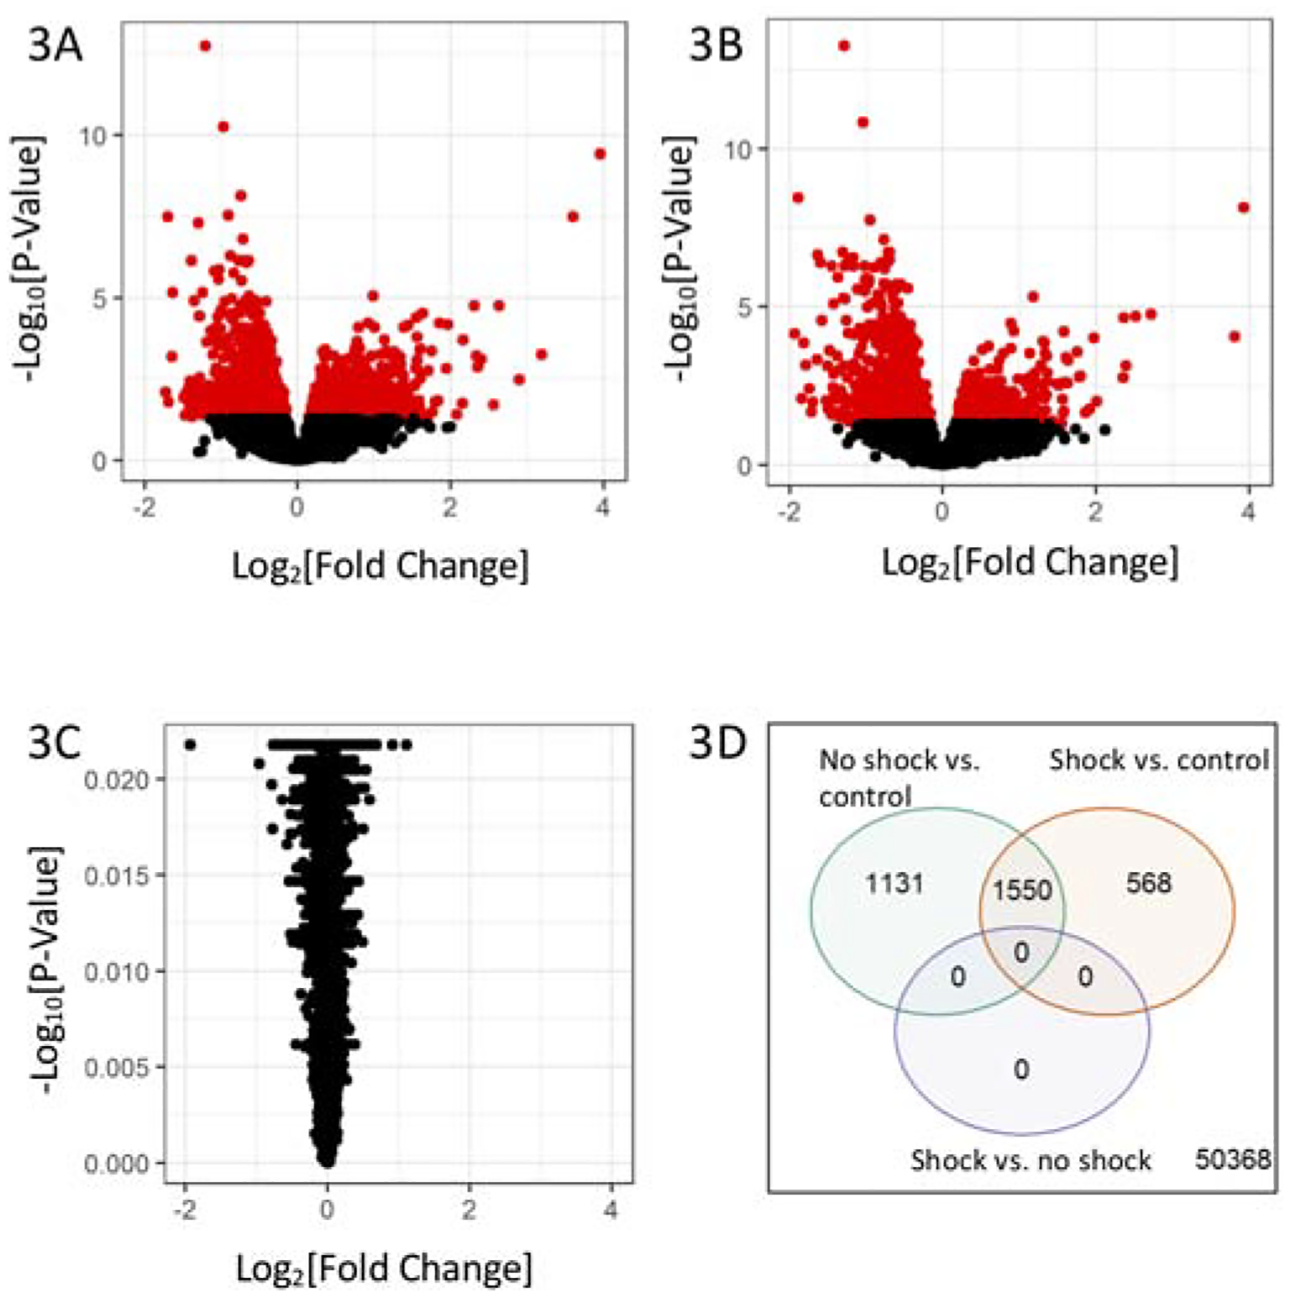
Results: We collected ribonucleic acid samples from a convenience sample of 122 children with suspected sepsis and 12 healthy controls. We compared the 66 children (54%) with confirmed bacterial or viral infection and found 558 differentially expressed genes, many related to interferon signaling or viral immunity. We did not find statistically significant gene expression differences in patients according to sepsis severity.

Conclusion: The study demonstrates feasibility of evaluating gene expression profiling data in children evaluated for sepsis in the pediatric emergency department setting. Our results suggest that gene expression profiling may facilitate identification of source pathogen in children with suspected sepsis, which could ultimately lead to improved tailoring of sepsis treatment and antimicrobial stewardship.


Conflict of interest statement

Conflict of Interest:

The authors have no conflicts of interest to disclose.

Figures

Figure 1:
Figure 1:
Enrollment diagram.
Figure 2.
Figure 2.
Gene Expression Differences According to Pathogen Type. A) Volcano plot of gene differential expression in children with confirmed viral vs. confirmed bacterial infections. The y-axis corresponds to the negative log (base 10) of adjusted P-values while the x-axis corresponds to the log (base 2) of the fold change of difference between categories. Differentially expressed genes according to an adjusted p-value <0.05 are colored in red. B) Venn diagram of the differential expressed genes from three two-group comparisons of children infected by bacterial pathogens vs. controls (green), children infected by viral pathogens vs. controls (orange), and children infected by viral pathogens vs. by bacterial pathogens (purple). C) Heatmap and dendrogram of 30 prioritized differential expressed genes in children infected by viral pathogens vs. by bacterial pathogens. Differentially expressed genes were selected according to an adjusted p-value <10−4 and an absolute log2 fold change >1.2. Hierarchical clustering is based on the Euclidean distance between the probe intensities.
Figure 3.
Figure 3.
Gene Expression Differences According to Shock Status. A) Volcano plots of gene differential expression in children with no shock vs. controls, B) children with shock vs. control, and C) children with shock vs. with no shock. The y-axis corresponds to the negative log (base 10) of adjusted P-values while the x-axis corresponds to the log (base 2) of the fold change of difference between categories. Differentially expressed genes according to an adjusted p-value <0.05 are colored in red. D) Venn diagram of the differential expressed genes from three two-group comparisons of children with no shock vs. controls (green), children with shock vs. controls (orange), and children with shock vs. no shock (purple).

Similar articles

Cited by

References

    1. Balamuth F, Weiss SL, Neuman MI, et al. Pediatric severe sepsis in U.S. children’s hospitals. Pediatr Crit Care Med. 2014;15(9). doi:10.1097/PCC.0000000000000225 - DOI - PMC - PubMed
    1. Hartman ME, Linde-Zwirble WT, Angus DC, Watson RS. Trends in the epidemiology of pediatric severe sepsis*. Pediatr Crit Care Med. 2013. doi:10.1097/PCC.0b013e3182917fad - DOI - PubMed
    1. Ruth A, McCracken CE, Fortenberry JD, Hall M, Simon HK, Hebbar KB. Pediatric Severe Sepsis. Pediatr Crit Care Med. 2014. doi:10.1097/PCC.0000000000000254 - DOI - PubMed
    1. Arulkumaran N, Deutschman CS, Pinsky MR, et al. Mitochondrial function in sepsis. Shock. 2016. doi:10.1097/SHK.0000000000000463 - DOI - PMC - PubMed
    1. Bernard AM, Bernard GR. The immune response: Targets for the treatment of severe sepsis. Int J Inflam. 2012. doi:10.1155/2012/697592 - DOI - PMC - PubMed

Publication types