. 2020 Feb 6;77(3):645-655.e7.
doi: 10.1016/j.molcel.2020.01.003. Epub 2020 Jan 23.

Maintaining Iron Homeostasis Is the Key Role of Lysosomal Acidity for Cell Proliferation

Affiliations

Maintaining Iron Homeostasis Is the Key Role of Lysosomal Acidity for Cell Proliferation

Ross A Weber et al. Mol Cell. .

Abstract

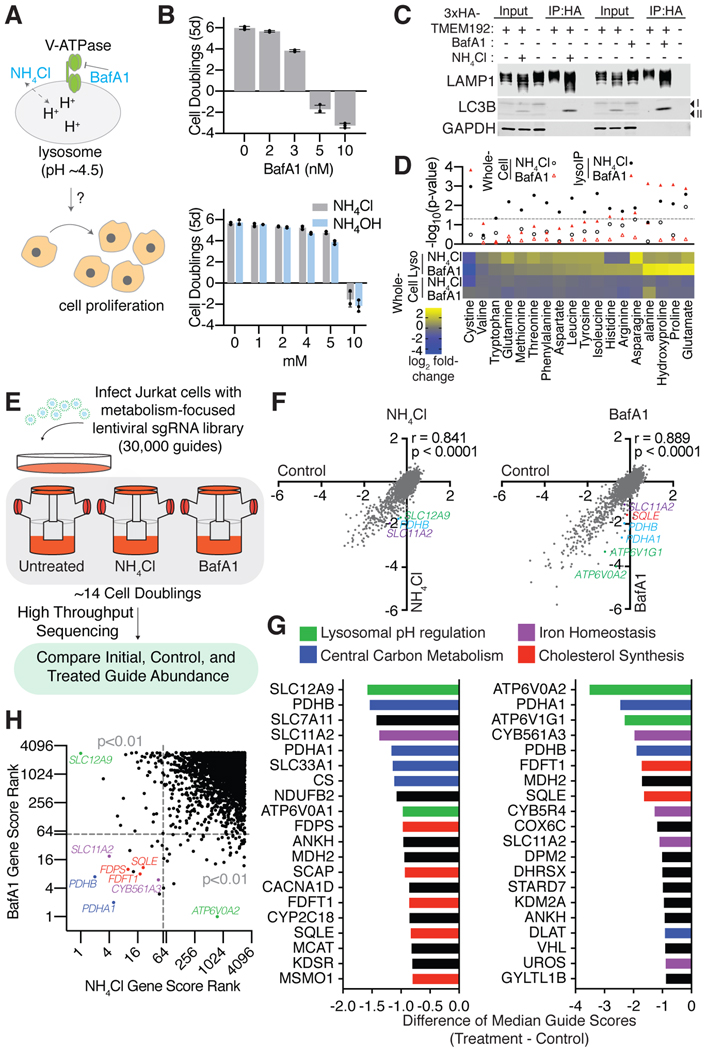
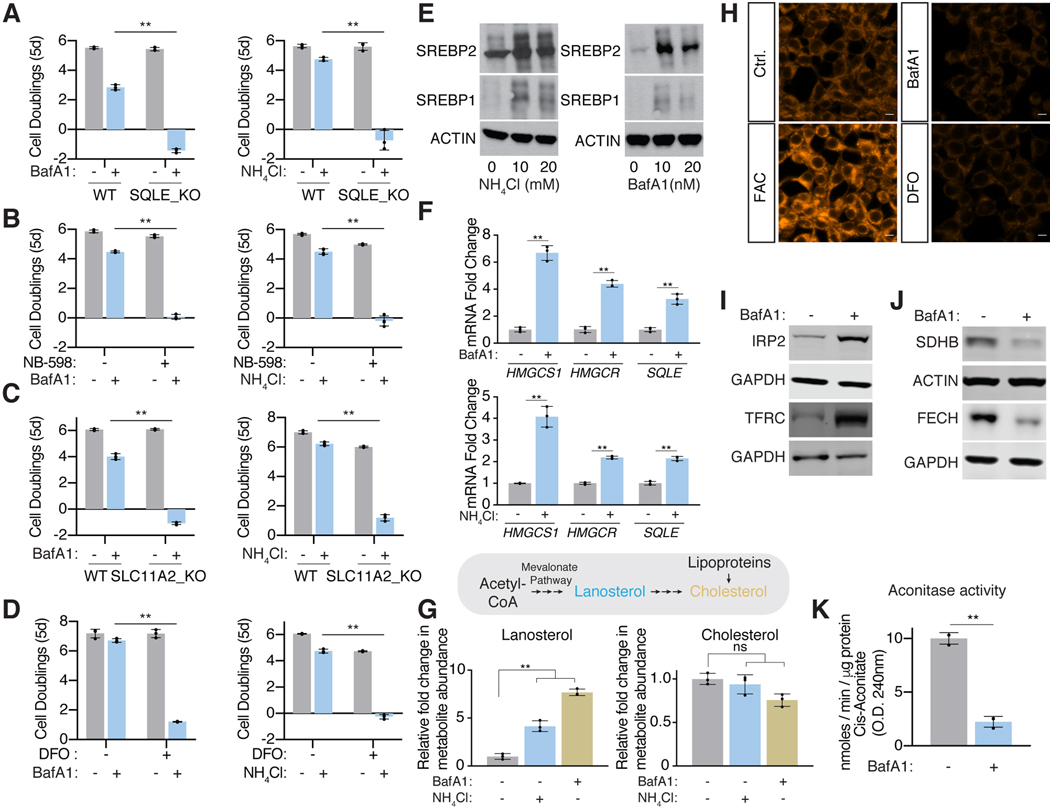
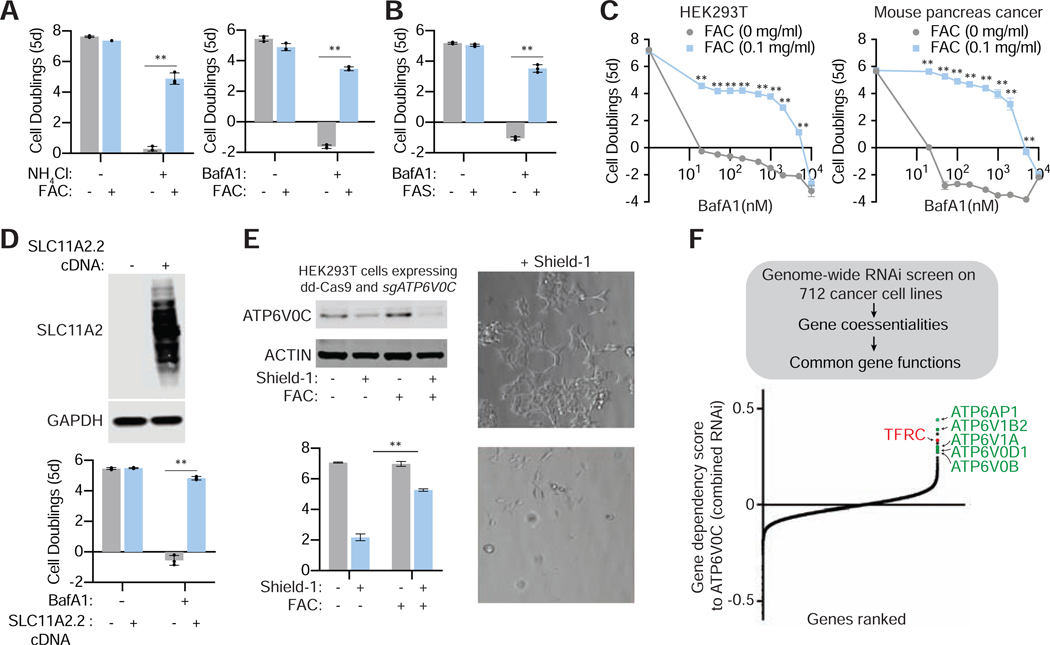
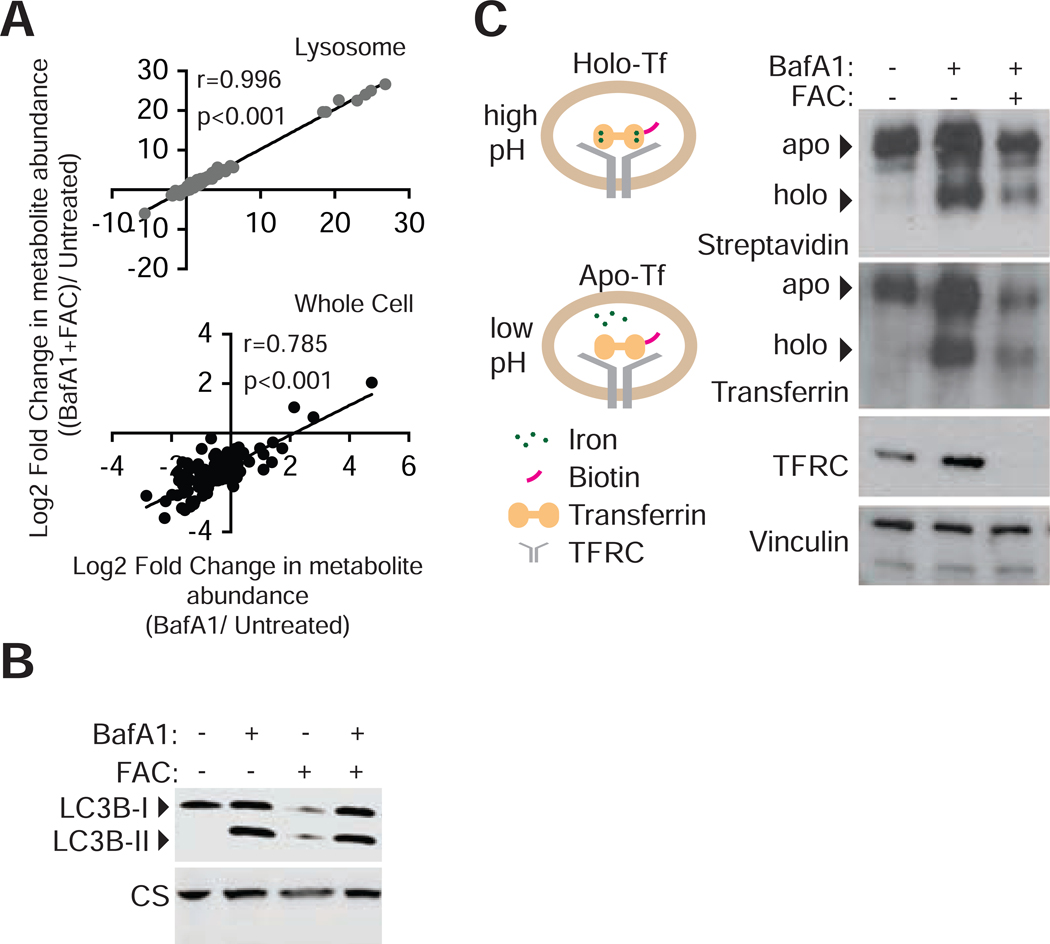
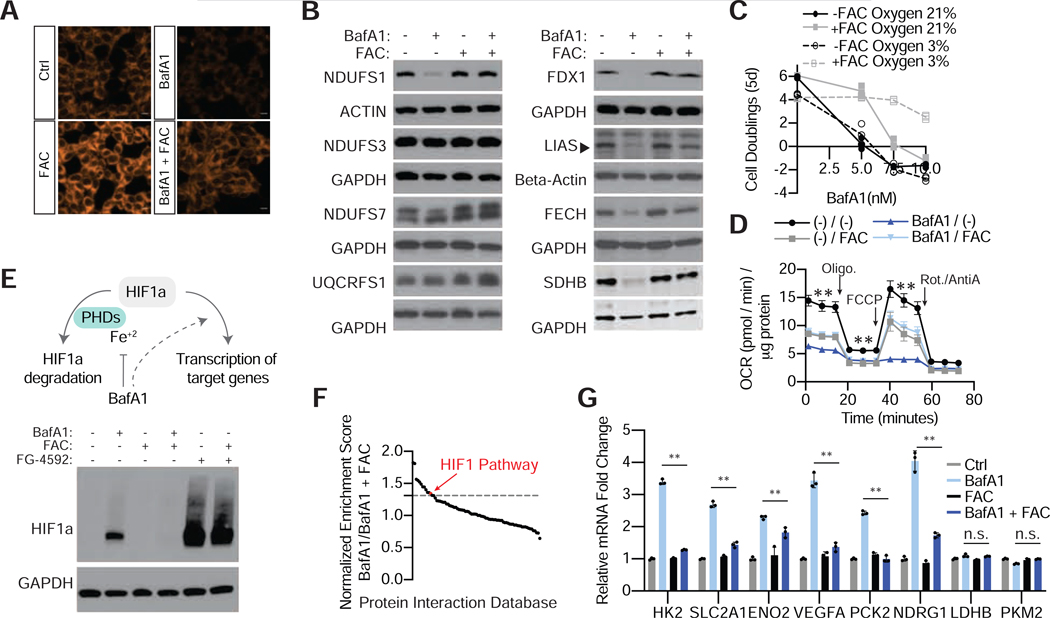
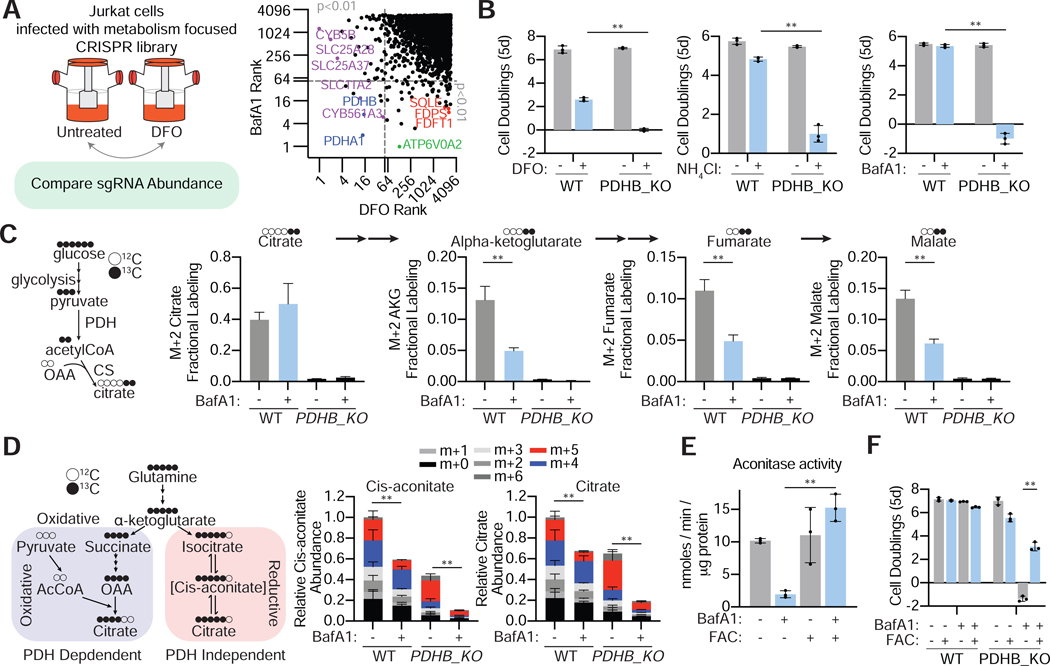
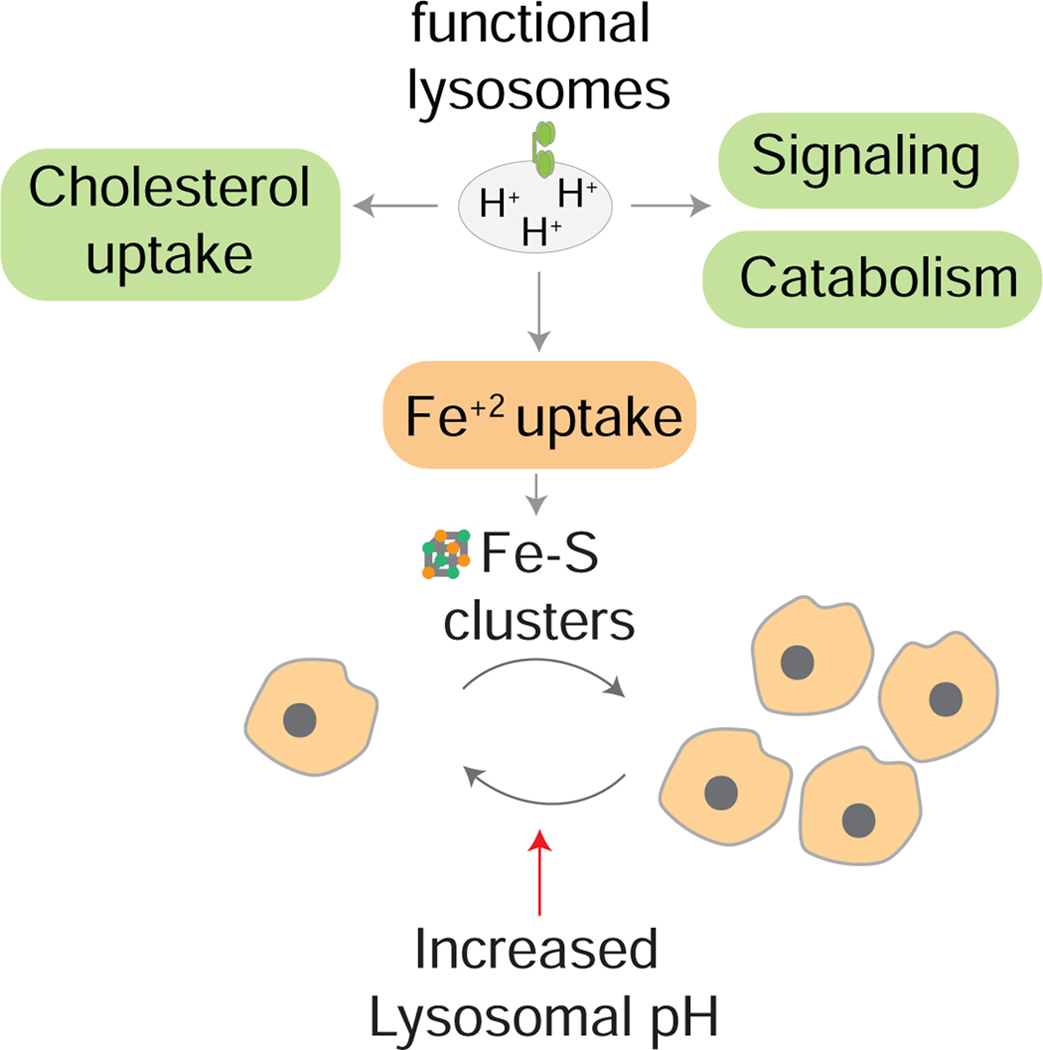
The lysosome is an acidic multi-functional organelle with roles in macromolecular digestion, nutrient sensing, and signaling. However, why cells require acidic lysosomes to proliferate and which nutrients become limiting under lysosomal dysfunction are unclear. To address this, we performed CRISPR-Cas9-based genetic screens and identified cholesterol biosynthesis and iron uptake as essential metabolic pathways when lysosomal pH is altered. While cholesterol synthesis is only necessary, iron is both necessary and sufficient for cell proliferation under lysosomal dysfunction. Remarkably, iron supplementation restores cell proliferation under both pharmacologic and genetic-mediated lysosomal dysfunction. The rescue was independent of metabolic or signaling changes classically associated with increased lysosomal pH, uncoupling lysosomal function from cell proliferation. Finally, our experiments revealed that lysosomal dysfunction dramatically alters mitochondrial metabolism and hypoxia inducible factor (HIF) signaling due to iron depletion. Altogether, these findings identify iron homeostasis as the key function of lysosomal acidity for cell proliferation.

Keywords: CRISPR; Chelation; Genetic Screens; Iron Depletion; Iron Homeostasis; Iron Sulfur Clusters; Lysosomal Acidity; Lysosomal Dysfunction; Organelle Metabolism; v-ATPase.


Conflict of interest statement

Declaration of Interests The authors declare no competing interests.

Figures

Figure 1:
Figure 1:. A metabolism-focused CRISPR-Cas9 genetic screen identifies genes whose loss sensitizes cells to lysosomal pH inhibitors
(A) Maintaining lysosomal pH is essential for cells to proliferate. Ammonia and BafAl disrupts lysosomal pH through different mechanisms. (B) Dose-dependent effects of BafAland ammonia on Jurkat cell proliferation (mean ± SD, n=3). (C) Immunoblotting for lysosomal markers in input, purified lysosomes, or control immunoprecipitates in the presence or absence of BafAl (10nm) or NH4Cl (10mM). Lysates were prepared from cells expressing 3xHA-tagged TMEM192 (HA-Lyso cells) or 3xFLAG-tagged TMEM192 (FLAG control cells). (D) Metabolite abundance in cells or lysosomes upon treatment with BafA1 (10nm) or NH4Cl (10mM). P-values are for comparisons between metabolite concentrations in whole-cell or lysosome samples (upper panel) (n = 3 for each treatment; dotted line represents P = 0.05). Heat map of fold changes (log2) in metabolite concentrations of treatment relative to control (lower panel). (E) Scheme describing the pooled CRISPR-based screen. (F) Gene scores in untreated versus ammonia-treated (3mM) Jurkat cells (left). Gene scores in untreated versus BafA1-treated (3nM) Jurkat cells (right). The gene score is the median log2 fold change in the abundance of all sgRNAs targeting that gene during the culture period. Most genes, as well as non-targeting control sgRNAs, have similar scores in the presence or absence of the treatments. (G) Top 20 genes scoring as differentially required upon ammonia (left) or BafA1 (right) treatment. Genes associated with lysosomal pH regulation are indicated in green, iron homeostasis in purple, central carbon metabolism in blue and cholesterol synthesis in red. (H) Plot of gene score ranks from ammonia and BafA1 screens. Significant (P<0.01) unique hits in the BafA1 are in the lower right quartile, significant unique hits in the ammonia screen are in the upper left quartile, and significant hits shared in both screens are in the lower left quartile.
Figure 2:
Figure 2:. Upon lysosomal pH dysfunction, cells depend on cholesterol synthesis and iron uptake and activate starvation response pathways
(A) SQLE knockout cells die upon BafA1(2nm) (left) or ammonia (5mM) (right) treatment. Fold change in cell number (log2) of wild type and SQLE knockout Jurkat cells after treatment with indicated molecules for 5 days (mean ± SD, n=3, **p<0.05). (B) Inhibition of SQLE using a small molecule inhibitor (NB-598; 10 μM) is synthetic lethal with lysosomal pH disruption. Fold change in cell number (log2) of untreated or NB-598 (10μM) treated Jurkat cells under BafA1(3nM) (left) or ammonia (5mM) (right) for 5 days (mean ± SD, n=3, **p<0.05). (C) SLC11A2 knockout cells die upon BafA1(3nM) (left) or ammonia (4mM) treatment (right). Fold change in cell number (log2) of wild type and SLC11A2 knockout Jurkat cells after treatment with indicated molecules for 5 days (mean ± SD, n=3, **p<0.05). (D) Iron chelation using deferoxamine (DFO) is synthetic lethal with lysosomal pH inhibition. Fold change in cell number (log2) of untreated or DFO (3μM) treated Jurkat cells under BafA1(3nM) (left) or ammonia (4mM) (right) for 5 days (mean ± SD, n=3, **p<0.05). (E) Immunoblotting for SREBP-1 and −2 cleavage in Jurkat cells in the presence or absence of BafA1 (right) or ammonia (left). (F) qRT-PCR analysis for the indicated mRNAs in the presence or absence of BafA1 (10nM) (top) or ammonia (10mM) (bottom) (mean ± SD, n=3, **p<0.05). (G) Mevalonate pathway in human cells (top). Relative lanosterol or cholesterol levels in Jurkat cells treated with BafAl (10nM) or ammonia (10mM) after a 24-hour treatment using LC-MS/MS (mean ± SD, for n=3, **p<0.05). All measurements are relative to untreated wild type Jurkat cells. (H) Ferro-orange staining for intracellular Fe2+ in 293T cells treated for 24h in the presence or absence of BafAl (10nM) or DFO (100μM). Shown is one of five representative fields illustrating fluorescence intensity taken at identical exposures for each condition. Scale bar, 10 μm. (I) Immunoblotting for the iron response pathway proteins (IRP2 and TFRC) in 293T cells in the presence or absence of BafA1 (10nM). (J) Immunoblotting for iron sulfur cluster containing proteins SDHB and FECH in 293T cells in the presence or absence of BafA1 (10nM). (K) Relative aconitase activity in 293T cells grown 24h in the presence or absence of BafA1 (10nM). (mean ± SD, for n=3, **p<0.05).
Figure 3:
Figure 3:. Iron supplementation is sufficient to enable human cells upon pharmacological and genetic disruption of lysosomal pH
(A) Iron (Ferric (III) Ammonium Citrate (FAC)) rescues the proliferation of Jurkat cells under lysosomal dysfunction. Fold change in cell number (log2) in the presence or absence of NH4Cl (10mM) (left) or BafA1(5nM) (right) and/or FAC (0.1mg/ml) (blue) for 5 days (mean ± SD, n=3, **p<0.05). (B) Ferrous (II) Ammonium Sulfate (FAS) also rescues proliferation of Jurkat cells under lysosomal pH inhibition. Fold change in cell number (log2) in the presence or absence of or BafA1(5nM) and/or FAS (0.1mg/ml) (blue) for 5 days (mean ± SD, n=3, **p<0.05). (C) Iron supplementation at indicated concentrations rescues cell proliferation in HEK293T and HT cells under BafilomycinA1 concentrations up to 2μM. Fold change in cell number (log2) in the presence or absence of BafA1 and/or FAC (mean ± SD, n=3, **p<0.05). (D) Expression of SLC11A2 isoform 2 is sufficient to enable proliferation of cells upon lysosomal pH inhibition. Expression of SLC11A2.2 rescues BafA1 sensitivity of the Kras/p53 mouse cancer cell lines. Immunoblot analysis of wild type and SLC11A2 expressing Kras p53 cell line (top). GAPDH was used as a loading control. Fold change in cell number (log2) of empty vector (EV) (gray) and SLC11A2 cDNA (blue) expressing cells after a 5-day treatment with BafA1(10nM) (blue) (mean ± SD, for n=3, **p<0.05) (bottom). (E) Iron supplementation enables v-ATPase deficient cells to survive and proliferate. Immunoblots for ATP6V0C in HEK293T cell line infected with sgATP6V0C virus in the presence or absence of Shield-1 (500 nM; top). Relative fold change in cell viability of indicated cancer cell lines grown in the absence and presence of Shield-1 and iron (FAC 0.1mg/ml) for 5 days (bottom) (mean ± SD, for n=3, **p<0.05). Representative bright-field micrographs of indicated cells after a 5-day BafA1 treatment in the absence or presence of iron (right). (F) Schematic depicting co-essentiality analysis from RNAi screens using DepMAP data (top). Correlations of gene essentialities of ATP6V0C with other genes were calculated and ranked (bottom). TFRC is indicated in red and other VATPase subunits in green.
Figure 4:
Figure 4:. Iron-mediated rescue of cell proliferation is independent of signaling and metabolite changes associated with lysosomal acidity
(A) Comparison of metabolite abundance in 293T whole cells or purified lysosomes upon treatment with BafAl (10nM) in the presence or absence of iron supplementation (FAC 0.4 mg/ml). (Lysosomes r= 0.996, p<0.001; Whole cell r=0.785, P<0.001) (B) Iron release from transferrin depends on lysosomal acidity. 293T lysates following uptake of biotinylated-holotransferrin, after 24-hour control, BafA1(10nM), or BafAl and FAC (0.1mg/ml) treatments were immobilized on PDVF membranes. Immunoblotting for TF, TFRC, and vinculin loading controls or incubation of membrane with HRP-streptavidin (C) Immunoblotting for LC3B-II accumulation as an indicator of inhibition of autophagy completion in cells grown under BafA1 (10nM) or FAC (0.4mg/ml) for 24 hours.
Figure 5:
Figure 5:. Cellular processes restored by iron supplementation under lysosomal dysfunction
(A) Ferro-orange staining for intracellular Fe2+ in 293T cells cultured in the presence or absence of BafA1 (10nM) and/or FAC (0.1mg/ml). Shown is one of five representative fields illustrating fluorescence intensity taken at identical exposures for each condition. Scale bar, 10 μm. (B) Immunoblotting for the indicated iron sulfur cluster containing proteins. GAPDH and Beta-actin are used as loading controls. (C) High oxygen levels disrupt iron sulfur clusters. Fold change in cell number (log2) of Jurkat cells in the absence and presence of FAC (0.1mg/mL) and hypoxia after treatment with indicated concentrations of BafA1 for 5 days (mean ± SD, n=3, **p<0.05). (D) Oxygen consumption rate in 293T cells in the presence and absence of BafA1 (10nM) with and without iron supplementation (FAC 0.1mg/ml) (mean ± SD, n=9, **p<0.05). (E) Illustration of HIF1a stabilization by BafA1-mediated iron depletion (left). Immunoblotting for HIF1a in 293T cells grown in the presence or absence of BafA1 (10nM) and/or FAC (0.1mg/ml) (right). (F) Gene set enrichment analysis (GSEA) on FPKM values from RNA-seq performed on 293T cells grown in the presence or absence of BafA1 (10nM) and/or FAC (0.1mg/ml). Graphed are normalized enrichment scores from 86 enriched pathways using the protein interaction database as the gene set. Values above the gray dotted line are pathways enriched with a nominal p-value <0.05. Highlighted in red is the HIF1a pathway. (G) Relative expression of canonical HIF1a transcription targets (FPKM normalized to Control) from above RNA-seq experiment (mean ± SD, n=3, **p<0.05).
Figure 6:
Figure 6:. Lysosomal acidity couples iron homeostasis to mitochondrial citrate synthesis
(A) Scheme of CRISPR/Cas9 screen of deferoxamine-mediated iron chelation (left). Plot of gene score ranks from DFO and BafA1 screens (right). Significant (P<0.01) unique hits in the BafA1 are in the lower right quartile, significant unique hits in the DFO screen are in the upper left quartile, and significant hits shared in both screens are in the lower left quartile. (B) Fold change in cell number (log2) of parental and PDHB null Jurkat cells in the absence or presence of DFO (3μM), BafA1 (3nM) and ammonia (4mM) for 5 days (mean ± SD, n=3, **p<0.05). (C) Illustration of isotopic labeling of citrate and downstream TCA cycle intermediates from U13C-glucose (left). m+2 fraction labeled metabolites represent the pyruvate dehydrogenase-dependent labeling. Citrate and downstream TCA cycle intermediates m+2 fraction labeling in WT and PDHB-null Jurkat cells in the absence and presence of BafA1 (10nM) (right) (mean ± SD, n=3, **p<0.05). (D) Illustration of isotopic labeling of citrate and cis-aconitate from U13C-glutamine (left). m+4 labeled citrate and cis-aconitate represents the oxidative, pyruvate dehydrogenase dependent and aconitase independent labeling. m+5 labeled citrate represents the oxidative, pyruvate dehydrogenase independent and aconitase dependent labeling. Relative citrate and cis-aconitate abundance in WT and PDHB-null Jurkat cells in the absence and presence of BafA1 (10nM) (right) (mean ± SD, n=3, **p<0.05). Statistical analysis was performed on the m+5 fraction. (E) Aconitase activity in 293T cells in the presence and absence of BafA1 (10nM) with and without iron supplementation (FAC 0.1mg/ml) (mean ± SD, n=3, **p<0.05). (F) Fold change in cell number (log2) of parental and PDHB null Jurkat cells in the absence and presence of Ferric ammonium citrate (0.1mg/ml) and BafA1 (3nM) (mean ± SD, n=3, **p<0.05).
Figure 7:
Figure 7:. Maintaining iron homeostasis is the key role of lysosomal acidity for mitochondrial function and cell proliferation
Schematic illustrating that although lysosomes participate in many key cellular functions including cholesterol uptake, signaling, and autophagy, iron is the essential function of lysosomes for cell proliferation under inhibition of lysosomal acidification. In this context, iron supplementation restores loss of iron sulfur clusters and is sufficient to rescue cell viability and proliferation.

References

    1. Abu-Remaileh M, Wyant GA, Kim C, Laqtom NN, Abbasi M, Chan SH, Freinkman E, and Sabatini DM (2017). Lysosomal metabolomics reveals V-ATPase-and mTOR-dependent regulation of amino acid efflux from lysosomes. Science 358, 807–813. - PMC - PubMed
    1. Alvarez SW, Sviderskiy VO, Terzi EM, Papagiannakopoulos T, Moreira AL, Adams S, Sabatini DM, Birsoy K, and Possemato R (2017). NFS1 undergoes positive selection in lung tumours and protects cells from ferroptosis. Nature 551, 639–643. - PMC - PubMed
    1. Appelmans F, Wattiaux R, and De Duve C (1955). Tissue fractionation studies. 5. The association of acid phosphatase with a special class of cytoplasmic granules in rat liver. Biochem J 59, 438–445. - PMC - PubMed
    1. Ast T, Meisel JD, Patra S, Wang H, Grange RMH, Kim SH, Calvo SE, Orefice LL, Nagashima F, Ichinose F, et al. (2019). Hypoxia Rescues Frataxin Loss by Restoring Iron Sulfur Cluster Biogenesis. Cell 177, 1507–1521e1516. - PMC - PubMed
    1. Bainton DF (1981). The discovery of lysosomes. J Cell Biol 91, 66s–76s. - PMC - PubMed

Publication types