. 2018;173(2):10.
doi: 10.1007/s00410-017-1435-0. Epub 2018 Jan 12.

Melt inclusion constraints on petrogenesis of the 2014-2015 Holuhraun eruption, Iceland

Affiliations

Melt inclusion constraints on petrogenesis of the 2014-2015 Holuhraun eruption, Iceland

Margaret E Hartley et al. Contrib Mineral Petrol. 2018.

Abstract

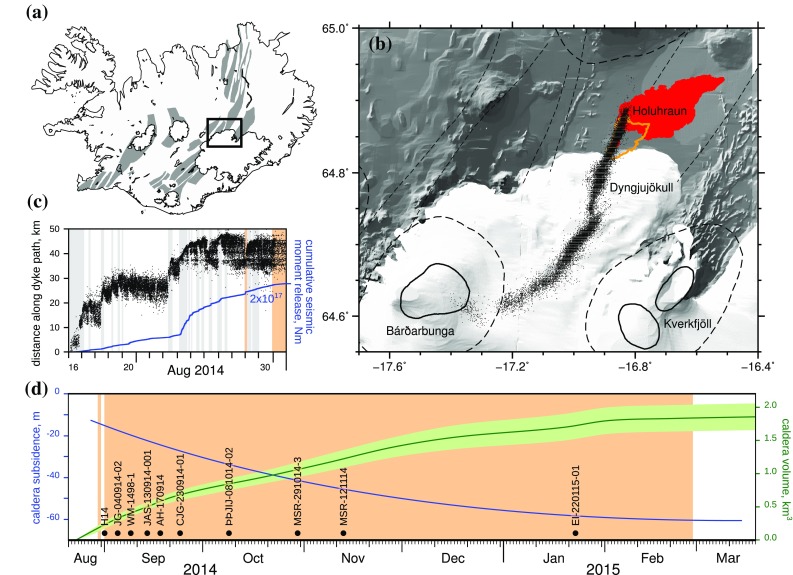
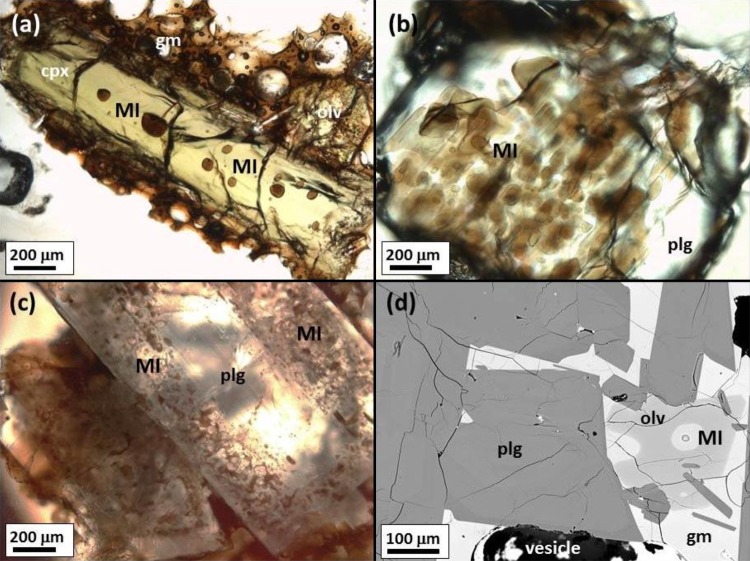
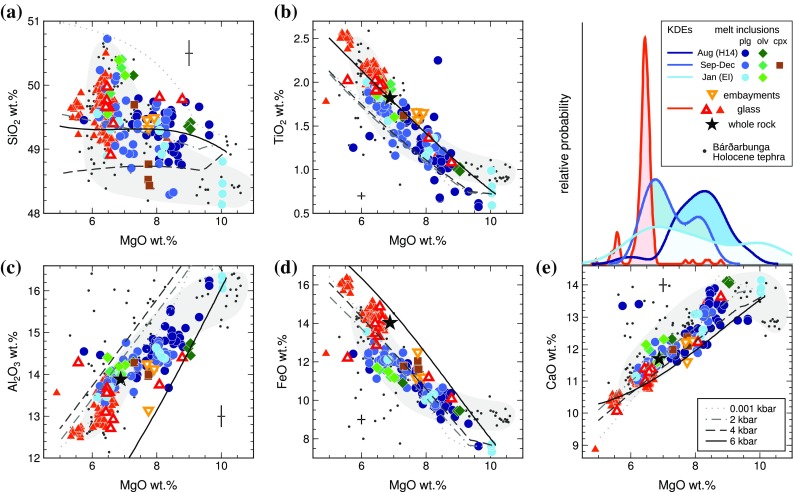
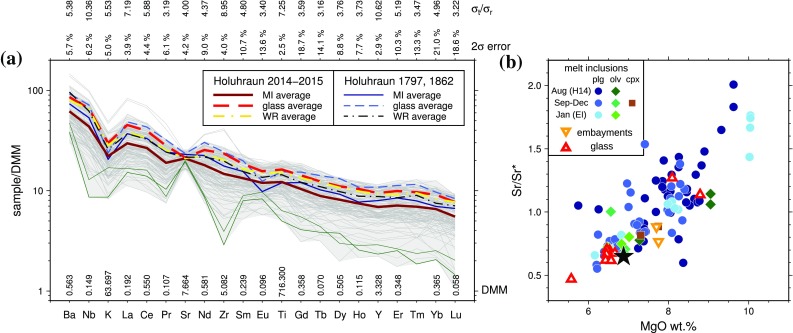
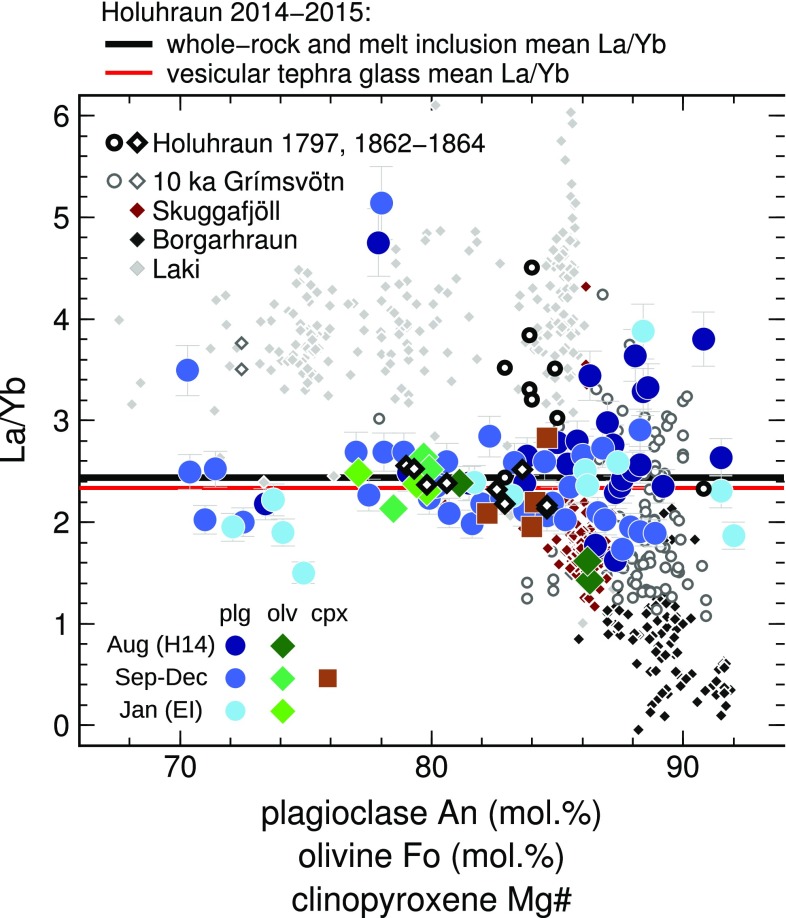
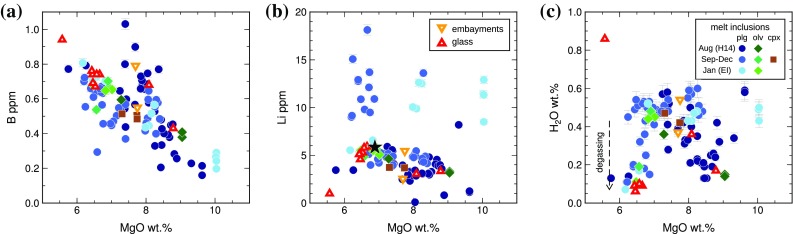
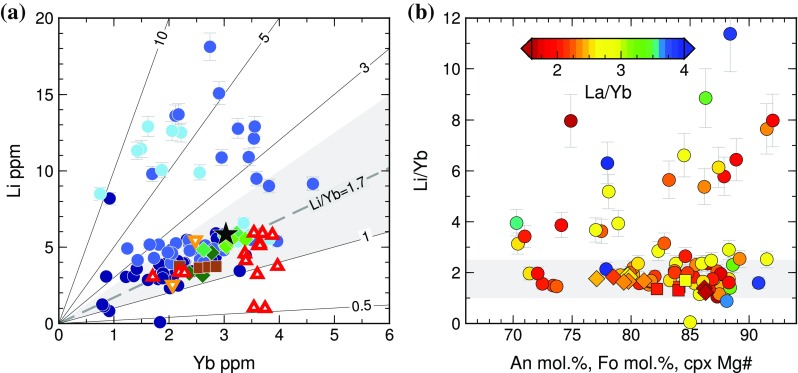
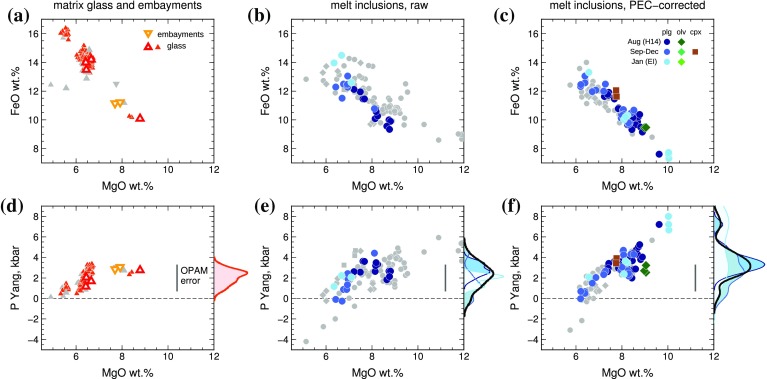
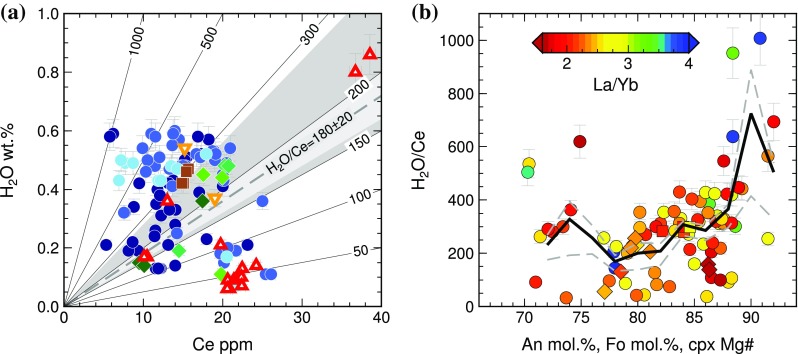
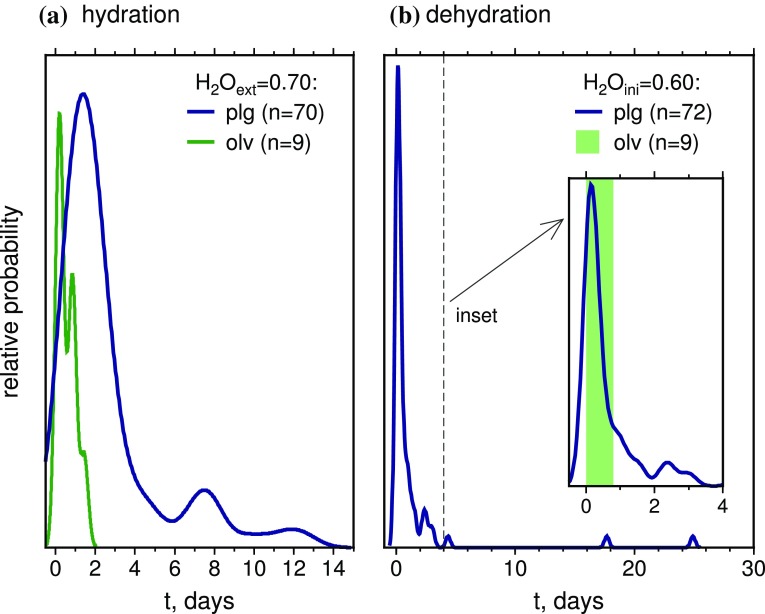
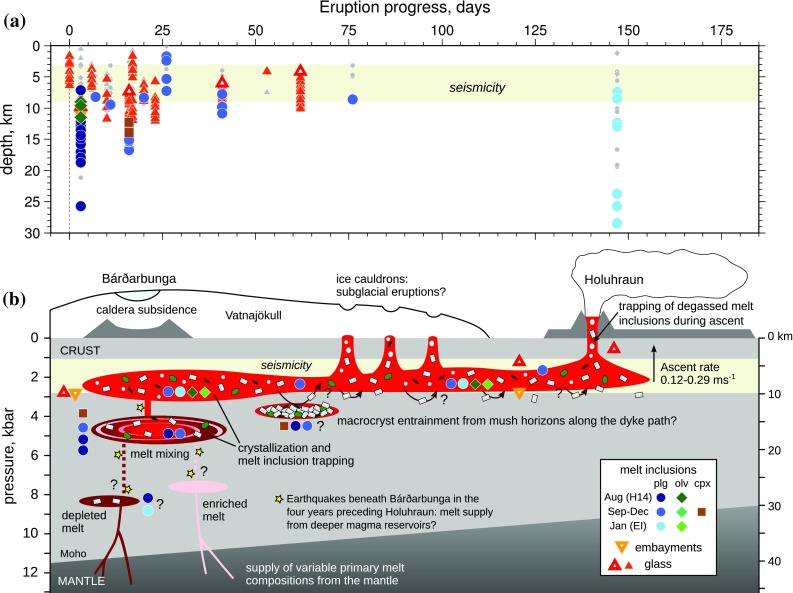
The 2014-2015 Holuhraun eruption, on the Bárðarbunga volcanic system in central Iceland, was one of the best-monitored basaltic fissure eruptions that has ever occurred, and presents a unique opportunity to link petrological and geochemical data with geophysical observations during a major rifting episode. We present major and trace element analyses of melt inclusions and matrix glasses from a suite of ten samples collected over the course of the Holuhraun eruption. The diversity of trace element ratios such as La/Yb in Holuhraun melt inclusions reveals that the magma evolved via concurrent mixing and crystallization of diverse primary melts in the mid-crust. Using olivine-plagioclase-augite-melt (OPAM) barometry, we calculate that the Holuhraun carrier melt equilibrated at 2.1 ± 0.7 kbar (7.5 ± 2.5 km), which is in agreement with the depths of earthquakes (6 ± 1 km) between Bárðarbunga central volcano and the eruption site in the days preceding eruption onset. Using the same approach, melt inclusions equilibrated at pressures between 0.5 and 8.0 kbar, with the most probable pressure being 3.2 kbar. Diffusion chronometry reveals minimum residence timescales of 1-12 days for melt inclusion-bearing macrocrysts in the Holuhraun carrier melt. By combining timescales of diffusive dehydration of melt inclusions with the calculated pressure of H2O saturation for the Holuhraun magma, we calculate indicative magma ascent rates of 0.12-0.29 m s-1. Our petrological and geochemical data are consistent with lateral magma transport from Bárðarbunga volcano to the eruption site in a shallow- to mid-crustal dyke, as has been suggested on the basis of seismic and geodetic datasets. This result is a significant step forward in reconciling petrological and geophysical interpretations of magma transport during volcano-tectonic episodes, and provides a critical framework for the interpretation of premonitory seismic and geodetic data in volcanically active regions.

Keywords: Crystallization; Holuhraun; Iceland; Melt barometry; Melt inclusions.


Figures

Fig. 1
Fig. 1
a Map of Iceland showing the neovolcanic rift zones. b Map of central Iceland showing central volcanoes and their fissure swarms. The 2014–2015 Holuhraun lava is shaded in red; the orange line shows the margins of older Holuhraun lavas. Black points show epicentres of earthquakes in the dyke extending between Bárðarbunga central volcano and the Holuhraun eruption site (data from Ágústsdóttir et al. 2016). c Propagation of pre-eruptive seismicity between Bárðarbunga and the eruption site, modified after Ágústsdóttir et al. (2016). Dyke propagation phases are shaded in grey, and eruption periods shaded in orange. d Subsidence in the centre of Bárðarbunga caldera and the evolution of the subsidence volume, modified after Gudmundsson et al. (2016). Black circles indicate samples used in this study and their date of eruption
Fig. 2
Fig. 2
Petrographic characteristics of silicate melt inclusions in macrocrysts and microphenocrysts from the 2014–2015 Holuhraun eruption. a Randomly distributed spherical primary melt inclusions (MI) in a clinopyroxene (cpx) macrocryst surrounded by groundmass glass (gm); sample JAS-130914-001. b Vermicular primary melt inclusions in a plagioclase (plg) macrocryst; sample MSR-291014-3. c Primary melt inclusions in a plagioclase macrocryst rim; sample AH-170914. A trail of pseudosecondary melt inclusions is located along a healed fracture in the macrocryst core. d Back-scattered electron image of a primary melt inclusion in an olivine (olv) microphenocryst in sample EI-220115. The circular feature in the melt inclusion is a pit formed during SIMS analysis
Fig. 3
Fig. 3
Major elements of melt inclusions, embayments, and glasses from the 2014–2015 Holuhraun eruption. Melt inclusion compositions have been corrected for post-entrapment crystallization. Small red triangles show glass compositions; large open red triangles show the glass samples in which trace elements were analysed. Black stars show the mean whole-rock composition. Grey-shaded fields show typical Holocene tephra glass compositions from the Bárðarbunga volcanic system; small black circles are Bárðarbunga tephra analyses from Thordarson et al. (1998) and Óladóttir et al. (2011). Error bars are 1σ. Solid and dashed lines show fractional crystallization models calculated for the mean primitive melt inclusion composition, calculated over a range of pressures using the mineral–melt equilibria of Langmuir et al. (1992). The kernel density estimates above panel e show the distribution of measured MgO contents for Holuhraun matrix glasses (red), melt inclusions in samples collected in August 2014, (dark blue), melt inclusions from September–December 2014 (mid blue), and melt inclusions from January 2015 (light blue)
Fig. 4
Fig. 4
a Multi-element diagram for Holuhraun melt inclusions and glasses. Concentrations are normalised to depleted MORB mantle (Workman and Hart 2005) with normalisation values shown along the bottom and 2σ errors shown along the top of the plot. The shaded area shows the range of melt inclusion and glass compositions; individual inclusions are shown by the thin grey lines. Variability in melt inclusion compositions is reported as signal-to-noise ratios (σt/σr) for each element, shown at the top of the plot. Dark green lines show two melt inclusions with moderate depletions in high field strength elements (Zr/Y < 2.1), visible by their negative Zr anomalies. Melt inclusions and glasses from the 2014–2015 eruption have near-identical average compositions to older eruptions at Holuhraun in 1797 and 1862 (data from Hartley and Thordarson 2013). b Sr/Sr* vs. MgO in Holuhraun whole-rock (black star), melt inclusions, embayments, and glasses
Fig. 5
Fig. 5
La/Yb vs. host macrocryst composition for Holuhraun melt inclusions. Error bars are 2σ. In plagioclase-hosted inclusions, variability in La/Yb decreases with decreasing host anorthite content. This is interpreted as evidence of concurrent mixing and crystallization of diverse primary melt compositions supplied to the Holuhraun magmatic system. As crystallization and mixing progress, compositional variability collapses to the mean melt inclusion and glass values, shown by the black and red lines, respectively. Note that the mean whole-rock La/Yb is identical to the mean melt inclusion La/Yb. Similar relationships between melt inclusion La/Yb and host mineral composition are observed in olivine-hosted melt inclusions from Laki (Neave et al. ; Hartley et al. 2014), Skuggafjöll (Neave et al. 2014) and Borgarhraun (Maclennan et al. 2003), and olivine- and plagioclase-hosted melt inclusions from older eruptions at Holuhraun (Hartley and Thordarson 2013). Compositions of plagioclase-hosted melt inclusions from the 10 ka Grímsvötn tephra series (Neave et al. 2015) are shown for comparison
Fig. 6
Fig. 6
Light lithophile element and H2O concentrations of melt inclusions, embayments, and glasses from the 2014–2015 Holuhraun eruption. Melt inclusions have been corrected for post-entrapment crystallization. a Boron behaves as an incompatible trace element in the Holuhraun magma. A subset of inclusions, mostly from sample H14, have higher B contents at a given MgO content than the main population of inclusions. b Lithium appears to behave as an incompatible trace element in most melt inclusions. A sub-population of inclusions have high Li concentrations > 8 ppm. c H2O contents in Holuhraun melt inclusions show no systematic relationship with MgO, and cannot be explained by simple fractional crystallization. A small population of more evolved melt inclusions have either trapped a partially degassed melt or experienced post-entrapment dehydration. Vesicular tephra glasses have experienced syn-eruptive degassing and contain 0.07–0.08 wt% H2O
Fig. 7
Fig. 7
a Li vs. Yb for melt inclusions and glasses from Holuhraun, using the same symbols as Fig. 3. Lines show contours of constant Li/Yb. MORB is typified by Li/Yb ~ 1.7, and the grey-shaded area shows 1.0 < Li/Yb < 2.5 as obtained for olivine-hosted melt inclusions from Kilauea (Edmonds 2015). Most melt inclusions fall within this expected OIB range, with the exception of plagioclase-hosted inclusions with anomalously high Li > 8 ppm and some degassed matrix glasses. b Li/Yb vs. host macrocryst composition, coloured by La/Yb. The variability in Li/Yb decreases with decreasing host plagioclase anorthite content
Fig. 8
Fig. 8
Application of the Yang et al. (1996) OPAM barometer to Holuhraun erupted products. The upper panels show the compositions of erupted products, and the lower panels show the equilibration pressures returned by OPAM barometry. a, d Holuhraun matrix glasses and embayments; b, e raw melt inclusion compositions; c, f melt inclusions compositions corrected for post-entrapment crystallization. In all plots, coloured symbols with show compositions where the returned probability of fit PF is greater than 0.8, and grey symbols show compositions where PF < 0.8. Kernel density estimates to the right of plots df show the relative probability of equilibration pressures for compositions with PF > 0.8. The blue kernel density curves correspond to plagioclase-hosted inclusions collected on different dates; the black curve shows all melt inclusions with PF > 0.8
Fig. 9
Fig. 9
a H2O vs. Ce for melt inclusions and glasses from Holuhraun, using the same symbols as Fig. 3. Lines show contours of constant H2O/Ce. The light grey-shaded area shows the unmodified H2O/Ce = 180 ± 20 determined for Iceland’s Eastern Volcanic Zone (Hartley et al. 2015); the dark grey-shaded area indicates the expected range in H2O/Ce for undegassed MORB glasses, 150 < H2O/Ce < 280 (Michael et al. 1995). b H2O/Ce vs. host macrocryst composition, coloured by La/Yb. The black solid line shows the running average H2O/Ce for plagioclase-hosted melt inclusions (circles) calculated using a boxcar filter with bandwidth of 2 mol% An; dashed grey lines show the standard error of estimate for the filtered data
Fig. 10
Fig. 10
Kernel density estimates of calculated diffusive re-equilibration timescales for plagioclase-hosted melt inclusions. a Diffusive over-hydration of melt inclusions. Calculations assume that melt inclusions with initial primary H2O/Ce = 253 equilibrated with a melt composition identical to the carrier melt at 1170 °C. Timescales were modelled assuming an H2O content of 0.7 wt% for the external carrier melt, predicted using the measured Ce content of the most enriched melt inclusion. b Diffusive dehydration of melt inclusions. Calculations assume that melt inclusions initially in equilibrium with an undegassed carrier melt partially re-equilibrated with a degassed carrier liquid containing 0.08 wt% H2O at 1150 °C. On each plot, the vertical bars show the range of diffusion timescales obtained for olivine-hosted melt inclusions calculated under the same conditions
Fig. 11
Fig. 11
a Comparison of melt inclusion and glass OPAM equilibration depths with the depth of laterally propagating seismicity between Bárðarbunga and the eruption site. The coloured symbols show melt compositions where the returned probability of fit PF to the Yang et al. (1996) OPAM barometer is greater than 0.8, and grey symbols show compositions where PF < 0.8. OPAM equilibration pressures were converted to depths assuming a crustal density of 2.86 × 103 kg m−3. b Schematic illustration showing how the Holuhraun magma may have been assembled and transported. Caldera subsidence at Bárðarbunga is likely related to magma draining from a shallow (2–3 kbar) magma reservoir into a lateral dyke. Three ice cauldrons along the dyke path most probably indicate the sites of small subglacial eruptions (Reynolds et al. 2017). Coloured symbols indicate the possible origins of melt inclusion- and embayment-bearing macrocrysts at the relevant pressures of crystallization. Macrocrysts may have been transported from magma reservoirs beneath Bárðarbunga, or entrained from mush horizons along the dyke path

References

    1. Ágústsdóttir T, Woods J, Greenfield T, Green RG, White RS, Winder T, Brandsdóttir B, Steinthórsson S, Soosalu H. Strike-slip faulting during the 2014 Bárðarbunga–Holuhraun dike intrusion, central Iceland. Geophys Res Lett. 2016;43:1495–1503. doi: 10.1002/2015GL067423. - DOI
    1. Allard P, Burton M, Muré F. Spectroscopic evidence for a lava fountain driven by previously accumulated magmatic gas. Nature. 2005;433:407–410. doi: 10.1038/nature03246. - DOI - PubMed
    1. Baker DR. The fidelity of melt inclusions as records of melt composition. Contrib Mineral Petrol. 2008;156:377–395. doi: 10.1007/s00410-008-0291-3. - DOI
    1. Baker S, Amelung F. Top–down inflation and deflation at the summit of Kilauea Volcano, Hawaii, observed with InSAR. J Geophys Res. 2012;117:B12406.
    1. Bali E, Hartley ME, Halldórsson SA, Guðfinsson GH, Jakobsson S (2018) Petrology and geochemistry of the 2014–2015 Holuhraun eruption, Iceland: Melt inclusion constraints on degassing history and volatile release. Contrib Mineral Petrol. 10.1007/s00410-017-1434-1(this issue) - PMC - PubMed

LinkOut - more resources