. 2019 Jul:64:213-226.
doi: 10.1016/j.trf.2019.05.003.

The effects of simulated acuity and contrast sensitivity impairments on detection of pedestrian hazards in a driving simulator

Affiliations

The effects of simulated acuity and contrast sensitivity impairments on detection of pedestrian hazards in a driving simulator

Garrett Swan et al. Transp Res Part F Traffic Psychol Behav. 2019 Jul.

Abstract

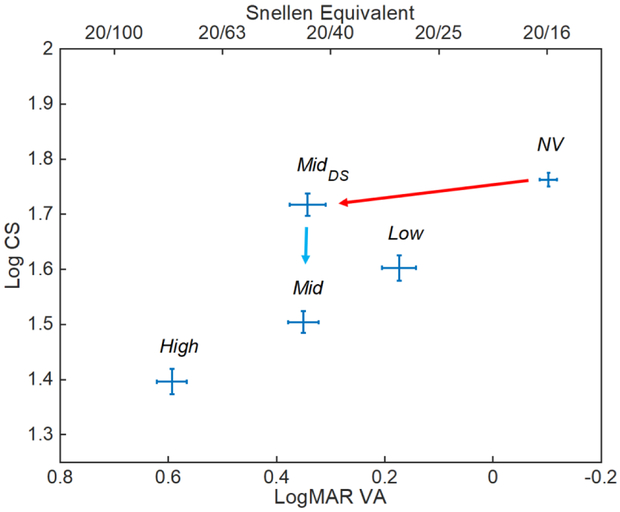
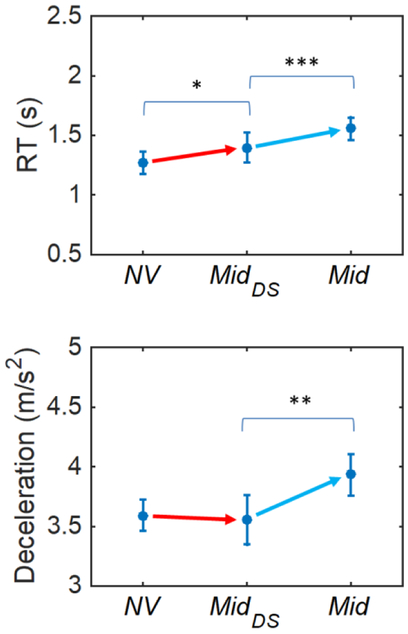
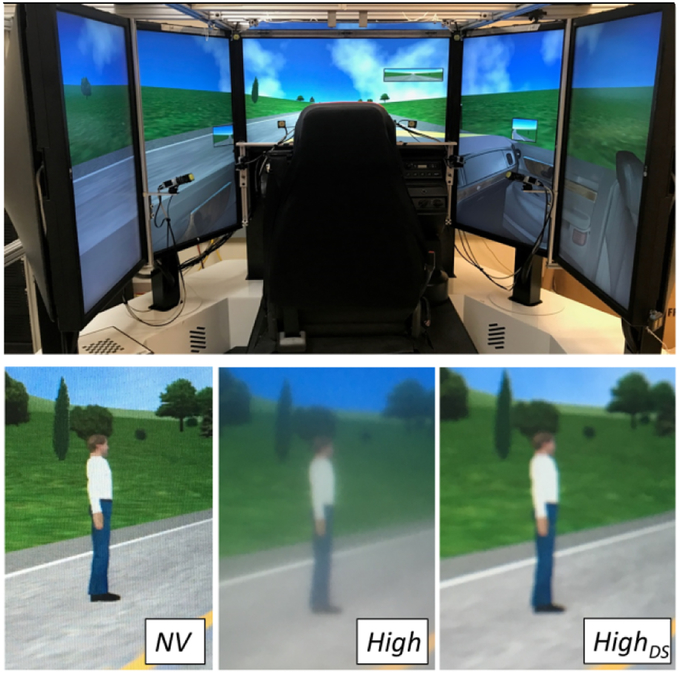
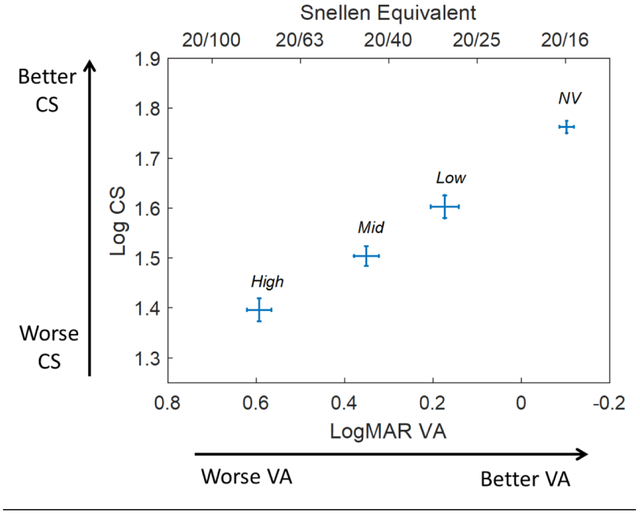
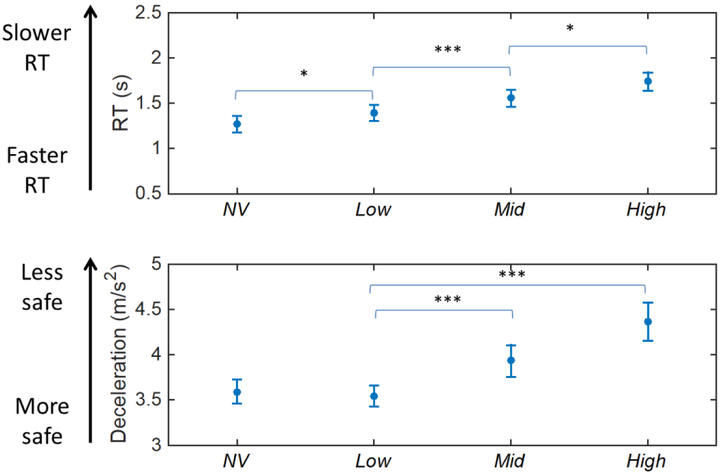
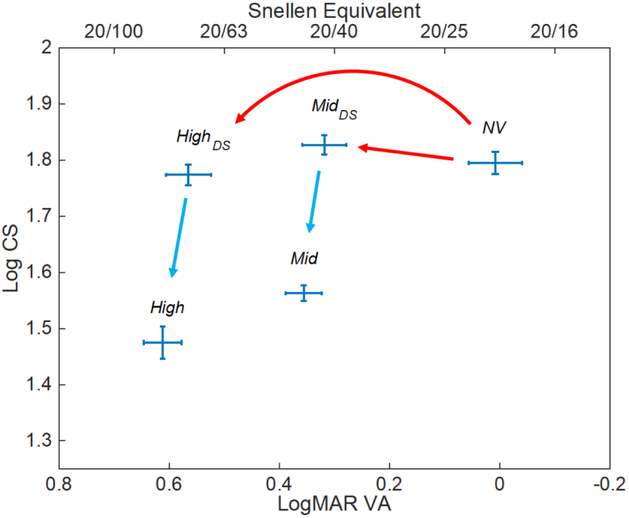
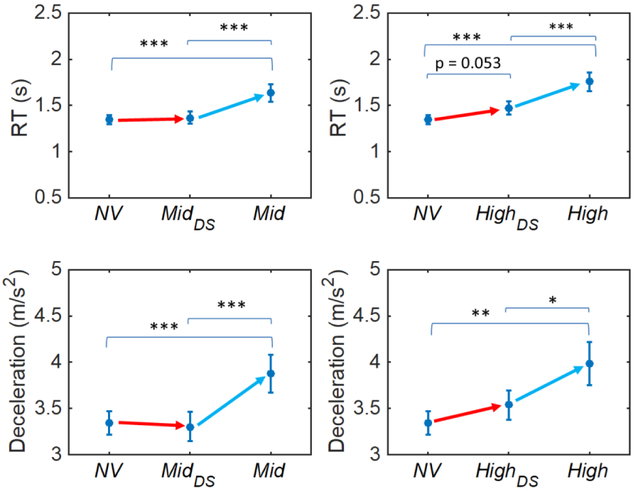
Driving is a highly visual task, yet the vision requirements for driving licensure vary widely. All US states have a threshold for visual acuity (e.g. most use 20/40 for an unrestricted license). Contrast sensitivity (CS) is not measured for licensure, despite evidence that it may be a better predictor of crash risk than visual acuity (VA). Two experiments were conducted to investigate how simulated reductions in VA and CS affect the detection of pedestrians in a driving simulator during the daytime in a highway setting. Young normally-sighted current drivers wore goggles simulating different levels of VA and CS loss (within a range that would meet licensing criteria) and pressed the horn as soon as they saw a pedestrian. The proportion of pedestrians detected and driving speed was not different between the conditions. Reducing VA alone did not significantly reduce reaction time or the deceleration needed to stop before the collision point. However, adding a CS loss to a VA deficit increased both reaction time and the deceleration required to stop before the collision point. These results suggest that an individual's CS should be considered when determining visual fitness to drive, especially in the early stages of ocular disease, such as cataract, where CS may be impaired while high contrast VA is still relatively unimpaired.

Keywords: driving simulation; hazard detection; simulated vision impairment.


Figures

Figure A1.1.
Figure A1.1.
Average contrast sensitive (CS) and visual acuity (VA) for the different conditions (NV, Low, Mid, High, MidDS) in Experiment 1. The red arrow corresponds to the comparison whereby there is only a reduction in VA. The blue arrow corresponds to the comparison whereby there is only a reduction in CS. Error bars are SEM.
Figure A1.2:
Figure A1.2:
Average reaction time (RT: top row) and deceleration (bottom row) across the different conditions in Experiment 1. The red and blue arrows correspond to the comparison whereby there is only a reduction in VA and CS, respectively. Error bars correspond to SEM. * = p < .05, ** = p < .01, *** = p < 0.001
Figure A1.3.
Figure A1.3.
Reaction time (RT: top row) and deceleration (bottom row) are displayed as a function of the order of the drive for Experiment 1.
Figure A1.4.
Figure A1.4.
Reaction time (RT: top row) and deceleration (bottom row) are displayed as a function of the order of the drive for Experiment 2.
Figure 1:
Figure 1:
The driving simulator is displayed in the top row. In the bottom row, the pedestrian is displayed under normal vision (NV), under the dense diffusing filter (High) used in Experiments 1 and 2 that reduced contrast sensitivity and visual acuity, and under the positive diopter sphere lens (HighDS) used in Experiment 2 which reduced visual acuity to the same level as High, but did not significantly affect contrast sensitivity. These images were taken with a camera with the simulated visual impairment goggles placed in front of the lens, thus representing the subjective experience of wearing the simulated visual impairment.
Figure 2.
Figure 2.
Average visual acuity (VA) and contrast sensitivty (CS) values across the different conditions in Experiment 1. Error bars are SEM.
Figure 3:
Figure 3:
Average log10 reaction time (RT: top row) and deceleration (bottom row) for the different conditions in Experiment 1. Error bars are SEM. * = p < .05, *** = p < 0.001
Figure 4:
Figure 4:
Average contrast sensitivity (CS) and visual acuity (VA) for the different conditions (NV, Mid, High, MidDS, HighDS) in Experiment 2. The red arrow corresponds to the comparison whereby there is only a reduction in VA. The blue arrow corresponds to the comparison whereby there is only a reduction in CS. Error bars are SEM.
Figure 5:
Figure 5:
Average reaction time (RT: top row) and deceleration (bottom row) across the different conditions in Experiment 2. The red arrow corresponds to the comparison whereby there is only a reduction in VA. The blue arrow corresponds to the comparison whereby there is only a reduction in CS. Error bars correspond to SEM. * = p < .05, ** = p < .01, *** = p < 0.001

References

    1. Alberti CF, Horowitz T, Bronstad PM, & Bowers AR (2014). Visual attention measures predict pedestrian detection in central field loss: A pilot study. PloS One, 9(2), e89381. - PMC - PubMed
    1. Alberti CF, Peli E, & Bowers AR (2014). Driving with hemianopia: III. Detection of stationary and approaching pedestrians in a simulator. Investigative Ophthalmology & Visual Science, 55(1), 368–374. - PMC - PubMed
    1. Barr DJ (2013). Random effects structure for testing interactions in linear mixed-effects models. Frontiers in Psychology, 4, 328. - PMC - PubMed
    1. Bronstad PM, Albu A, Bowers AR, Goldstein R, & Peli E (2015). Driving with central visual field loss II: how scotomas above or below the preferred retinal locus (PRL) affect hazard detection in a driving simulator. PloS One, 10(9), e0136517. - PMC - PubMed
    1. Bronstad PM, Bowers AR, Albu A, Goldstein R, & Peli E (2013). Driving with central field loss I: effect of central scotomas on responses to hazards. JAMA Ophthalmology, 131(3), 303–309. - PMC - PubMed

LinkOut - more resources