. 2019 Jan 20;6(1):76-83.
doi: 10.1364/optica.6.000076.

Scanless volumetric imaging by selective access multifocal multiphoton microscopy

Affiliations

Scanless volumetric imaging by selective access multifocal multiphoton microscopy

Yi Xue et al. Optica. .

Abstract

Simultaneous, high-resolution imaging across a large number of synaptic and dendritic sites is critical for understanding how neurons receive and integrate signals. Yet, functional imaging that targets a large number of submicrometer-sized synaptic and dendritic locations poses significant technical challenges. We demonstrate a new parallelized approach to address such questions, increasing the signal-to-noise ratio by an order of magnitude compared to previous approaches. This selective access multifocal multiphoton microscopy uses a spatial light modulator to generate multifocal excitation in three dimensions (3D) and a Gaussian-Laguerre phase plate to simultaneously detect fluorescence from these spots throughout the volume. We test the performance of this system by simultaneously recording Ca2+ dynamics from cultured neurons at 98-118 locations distributed throughout a 3D volume. This is the first demonstration of 3D imaging in a "single shot" and permits synchronized monitoring of signal propagation across multiple different dendrites.


Figures
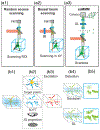
Fig. 1.
Fig. 1.
Outline of experimental flow for saMMM and comparison with other methods. (a) Comparison of similar state-of-the-art methods. (a1) Outline of RAS; (a2) outline of Bessel beam or big Gaussian spot scanning; (a3) outline of saMMM, emphasizing the differences from (a1) and (a2); (b) experimental flow of saMMM; (b1) neuronal structure z stack is first captured using line-scan TF; (b2) manual or automated structural tracing is used to compute the SLM phase mask for targeting the ROI by calculating the 3D phase on an Ewald sphere using the Gerchberg–Saxton algorithm and projecting it onto 2D phase mask. (b3) 3D simultaneous excitation; (b4) 3D simultaneous detection within the DoF; GL phase plate elongates the DoF compared to Gaussian PSF. (b5) Camera captures one image per plane; without GL phase plate, only spots in focus are clearly detected, with out-of-focus locations appearing as blurs (DoF ≈1.8 μm); with GL phase plate, all spots in the slab (DoF ≈15 μm) are detected.
Fig. 2.
Fig. 2.
saMMM setup (with additional line-scan TF multiphoton microscopy) and GL phase plate modulated PSF. (a) System diagram. L1, L2, to collimate beam; HWP, half-wave plate; PBS, polarizing beam splitter; SLM, spatial light modulator; SM, scan mirror; CL, cylindrical lens; DM, dichroic mirror; L4, L5, tube lenses; GL, Gaussian–Laguerre phase plate; L6, L7, relay lenses to generate Fourier plane for GL phase plate; (b) image of a fluorescent nanoparticle (FluoSphere carboxylate, 0.04 μm, yellow-green (505/515), Life Technologies, California) viewed in 3D volume. Scale bar, 5 μm. (c) Double helix PSF modulated by the GL phase plate [measured with a fluorescent nanoparticle, same as (b)], where each small image on the right side shows the cross section at the corresponding white dashed line position on the left 3D PSF. The distance between each dashed line is about 3 μm. Scale bar, 5 μm. The intensity is normalized so that the color scale of each image is [0,1], corresponding to the gray scale. (d) Axial Gaussian PSF of the system is about 1.1 μm. (e) Lateral Gaussian PSF of the system is about 0.43 μm. (f) Total intensity of GL PSF (red) and Gaussian PSF (blue) along z axis. (summing area: 16 × 16 μm in each z position); (g) total intensity ratio between GL PSF and Gaussian PSF along z axis; (h) encoding relation between axial difference and rotation angle (°) of GL PSF.
Fig. 3.
Fig. 3.
Monitoring spontaneous Ca2+ dynamics from 113 foci “at once” on cultured neurons expressing jRGECO1 using 2D saMMM. (a) Superposition of line-scan TF structural image (magenta) with saMMM functional image (green). Scale bar, 50 μm. (b) The ΔF/F traces of every other spot on the three branches shown in (a), sorted by their distances to the soma. The ΔF/F of each dendrite is normalized to the global maximum.
Fig. 4.
Fig. 4.
Monitoring spontaneous Ca2+ dynamics from around one hundred GL spots in 3D simultaneously. (a) Overlay of line-scan TF in focus image with the 3D targeted foci on a single plane. The foci are effectively in different planes of the line-scan TF in focus plane. (a1), (a2) 98 Gaussian and GL spots at ΔZ = 0; (a3), (a4) 118 Gaussian and GL foci at ΔZ = 3 μm; and (a5), (a6) 99 Gaussian and GL foci at ΔZ = 6 μm. Scale bar, 50 μm. (b) Ca2+ activities from representative saMMM targeted foci; figure number corresponding to the figure number in (a). The ΔF/F traces are from foci pointed by the yellow arrows in (a). Blue line is calcium signal from the Gaussian spot, and red line is from the GL spot; (c) SNR comparison of ΔF/F traces between Gaussian foci and GL foci in different axial planes corresponding to (a).

References

    1. Jadi MP, Behabadi BF, Poleg-Polsky A, Schiller J, and Mel BW, “An augmented two-layer model captures nonlinear analog spatial integration effects in pyramidal neuron dendrites,” Proc. IEEE 102, 782–798 (2014). - PMC - PubMed
    1. Stuart GJ and Spruston N, “Dendritic integration: 60 years of progress,” Nat. Neurosci 18, 1713–1721 (2015). - PubMed
    1. Rall W, “Core conductor theory and cable properties of neurons,” in Comprehensive Physiology (Wiley, 2011).
    1. Benavides-Piccione R, Hamzei-Sichani F, Ballesteros-Yáñez I, DeFelipe J, and Yuste R, “Dendritic size of pyramidal neurons differs among mouse cortical regions,” Cereb. Cortex 16, 990–1001 (2006). - PubMed
    1. DeFelipe J and Fariñas I, “The pyramidal neuron of the cerebral cortex: morphological and chemical characteristics of the synaptic inputs,” Prog. Neurobiol 39, 563–607 (1992). - PubMed

LinkOut - more resources