. 2019 Dec;1(12):1243-1257.
doi: 10.1038/s42255-019-0149-1. Epub 2019 Dec 13.

Dysregulation of Amyloid Precursor Protein Impairs Adipose Tissue Mitochondrial Function and Promotes Obesity

Affiliations

Dysregulation of Amyloid Precursor Protein Impairs Adipose Tissue Mitochondrial Function and Promotes Obesity

Yu A An et al. Nat Metab. 2019 Dec.

Abstract

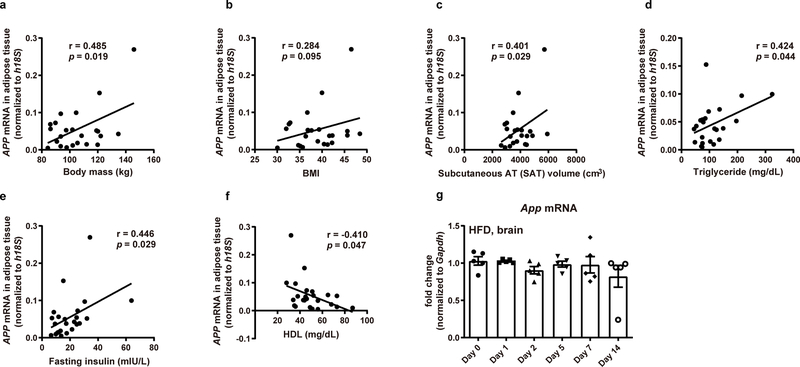
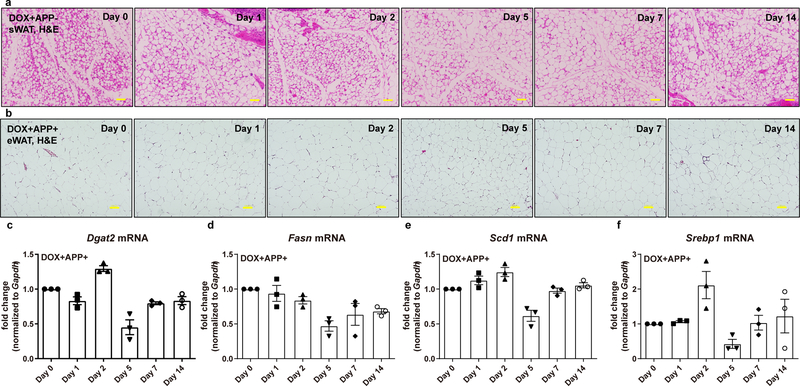
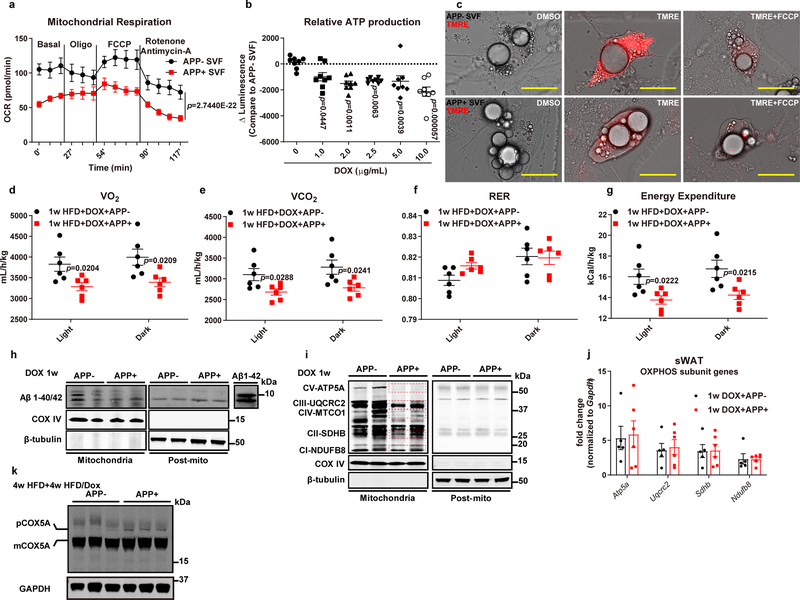
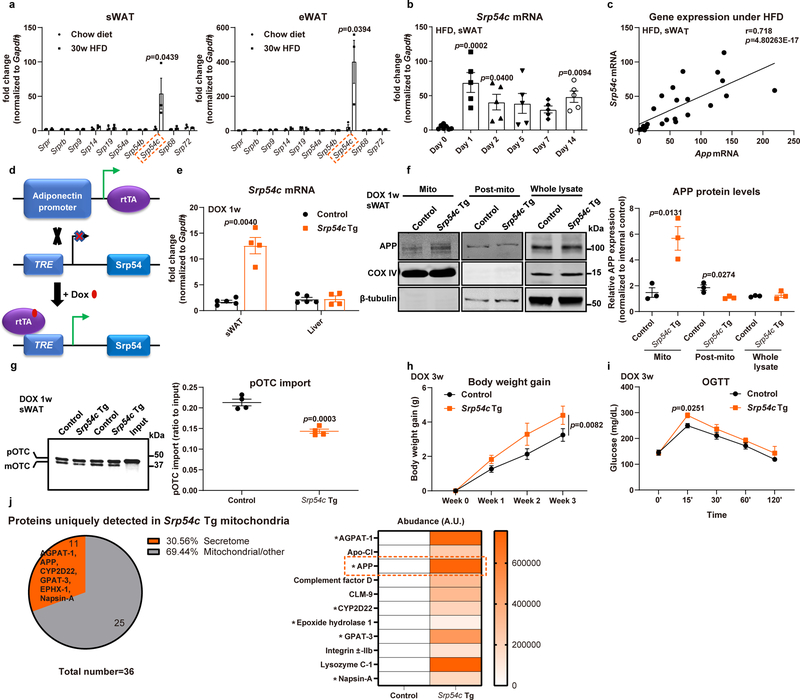
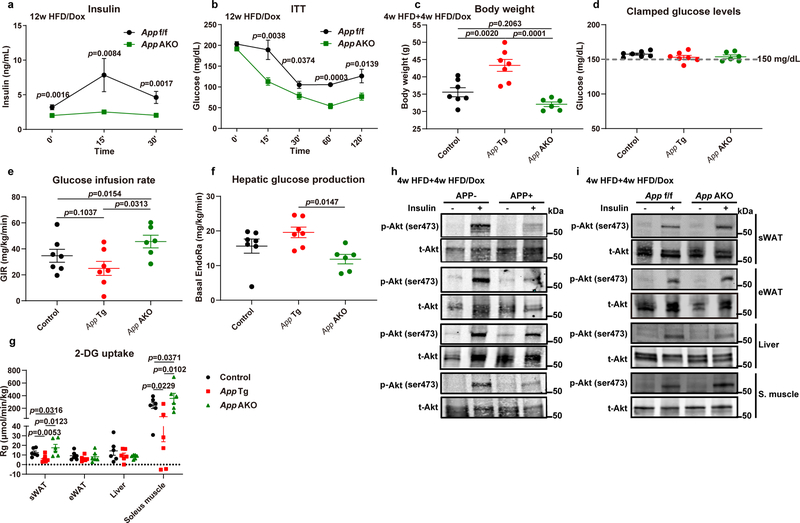
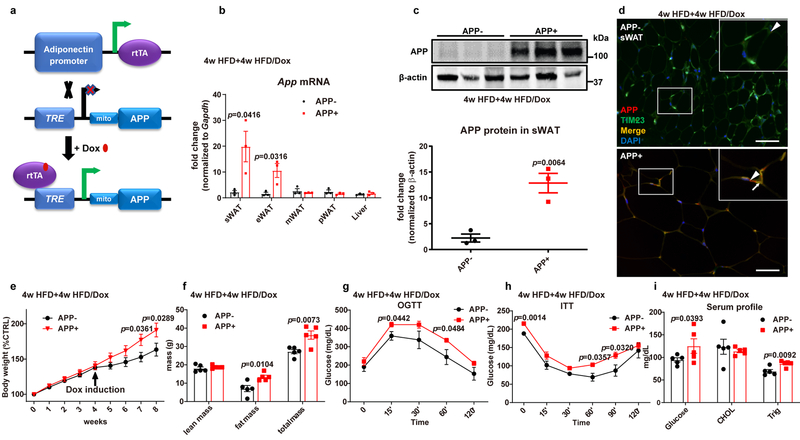
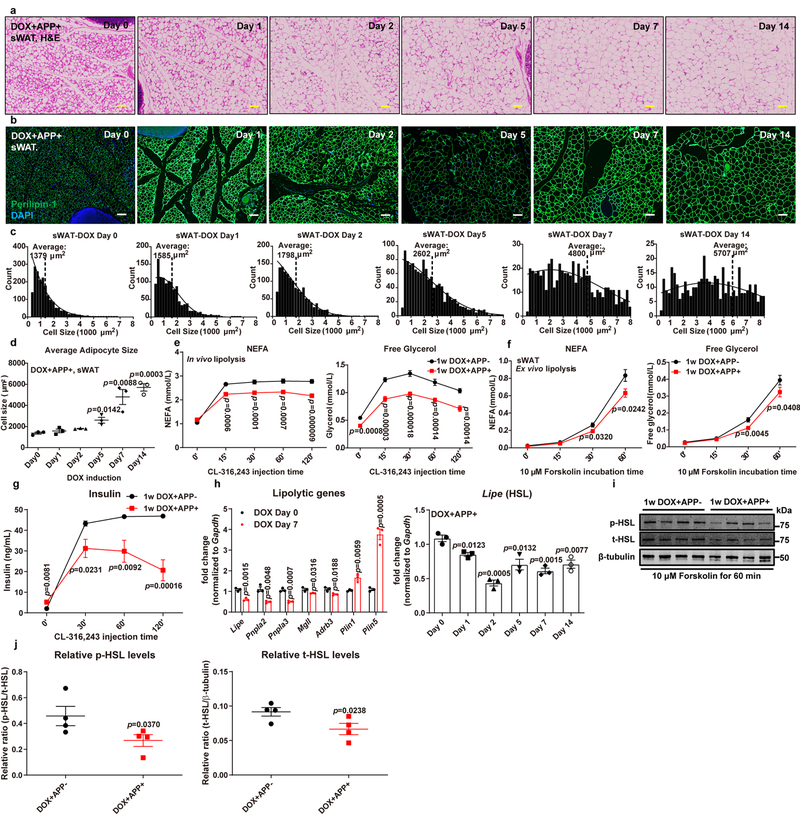
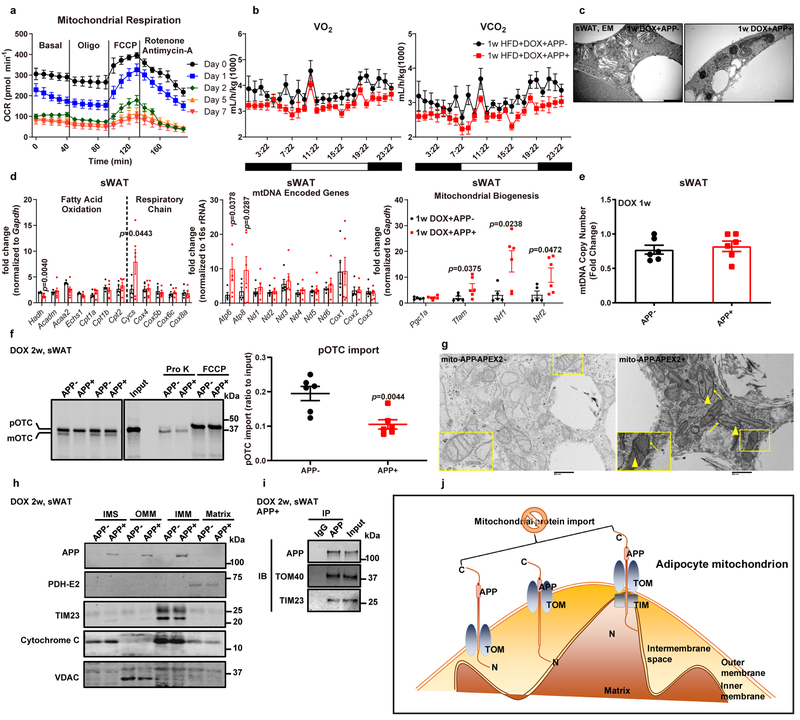
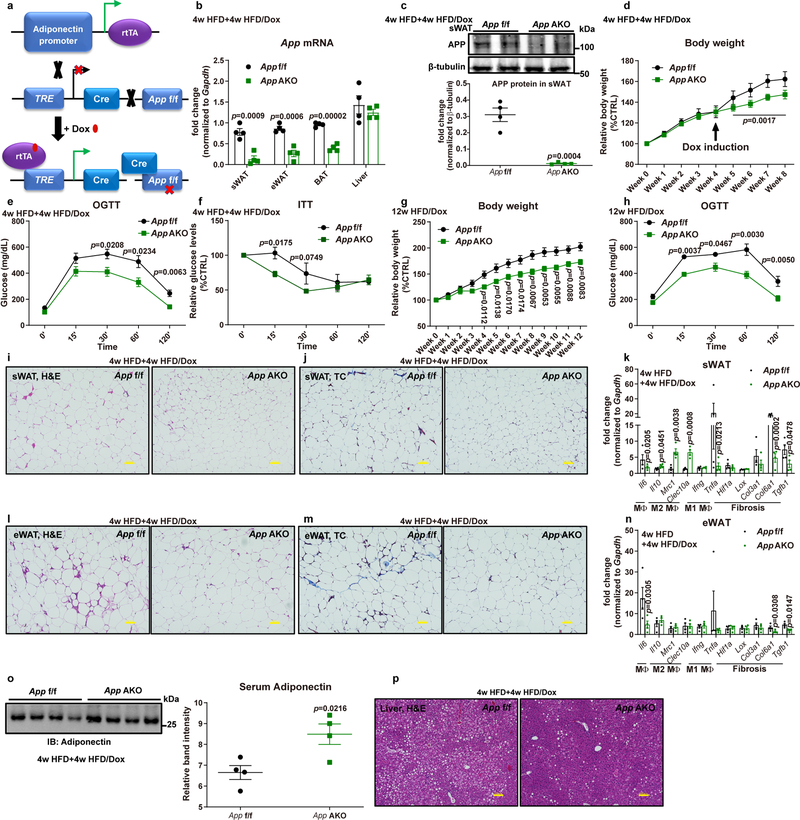
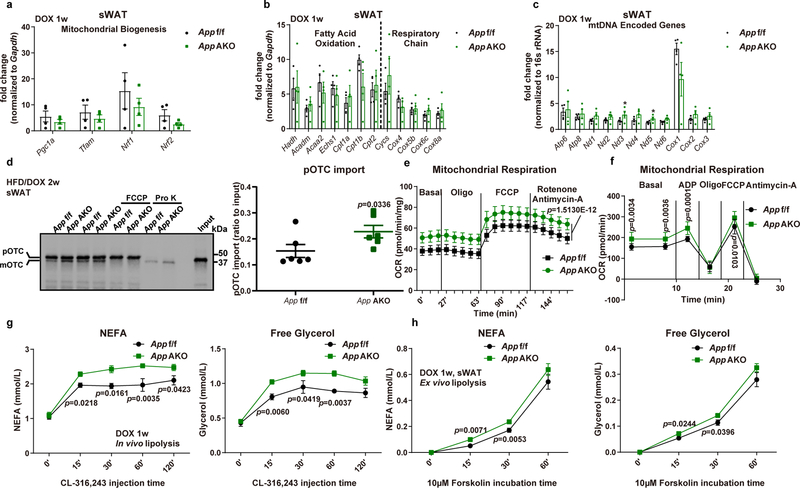
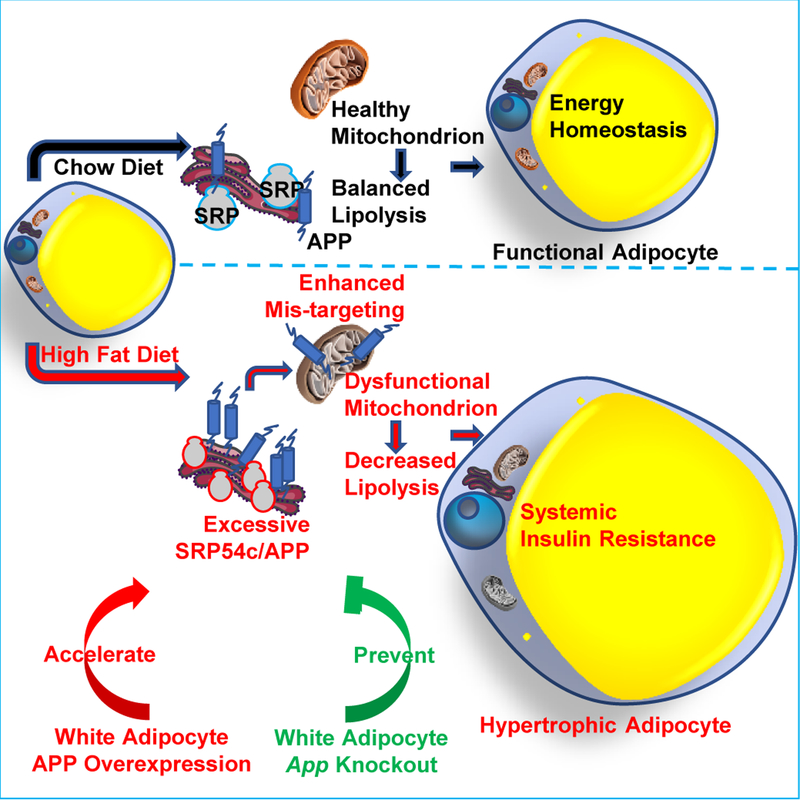
Mitochondrial function in white adipose tissue (WAT) is an important yet understudied aspect in adipocyte biology. Here, we report a role for amyloid precursor protein (APP) in compromising WAT mitochondrial function through a high-fat diet (HFD)-induced, unconventional mis-localization to mitochondria that further promotes obesity. In humans and mice, obese conditions significantly induce APP production in WAT and its enrichment in mitochondria. Mechanistically, a HFD-induced dysregulation of signal recognition particle subunit 54c is responsible for the mis-targeting of APP to adipocyte mitochondria. Mis-localized APP blocks the protein import machinery, leading to mitochondrial dysfunction in WAT. Adipocyte-specific and mitochondria-targeted APP overexpressing mice display increased body mass and reduced insulin sensitivity, along with dysfunctional WAT due to a dramatic hypertrophic program in adipocytes. Elimination of adipocyte APP rescues HFD-impaired mitochondrial function with significant protection from weight gain and systemic metabolic deficiency. Our data highlights an important role of APP in modulating WAT mitochondrial function and obesity-associated metabolic dysfunction.


Conflict of interest statement

Competing interests All the authors declare no competing interests.

Figures

Extended Data Fig. 1
Extended Data Fig. 1. APP is increased in WAT in obesity and adipocyte-specific APP overexpressing mice are more sensitive to diet induced obesity (related to Figs. 1a and 1h).
(a-f) The correlation between APP mRNA levels in sWAT from obese human patients with (a) body mass, (b) BMI, (c) subcutaneous AT volume, (d) triglycerides, (e) fasting insulin and (f) HDL-cholesterol levels. n=23 (a-d) or 24 (e, f) patients. (g) App transcription in the brain in acute HFD challenged wild-type mice for 0, 1, 2, 5, 7 and 14 days. n=7 for Day 0 group; n=5 for Day 1, 2, 5, 7 and 14 groups. Data are shown as mean ± SEM of biologically independent samples. Statistics: Pearson correlation analysis for correlation coefficient (r) and two-tailed p-value (a-f); One-way ANOVA followed by a Tukey post-test, and non-significance was found (g).
Extended Data Fig. 2
Extended Data Fig. 2. Adipocyte-specific APP overexpressing mice are more sensitive to diet induced obesity (related to Figs. 2c, 2d and 2g).
(a) Representative western blotting image for APP protein levels in brain samples from control and APP transgenic mice under HFD/Dox feeding. n=3 mice per group. (b) Western blotting for APP in mitochondrial and post-mitochondrial fractions from sWAT in control and APP overexpressing mice fed with Dox for 1 week. COXIV: mitochondrial marker; β-tubulin: cytoplasmic marker. n=2 mice per group. Representative image is chosen from three independent experiments in a and b. (c) Immunofluorescence staining for APP (red), TIM23 (green) and DAPI (blue) for nuclear labeling in HEK293T cells transfected with empty vector (left) or the mito-APP construct (right). Orange colors indicate the merge between APP and TIM23. Bar = 20 μm. The staining experiments have been replicated three times. (d) Insulin levels measured in serum samples obtained from OGTT experiments. n=8 mice per group. Data are shown as mean ± SEM of biologically independent samples. Two-way ANOVA followed by a Tukey post-test (d).
Extended Data Fig. 3
Extended Data Fig. 3. APP overexpression leads to adipocyte hypotrophy by impairing stimulated lipolysis (related to Figs. 4a and 4e–j).
(a) Representative images for H&E staining in sWAT sections from control mice (APP-) at different time-points of Dox 600mg/kg induction, chosen from two independent experiments, bar = 161 μm. (b) Representative H&E staining images in eWAT sections from APP transgenic mice (APP+) at different time-points of Dox 600mg/kg induction, chosen from two independent experiments, bar = 100 μm. (c-e) Lipogenesis related gene transcriptions in sWAT of APP transgenic mice at different time points of Dox 600mg/kg feeding: (c) Dgat2, (d) Fasn, (e) Scd1 and (f) Srebp1, n=3 mice per time point. Data are shown as mean ± SEM of biologically independent samples. One-way ANOVA followed by a Tukey post-test (c-f) and no statistical significance has been found.
Extended Data Fig. 4
Extended Data Fig. 4. APP impairs adipocyte mitochondrial function due to defective mitochondrial protein import (related to Figs. 5a–b, 5f).
(a) In vitro mitochondrial respiration (OCR) in sWAT SVF differentiated adipocytes from control (APP-) and APP transgenic (APP+) mice. Cells are pre-incubated for 5.0 μg/mL Dox for 48 hours to induce APP overexpression. n=5 per group. (b) Relative in vitro ATP production changes from SVF differentiated adipocytes of APP transgenic mice compared to control mice. Different dosages of Dox have been applied to cells. n=8 per dosage. (c) Combined light and fluorescence microscopy images displaying mitochondrial membrane potential (MMP) through TMRE staining (Red) from SVF differentiated adipocytes of control and APP transgenic mice. DMSO serves as the negative control, and FCCP is a positive control to collapse MMP. Images are chosen from three independent experiments and are representative of at least 12 fields for each group. Bar = 50 μm. (d-g) Quantification for indirect calorimetry measurements in control and APP transgenic mice in light and dark cycles: (d) Oxygen consumption (VO2); (e) carbon dioxide production (VCO2); (f) respiratory exchange ratio (RER) and (g) calculated energy expenditure. n=6 mice per group. (h) Western blotting for Aβ–40/42 in mitochondrial and cytoplasmic fractions from sWAT in control and APP overexpressing mice. Aβ 1–42 protein has been loaded separately as a positive control. n=2 mice per group. Representative image is chosen from three independent experiments. (i) Western blotting for mitochondrial complex components using oxidative phosphorylation antibody cocktail in mitochondrial and cytoplasmic fractions from sWAT in control and APP overexpressing mice. n=2 mice per group. Representative image is chosen from three independent experiments. (j) Gene expressions for mitochondrial complex components measured in (i). n=5 (APP-) or 6 (APP+) mice per group. (k) Western blotting for COX5A in sWAT in control and APP overexpressing mice. n=3 mice per group. Representative image is chosen from three independent experiment. For all statistics: data are shown as mean ± SEM of biologically independent samples. Two-way ANOVA (a); One-way ANOVA followed by a Tukey post-test (b); Two-tailed Student’s t-test (d-g, j).
Extended Data Fig. 5
Extended Data Fig. 5. Dysregulation of SRP54c is responsible for mistargeting of APP into adipocyte mitochondria (related to Fig. 5).
(a-b) SRP subunit gene mRNA levels in anchoring adipocytes in 30-week HFD and chow fed mice (a, left: sWAT; right: eWAT, n=3 mice per group) and Srp54c mRNA levels from sWAT in acute HFD challenged wild-type mice for 0, 1, 2, 5, 7 and 14 days (b), n=7 mice in Day 0 group and n=5 mice in Day 1, 2, 5, 7 and 14 groups. (c) The correlation between Srp54c mRNA levels in sWAT from HFD challenged wildtype mice with App mRNA expression, n=32. (d) Schematic illustration of the adipocyte-specific, Dox-inducible SRP54c transgenic mouse model. (e) Validation of SRP54c overexpression in WAT of transgenic mice fed with 1-week Dox 600mg/kg diet by detecting Srp54c mRNA levels in different tissues from control (Control) and SRP54c overexpressing (Srp54c Tg) mice (n=4 mice per group). (f) Representative Western blotting image (left panel) for APP in purified mitochondrial, post-mito, and whole tissue lysate from sWAT in 1-week Dox fed mice and its quantification (right panel). n=3 mice per group. Images are chosen from three independent experiments. (g) Representative autoradiography image (left panel) and statistics (right panel) of pOTC import assessed in isolated mitochondria (incubation for 30 minutes) from sWAT of 1-week Dox fed control or Srp54c Tg mice. 25% of [35S]pOTC added to each reaction is loaded as input. n=4 mice per group. (h-i) Upon 3-week Dox feeding, both control and Srp54c Tg mice are subject to metabolic analysis, including (h) body weight monitoring and (i) OGTT assays. n=4 mice per group. (j) Proteomics analysis performed in purified mitochondria from WAT of control and Srp54c Tg mice: left, percentage of secretome proteins among uniquely detected proteins in Srp54c Tg mitochondria; right, heat map depicting enrichment of identified proteins belonging to secretome (* indicates a polypeptide containing a well-defined ER signaling sequence). For all statistical graphs, numeric data are presented as mean ± SEM of biologically independent samples. Two-tailed Student’s t-test (a, e-g); One-way ANOVA followed by a Tukey post-test (b); Pearson correlation analysis for correlation coefficient (r) and two-tailed p-value (c); Two-way ANOVA followed by a Tukey post-test (h-i).
Extended Data Fig. 6
Extended Data Fig. 6. Halting APP overexpression reverses the obese phenotypes (related to Fig. 6).
(a-d) APP overexpressing mice (APP+) are fed with HFD/Dox diets for 8 weeks, followed by dividing into two groups, one group continuously on HFD/Dox feeding (Keep Dox) and the other group fed with HFD without Dox (Withdraw Dox). Two groups of mice are subject to the following metabolic analyses (n=6 mice per group): (a) Body weight for 12 weeks; (b) Ex vivo mitochondrial respiration (OCR) in sWAT fat pads from both groups, n=10 tissues per group; Glucose levels at different time-points from (c) OGTT and (d) ITT experiments. (e-f, h) Control mice (APP-) are fed with HFD/Dox diets for 8 weeks, followed by dividing the cohorts into two groups, one group continuously on HFD/Dox feeding (“Keep Dox”) and the other group fed with HFD without Dox (“Withdraw Dox”). Two groups of mice were subjected to the following metabolic analyses: (e, n=6 mice per group) Body weights for the 12 week exposure; (f, n=10 tissues per group) Ex vivo mitochondrial respiration (OCR) in sWAT fat pads from both groups; Glucose levels at different time-points from (h, n=6 mice per group) OGTT experiments. (g) Combined high-resolution respirometry measured in isolated mitochondria from four groups including control or APP transgenic mice kept with or without Dox feeding, n=5 mice per group. (i-j) AT inflammatory and liver steatosis phenotypes in control or APP transgenic mice kept with or without Dox feeding: (i) Representative H&E staining images for sWAT; (j) Representative H&E staining images of liver tissues from four groups. Images are chosen from three independent experiments. For all the statistics: data are presented as mean ± SEM of biologically independent samples. Two-way ANOVA followed by a Tukey post-test (a-h), and no statistical significance was found in e, f, and h.
Extended Data Fig. 7
Extended Data Fig. 7. App AKO protects mice from obesity with enhanced adipocyte mitochondrial function (related to Figs. 6e–h).
(a-b) In 12-week HFD/Dox feeding control or App AKO mice, (a) insulin levels measured in serum samples obtained from OGTT experiments and (b) glucose levels at difference time-points during ITT assays. n=8 mice per group. (c-g) For insulin sensitivity measurement, three groups of mice including control, APP adipocyte-specific transgenic (App Tg) and App adipocyte-specific knockout (App AKO) mice are subject to hyperinsulinemic-euglycemic clamp studies: (c) Body weight, (d) Clamped glucose levels, (e) Glucose infusion rate, (f) Basal hepatic glucose production, and (g) 2-DG uptake in different metabolic tissues are shown. For c-f, n=7 mice in control and App Tg groups, n=6 mice in App AKO group. For g, n=6 mice per group. (h-i) Representative immunoblot image of phosphorylated Akt (p-Akt, Ser 473) and total Akt expression in different metabolic tissues from (h) both control and APP overexpressing mice or (i) both control and App AKO mice after saline or insulin injection (i.v.) for 5 min. For the Western blot image, n=3 mice per group, and the representative images are chosen from three independent experiments. For all statistics: data are shown as mean ± SEM of biologically independent samples. Two-way ANOVA followed by a Tukey post-test (a-b); One-way ANOVA followed by a Tukey post-test (c-g).
Fig. 1.
Fig. 1.. APP is increased in WAT in obese human and mice and accumulates in adipocyte mitochondria.
(a) Relationship between sWAT APP mRNA levels and insulin sensitivity, assessed as the glucose infusion rate divided by plasma insulin concentration (M/I) during a hyperinsulinemic-euglycemic clamp procedure in people with obesity (n=23). FFM: fat free mass. (b-d) APP expression extracted from human genomic databases: APP levels in sWAT from lean and obese co-twins (b, Accession #: E-MEXP-1425, n=11 subjects per group), from lean and obese female (F) or male (M) Pima Indians (c, Accession #: GSE2508, n=10 (lean F, obese F and lean M) or 9 (obese M) subjects per group), and from human subjects with a range of subcutaneous adipocyte sizes (d, Accession #: GSE27951, n=12 (115μm), 9 (121μm) or 11 (125μm) subjects per group. Center line, median; box limits, upper and lower quartiles; whiskers, 1.5x interquartile range). (e-h) App mRNA levels in different tissues from Ob/Ob and wild-type mice (e, n=5), in 30-week HFD and chow fed mice (f, n=5), in adipocytes (n=5) and stromal vascular fractions (SVF, n=6) from sWAT (left) and eWAT (right) in 30-week HFD and chow fed mice (g) and App mRNA levels from sWAT (left) and eWAT (right) in acute HFD challenged wild-type mice for 0, 1, 2, 5, 7 and 14 days (h, n=7 mice for Day 0 group; n=5 mice for Day 1, 2, 5, 7 and 14 groups). (i) Representative Western blotting image (left panel) for APP in mitochondrial (Mito), post-mitochondria (Post-mito, including cytosol and microsomal (ER) compartments) fractions, and whole tissue lysate from sWAT in 30-week HFD and chow fed mice and its quantification (right panel). COXIV: mitochondrial marker; β-Tubulin: cytoplasmic marker; Calreticulin: ER marker. n=3 mice per group. Images are chosen from three independent experiments. Data are presented as mean ± SEM of biologically independent samples. Pearson correlation analysis for correlation coefficient (r) and two-tailed p-value (a); Two-tailed Student’s t-test (b-c, e-g, i); One-way ANOVA test followed by a Tukey post-test (d, h). See also Extended Data Fig. 1.
Fig. 2.
Fig. 2.. Adipocyte-specific APP overexpressing mice are more sensitive to diet induced obesity.
(a) Schematic illustration of the adipocyte-specific, Dox-inducible APP transgenic mouse model. A mitochondrial (mito) pre-sequence is connected to APP695 cDNA to target overexpressed APP into adipocyte mitochondria. (b-d) Validation of APP overexpression in WAT of transgenic mice fed with 4-week HFD plus 4-week HFD/Dox 600mg/kg: (b) App mRNA levels in different tissues from control (APP-) and APP overexpressing (APP+) mice (n=4 mice per group); (c) Representative Western blotting image (upper panel) for APP protein levels in sWAT and its quantification (lower panel) (n=3 mice per group); (d) Immunofluorescence staining for APP (red) and TIM23 (green) in sWAT, DAPI (blue) for nuclear labeling, bar = 60 μm. Triangles indicate over-expressed APP signals, and arrows indicate the merge between APP and TIM23 signals. Representative images in c and d are chosen from three independent experiments. (e-i) Both control and APP transgenic mice are subject to the following metabolic analyses: (e) Relative body weight for 8 weeks; (f) Body composition data obtained via NMR system; Glucose levels at different time-points from (g) OGTT and (h) ITT experiments; (i) Fasting glucose, cholesterol and triglyceride levels in serum samples from both groups. n=8 mice (e, g, h) or n=5 mice (f, i) per group. For all the statistics: data are presented as mean ± SEM of biologically independent samples. Two-tailed Student’s t-test (b-c, f, i); Two-way ANOVA followed by a Tukey post-test (e, g-h). See also Extended Data Fig. 2.
Fig. 3.
Fig. 3.. APP overexpression causes dysfunctional WAT and liver steatosis.
(a-b) Representative H&E staining images from three independent cohorts of sWAT (a) and eWAT (b) sections from 4-week HFD plus 4-week HFD/Dox 600mg/kg fed control and APP overexpressing mice. Bar = 60 μm. (c-d) Inflammatory and fibrosis related gene mRNA levels assessed by qPCR in sWAT (c) and eWAT (d) of control and APP transgenic mice. General inflammatory (MΦ, macrophages) markers: Adgre1 (F4/80), Il6 (IL-6); anti-inflammatory macrophage (M2 MΦ, M2 macrophages) markers: Mrc1 (CD206), Il10 (IL-10), Clec10a (CD301); pro-inflammatory macrophage (M1 MΦ, M1 macrophages) markers: Ifng, Tnfa, Nos2; fibrotic markers: Hif1a, Lox, Col1a1, Col3a1, Col6a1 and Tgfb1. n=5 mice per group. (e) Circulating adiponectin immunoblot image (upper panel) and quantification (lower panel) in control and APP transgenic mice. n=3 mice per group. Image is chosen from three independent experiments. (f) Representative H&E staining images of liver tissues from both groups, chosen from three independent staining experiments. Bar = 161 μm. (g) Cholesterol and triglyceride levels in liver samples from both groups. n=5 mice per group. For all the statistics: data are presented as mean ± SEM of biologically independent samples. Two-tailed Student’s t-test (c-e, g).
Fig. 4.
Fig. 4.. APP overexpression leads to adipocyte hypotrophy by impairing stimulated lipolysis.
(a-d) Rapid enlargement of subcutaneous adipocytes in APP transgenic mice under acute Dox 600mg/kg induction for 0, 1, 2, 5, 7 and 14 days: Representative images for H&E staining (a) and perilipin-1 (Green) immunofluorescence staining (b) in sWAT sections from different time-points, chosen from two independent experiments. Bar = 161 μm; (c) Cell count distribution according to adipocyte cell size at different time-points, replicated in two independent cohorts; (d) Average adipocyte size in sWAT at different time-points. n=3 mice per time point. (e-g) Both control and APP transgenic mice induced by 1-week Dox 600mg/kg feeding are subject to in vivo and ex vivo lipolysis analysis: (e) Serum NEFA (left), free glycerol (right) and (g) insulin levels at different time-points in both groups after β3-adrenoceptor agonist CL-316,243 (1 mg/kg) injection, n=8 mice per group; (f) NEFA (left) and free glycerol (right) levels in the mediums obtained from ex vivo cultured sWAT fat pads at different time points of 10 μM forskolin incubation, n=12 tissues per group. (h) Lipolytic gene expressions in 7-day Dox 600mg/kg fed control and APP overexpressing mice (left panel, n=3 mice per group) and a time-course change for Lipe (gene name for HSL) transcriptions in sWAT of APP transgenic mice after Dox induction (right panel, n=3 mice per time point). (i-j) (i) Representative immunoblot analysis of phosphorylated HSL (p-HSL) and total HSL (t-HSL) levels in the sWAT fat pads from both groups after ex vivo lipolysis assays, and images are chosen from three independent experiments; (j) Quantification for relative p-HSL and t-HSL expression, n=4 tissues per group. For all statistics: data are shown as mean ± SEM of biologically independent samples. One-way ANOVA followed by a Tukey post-test (d, right panel in h); Two-way ANOVA followed by a Tukey post-test (e-g); Two-tailed Student’s t-test (left panel in h, j). See also Extended Data Fig. 3.
Fig. 5.
Fig. 5.. APP impairs adipocyte mitochondrial function due to defective mitochondrial protein import.
(a) Ex vivo mitochondrial respiration in sWAT fat pads from APP transgenic mice fed with different periods of Dox 600 mg/kg diet. Oxygen consumption rate (OCR) at basal level and post Oligomycin (Oligo), FCCP and Rotenone/Antimycin-A injection is shown. n=5 tissues each time point. (b) Oxygen consumption (VO2, left) and carbon dioxide production (VCO2, right) measured from indirect calorimetry of control and APP overexpressing mice under 1-week HFD/Dox challenge. n=6 mice per group. Representative images for one dark-night cycle are shown. (c) EM images for sWAT sections from both groups under 1-week Dox 600mg/kg induction. Bar = 1,000 nm. Images are chosen from two independent biological samples. (d-e) Mitochondrial function related gene expressions (d) and mtDNA copy number (e) in 1-week Dox fed control and APP transgenic mice. For mtDNA copy number, fold change is normalized to the control with the highest copy number value. n=5 mice in APP- group and 6 mice in APP+ group. (f) Representative autoradiography image (left) and statistics (right) of pOTC import assessed in isolated mitochondria (incubation for 30 minutes) from sWAT of 2-week Dox fed control or APP transgenic mice. 25% of [35S]pOTC added to each reaction is loaded as input. 0.4 mg/mL protease K (Pro K) is added to digest unimported pOTC proteins. 40 μmol/L FCCP inhibits pOTC import via depolarizing the mitochondria (negative control). n=6 mice per group. Images are chosen from three independent experiments. (g) EM images for differentiated adipocytes from SVF isolated from control (left) or APP-APEX2 transgenic mice (right). Arrows: staining associated with the mitochondrial outer membrane; arrowheads: dark contrast in the cristae. Bar = 0.5 μm. Images are chosen from two independent biological samples. (h) Representative Western blotting image for APP in mitochondrial sub-localization of purified mitochondria from sWAT in control and APP transgenic mice. PDH-E2: mitochondrial matrix; TIM23: inner mitochondrial membrane (IMM); Cytochrome C: intermembrane space (IMS); VDAC: outer mitochondrial membrane (OMM). (i) Representative Western blotting image of co-immunoprecipitation (IP) analysis using either IgG or anti-APP antibody incubated with isolated mitochondria from APP transgenic mice fed with 2-week Dox diet. The input (20% of lysate) and IP samples are subject to immunoblot (IB) with APP, TOM40, and TIM23 primary antibodies. Images are chosen from three independent experiments in h and i. (j) The proposed “clogging” model. For all statistics: data are shown as mean ± SEM of biologically independent samples. Two-tailed Student’s t-test (d-f). See also Extended Data Fig. 4–5.
Fig. 6.
Fig. 6.. App AKO protects mice from obesity.
(a) Schematic illustration of the adipocyte-specific, Dox-inducible App knockout mouse model. (b-c) Validation of App deletion in adipocyte-specific App knock-out mice (App AKO) compared to control mice (App f/f) fed with 4-week HFD plus 4-week HFD/Dox 600mg/kg: (b) App mRNA levels in different tissues from App f/f and App AKO mice (n=4 mice per group); (c) Representative western blotting image (upper panel) for APP protein levels in sWAT and its quantification (lower panel, n=4 mice per group.). Images are representative of three independent experiments. (d-h) Both App f/f and App AKO mice are subject to the following metabolic analyses: (d) Relative body weight for 8 weeks (n=8 mice per group); Glucose levels at different time-points from (e) OGTT and (f) ITT experiments (n=8 mice per group); (g) Relative body weights for 12 weeks of HFD/Dox feeding; (h) Glucose levels at different time-points of OGTT assays (n=8 mice per group in g and h). (i-n) Inflammatory and fibrotic phenotypes in sWAT and eWAT from App f/f and App AKO mice: Representative H&E staining images for (i) sWAT and (l) eWAT; Representative trichrome (TC) staining images for (j) sWAT and (m) eWAT; Inflammation and fibrosis related gene expressions in (k) sWAT and (n) eWAT of mice from both groups (images are chosen from four independent experiments). Bar = 100 μm. (o) Circulating adiponectin immunoblot (left panel) and quantification (right panel) in both groups. n=4 mice per group. (p) Representative H&E staining pictures of liver tissues from both groups (images are chosen from four independent experiments). Bar = 100 μm. For all statistics: data are shown as mean ± SEM of biologically independent samples. Two-tailed Student’s t-test (b-c, k, n-o); Two-way ANOVA followed by a Tukey post-test (d-h). See also Extended Data Fig. 6 and 7.
Fig. 7.
Fig. 7.. App AKO enhances adipocyte mitochondrial function.
(a-c) (a) Mitochondrial biogenesis related gene expressions, (b) genes involved in fatty acid oxidation and respiratory chain component genes, and (c) mtDNA encoded gene transcription in App f/f and App AKO mice after 1-week Dox induction are shown, n=4 mice per group. (d) Representative autoradiography image (left) and statistics (right) of pOTC import assessed in isolated mitochondria (incubation for 30 minutes) from sWAT of 2-week HFD/Dox fed control or App AKO mice. 25% of [35S]pOTC added to each reaction is loaded as input. Pro K: 0.4 mg/mL; FCCP: 40 μmol/L. n=6 mice per group. Image is chosen from three independent experiments (e-f) (e) Ex vivo mitochondrial respiration in sWAT fat pads and (f) respiration measurements in isolated mitochondria from App f/f and App AKO mice fed with Dox containing diet for 1 week, n=10 per group. (g-h) Both control and App AKO mice induced by 1-week Dox 600mg/kg feeding are subject to in vivo and ex vivo lipolysis analysis: (g) Serum NEFA (left), free glycerol (right) at different time-points in both groups after β3-adrenoceptor agonist CL-316,243 (1 mg/kg) injection, n=6 mice per group; (h) NEFA (left) and free glycerol (right) levels in the mediums obtained from ex vivo cultured sWAT fat pads at different time points of 10 μM forskolin incubation, n=12 tissues per group. For all statistics: data are shown as mean ± SEM of biologically independent samples. Two-tailed Student’s t-test (a-d); Two-way ANOVA followed by a Tukey post-test (e-h).
Fig. 8.
Fig. 8.. A modulating role of APP in adipocyte mitochondrial function, lipolysis and hypertrophy in the context of obesity.
HFD challenge induces white adipocyte APP overexpression and subsequent mis-targeting into mitochondria, leading to impaired mitochondrial functions. The mitochondrial dysfunction further decreases catecholamine-induced lipolysis, resulting in rapid hypertrophy in adipocytes, followed by a significant obese phenotype and systemic insulin resistance. Adipocyte-specific overexpression of APP recapitulates and further accelerates the AT dysfunction and obese problems, while the specific elimination of App in white adipocytes prevents mice from diet induced metabolic deficiency.

References

    1. Hruby A, Hu FB. The Epidemiology of Obesity: A Big Picture. Pharmacoeconomics 33, 673–689 (2015). - PMC - PubMed
    1. Kusminski CM, Bickel PE, Scherer PE. Targeting adipose tissue in the treatment of obesity-associated diabetes. Nat Rev Drug Discov 15, 639–660 (2016). - PubMed
    1. Choe SS, Huh JY, Hwang IJ, Kim JI, Kim JB. Adipose Tissue Remodeling: Its Role in Energy Metabolism and Metabolic Disorders. Front Endocrinol (Lausanne) 7, 30 (2016). - PMC - PubMed
    1. Wang QA, Tao C, Gupta RK, Scherer PE. Tracking adipogenesis during white adipose tissue development, expansion and regeneration. Nat Med 19, 1338–1344 (2013). - PMC - PubMed
    1. Tandon P, Wafer R, Minchin JEN. Adipose morphology and metabolic disease. J Exp Biol 221, jeb164970 (2018). - PubMed

Publication types

MeSH terms