. 2020 Mar;45(3):836-846.
doi: 10.3892/ijmm.2020.4467. Epub 2020 Jan 15.

CircCTDP1 promotes nasopharyngeal carcinoma progression via a microRNA‑320b/HOXA10/TGFβ2 pathway

Affiliations

CircCTDP1 promotes nasopharyngeal carcinoma progression via a microRNA‑320b/HOXA10/TGFβ2 pathway

Haifeng Li et al. Int J Mol Med. 2020 Mar.

Abstract

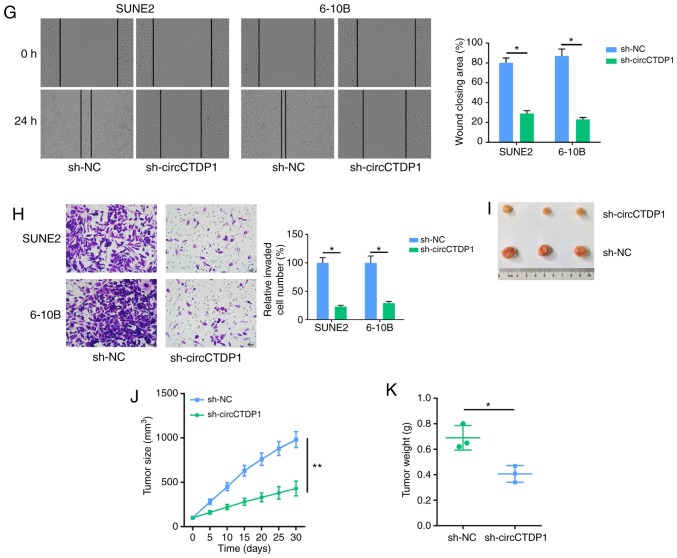
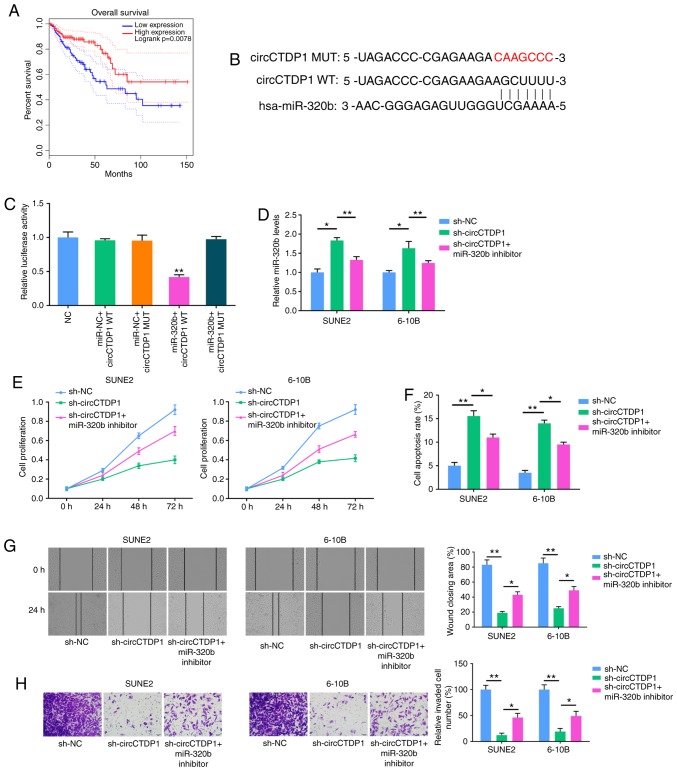
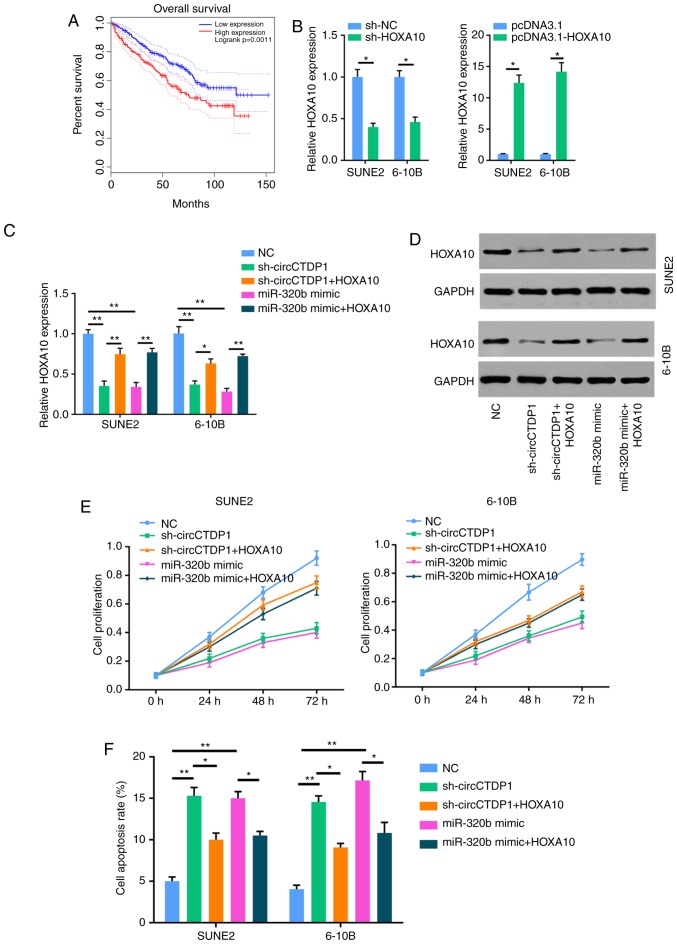
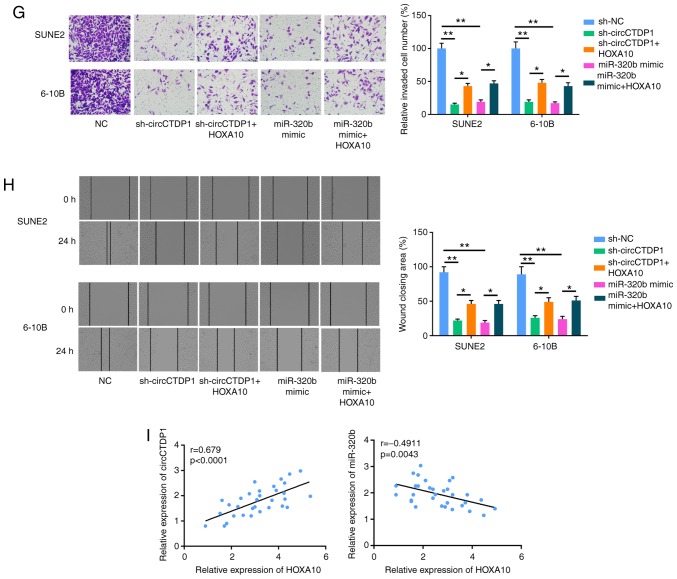
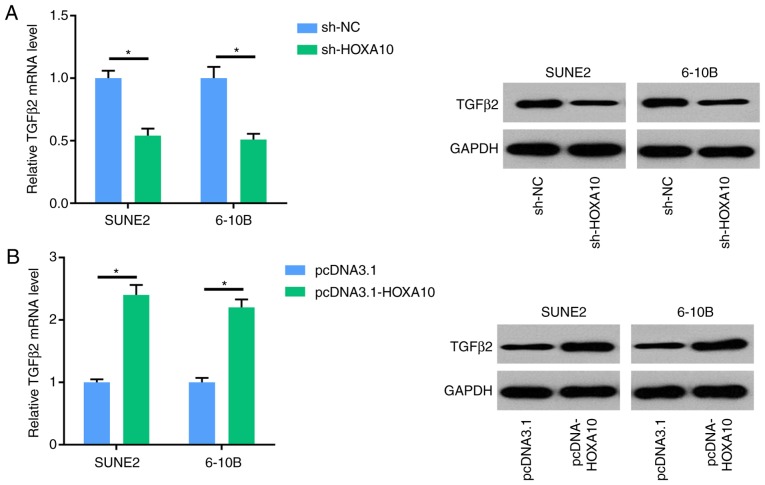
Circular RNAs have been reported to play a vital role in the development and progression of various types of cancer. However, the underlying molecular role of circular RNA CTDP1 (circCTDP1) in the tumorigenesis of nasopharyngeal carcinoma (NPC) remains unknown. In the present study, circCTDP1 expression was found to be markedly upregulated in NPC tissues and cell lines (SUNE1, SUNE2 and 6‑10B cell lines). Knockdown of circCTDP1 resulted in inhibition of proliferation, migration and invasion, and promoted apoptosis of NPC cells. Moreover, circCTDP1 directly interacted with microRNA (miR)‑320b based on bioinformatics prediction and dual luciferase assay, and transfection with an miR‑320b inhibitor reversed the effects of circCTDP1 knockdown on NPC cells. Furthermore, circCTDP1/miR‑320b promoted NPC progression by regulating the expression of homeobox A10 (HOXA10). In addition, it was demonstrated that HOXA10 may exert its oncogenic role in NPC by regulating the expression of transforming growth factor β2 (TGFβ2). Taken together, these results revealed a novel regulatory mechanism, which may provide an improved understanding of NPC tumorigenesis and be useful in the development of potential targets for NPC therapy.


Figures

Figure 1
Figure 1
Knockdown of circCTDP1 inhibits the progression of NPC cells. (A) RT-qPCR analysis shows the relative circCTDP1 expression in NPC tissues and para-carcinoma tissues, n=32. (B) RT-qPCR analysis shows relative circCTDP1 expression in normal nasopharyngeal epithelial cell line (NP69) and NPC cell lines (SUN1, SUNE2 and 6-10B). (C) Kaplan-Meier survival analysis shows correlation between circCTDP1 expression and prognosis of NPC patients. (D) RT-qPCR analysis shows the relative circCTDP1 expression of SUNE2 and 6-10B cell lines transfected with shNC and shcircCTDP1. (E) MTT assay shows the cell growth rate of SUNE2 and 6-10B cell lines transfected with shNC and shcircCTDP1 at different time points of 0, 24, 48, and 72 h. (F) Flow cytometry assay shows the cell apoptosis of SUNE2 and 6-10B cell lines transfected with shNC and shcircCTDP1. The data were presented as mean ± SD (*P<0.05; **P<0.01). Knockdown of circCTDP1 inhibits the progression of NPC cells. (G) Wound healing assay of SUNE2 and 6-10B cell lines transfected with shNC and shcircCTDP1. (H) Cell invasion assay of SUNE2 and 6-10B cell lines transfected with shNC and shcircCTDP1. (I) Xenograft tumor assay shows tumor growth of cells transfected with shNC and shcircCTDP1. (J) Tumor volume throughout the experiment. (K) Statistical analysis of tumor weights. The data were presented as mean ± SD (*P<0.05; **P<0.01).
Figure 1
Figure 1
Knockdown of circCTDP1 inhibits the progression of NPC cells. (A) RT-qPCR analysis shows the relative circCTDP1 expression in NPC tissues and para-carcinoma tissues, n=32. (B) RT-qPCR analysis shows relative circCTDP1 expression in normal nasopharyngeal epithelial cell line (NP69) and NPC cell lines (SUN1, SUNE2 and 6-10B). (C) Kaplan-Meier survival analysis shows correlation between circCTDP1 expression and prognosis of NPC patients. (D) RT-qPCR analysis shows the relative circCTDP1 expression of SUNE2 and 6-10B cell lines transfected with shNC and shcircCTDP1. (E) MTT assay shows the cell growth rate of SUNE2 and 6-10B cell lines transfected with shNC and shcircCTDP1 at different time points of 0, 24, 48, and 72 h. (F) Flow cytometry assay shows the cell apoptosis of SUNE2 and 6-10B cell lines transfected with shNC and shcircCTDP1. The data were presented as mean ± SD (*P<0.05; **P<0.01). Knockdown of circCTDP1 inhibits the progression of NPC cells. (G) Wound healing assay of SUNE2 and 6-10B cell lines transfected with shNC and shcircCTDP1. (H) Cell invasion assay of SUNE2 and 6-10B cell lines transfected with shNC and shcircCTDP1. (I) Xenograft tumor assay shows tumor growth of cells transfected with shNC and shcircCTDP1. (J) Tumor volume throughout the experiment. (K) Statistical analysis of tumor weights. The data were presented as mean ± SD (*P<0.05; **P<0.01).
Figure 2
Figure 2
MiR-320b inhibitor restores the attenuated progression of shcircCTDP1-transfected NPC cell lines. (A) Kaplan-Meier survival analysis shows correlation between miR-320b expression and prognosis of NPC patients. (B) Bioinformatic prediction of binding site of miR-320b by circCTDP1. (C) Dual luciferase reporter assay shows fluorescence intensity in 293T cells transfected with NC, miR-NC+circCTDP1 WT, miR-NC+circCTDP1, MUT miR-320b+circCTDP1 WT and miR-320b+circCTDP1 MUT. (D) RT-qPCR analysis shows the relative miR-320b expression of SUNE2 and 6-10B cell lines transfected with shNC, shcircCTDP1 and shcircCTDP1 plus miR-320b inhibitor. (E) MTT assay shows cell growth rate of SUNE2 and 6-10B cell lines transfected with shNC, shcircCTDP1 and shcircCTDP1 plus miR-320b inhibitor at different time points of 0, 24, 48, and 72 h. (F) Flow cytometry assay shows the relative cell apoptosis rate of SUNE2 and 6-10B cell lines transfected with shNC, shcircCTDP1 and shcircCTDP1 plus miR-320b inhibitor. (G) Wound healing assay of SUNE2 and 6-10B cell lines transfected with shNC, shcircCTDP1 and shcircCTDP1 plus miR-320b inhibitor. (H) Cell invasion assay of SUNE2 and 6-10B cell lines transfected with shNC, shcircCTDP1 and shcircCTDP1 plus miR-320b inhibitor. The data were presented as mean ± SD (*P<0.05; **P<0.01).
Figure 3
Figure 3
MiR-320b directly targets HOXA10 and downregulates its expression. (A) Bioinformatic prediction of binding site of miR-320b by HOXA10. (B) Dual luciferase reporter assay shows luciferase activity in 293T cells transfected with NC, miR-320b mimic, miR-320b inhibitor. (C) RT-qPCR shows miR-320b and HOXA10 expression levels in SUNE2 cell line transfected with NC, miR-320b mimic, miR-320b inhibitor. The data were presented as mean ± SD (*P<0.05; **P<0.01).
Figure 4
Figure 4
CircCTDP1 upregulates the expression of HOXA10 via targeting miR-320b. (A) Kaplan-Meier survival analysis shows correlation between HOXA10 expression and prognosis of NPC patients. (B) RT-qPCR analysis shows relative HOXA10 expression of SUNE2 and 6-10B cell lines (shNC or shHOXA10 and pcDNA3.1 or pcDNA3.1-HOXA10). (C) RT-qPCR analysis shows relative HOXA10 expression of SUNE2 and 6-10B cell lines (NC, shcircCTDP1, shcircCTDP1 plus HOXA10, miR-320b mimic, and miR-320b mimic plus HOXA10). (D) Western blot analysis shows the relative HOXA10 protein level of SUNE2 and CINE1 cell lines (NC, shcircCTDP1, shcircCTDP1 plus HOXA10, miR-320b mimic, and miR-320b mimic plus HOXA10). (E) MTT assay shows the cell growth rate of SUNE2 and 6-10B cell lines (NC, shcircCTDP1, shcircCTDP1 plus HOXA10, miR-320b mimic, and miR-320b mimic plus HOXA10) at different time points of 0, 24, 48, and 72 h. (F) Flow cytometry assay shows the relative cell apoptosis rate of SUNE2 and 6-10B cell lines (NC, shcircCTDP1, shcircCTDP1 plus HOXA10, miR-320b mimic, and miR-320b mimic plus HOXA10). The data were presented as mean ± SD (*P<0.05; **P<0.01). CircCTDP1 upregulates the expression of HOXA10 via targeting miR-320b. (G) Cell invasion assay of SUNE2 and 6-10B cell lines (NC, shcircCTDP1, shcircCTDP1 plus HOXA10, miR-320b mimic, and miR-320b mimic plus HOXA10). (H) Wound healing assay of SUNE2 and 6-10B cell lines (NC, shcircCTDP1, shcircCTDP1 plus HOXA10, miR-320b mimic, and miR-320b mimic plus HOXA10). (I) The circCTDP1 expressions were positively correlated with HOXA10 expressions within included NPC tissues. The miR-320b expressions were negatively correlated with HOXA10 expressions within included NPC tissues. The data were presented as mean ± SD (*P<0.05; **P<0.01).
Figure 4
Figure 4
CircCTDP1 upregulates the expression of HOXA10 via targeting miR-320b. (A) Kaplan-Meier survival analysis shows correlation between HOXA10 expression and prognosis of NPC patients. (B) RT-qPCR analysis shows relative HOXA10 expression of SUNE2 and 6-10B cell lines (shNC or shHOXA10 and pcDNA3.1 or pcDNA3.1-HOXA10). (C) RT-qPCR analysis shows relative HOXA10 expression of SUNE2 and 6-10B cell lines (NC, shcircCTDP1, shcircCTDP1 plus HOXA10, miR-320b mimic, and miR-320b mimic plus HOXA10). (D) Western blot analysis shows the relative HOXA10 protein level of SUNE2 and CINE1 cell lines (NC, shcircCTDP1, shcircCTDP1 plus HOXA10, miR-320b mimic, and miR-320b mimic plus HOXA10). (E) MTT assay shows the cell growth rate of SUNE2 and 6-10B cell lines (NC, shcircCTDP1, shcircCTDP1 plus HOXA10, miR-320b mimic, and miR-320b mimic plus HOXA10) at different time points of 0, 24, 48, and 72 h. (F) Flow cytometry assay shows the relative cell apoptosis rate of SUNE2 and 6-10B cell lines (NC, shcircCTDP1, shcircCTDP1 plus HOXA10, miR-320b mimic, and miR-320b mimic plus HOXA10). The data were presented as mean ± SD (*P<0.05; **P<0.01). CircCTDP1 upregulates the expression of HOXA10 via targeting miR-320b. (G) Cell invasion assay of SUNE2 and 6-10B cell lines (NC, shcircCTDP1, shcircCTDP1 plus HOXA10, miR-320b mimic, and miR-320b mimic plus HOXA10). (H) Wound healing assay of SUNE2 and 6-10B cell lines (NC, shcircCTDP1, shcircCTDP1 plus HOXA10, miR-320b mimic, and miR-320b mimic plus HOXA10). (I) The circCTDP1 expressions were positively correlated with HOXA10 expressions within included NPC tissues. The miR-320b expressions were negatively correlated with HOXA10 expressions within included NPC tissues. The data were presented as mean ± SD (*P<0.05; **P<0.01).
Figure 5
Figure 5
HOXA10 regulates the expression of TGFβ2 in NPC cells. (A) RT-qPCR and western blot analysis shows the expression levels of TGFβ2 in SUNE2 and 6-10B cell lines transfected with shNC and shHOXA10. (B) RT-qPCR and western blot analysis shows the expression levels of TGFβ2 in SUNE2 and 6-10B cell lines transfected with pcDNA3.1 and pcDNA3.1-HOXA10. The data were presented as mean ± SD (*P<0.05).

References

    1. Lee AW, Lin JC, Ng WT. Current management of nasopharyngeal cancer. Semin Radiat Oncol. 2012;22:233–244. doi: 10.1016/j.semradonc.2012.03.008. - DOI - PubMed
    1. Pan F, Ruan Z, Li J, Pang X, Zhang Y, Zou L, Liang H. Radiotherapy combined docetaxel and oxaliplatin chemotherapy is effective in patients with locally advanced nasopharyngeal carcinoma. Med Oncol. 2015;32:252. doi: 10.1007/s12032-015-0698-4. - DOI - PubMed
    1. Colaco RJ, Betts G, Donne A, Swindell R, Yap BK, Sykes AJ, Slevin NJ, Homer JJ, Lee LW. Nasopharyngeal carcinoma: A retrospective review of demographics, treatment and patient outcome in a single centre. Clin Oncol (R Coll Radiol) 2013;25:171–177. doi: 10.1016/j.clon.2012.10.006. - DOI - PubMed
    1. Ma DD, Yuan LL, Lin LQ. LncRNA HOTAIR contributes to the tumorigenesis of nasopharyngeal carcinoma via up-regulating FASN. Eur Rev Med Pharmacol Sci. 2017;21:5143–5152. - PubMed
    1. Zhuang M, Zhao M, Qiu H, Shi D, Wang J, Tian Y, Lin L, Deng W. Effusanin E suppresses nasopharyngeal carcinoma cell growth by inhibiting NF-κB and COX-2 signaling. PLoS One. 2014;9:e109951. doi: 10.1371/journal.pone.0109951. - DOI - PMC - PubMed

MeSH terms