

Different FDG-PET metabolic patterns of anti-AMPAR and anti-NMDAR encephalitis: Case report and literature review
- PMID: 31985135
- PMCID: PMC7066351
- DOI: 10.1002/brb3.1540
Different FDG-PET metabolic patterns of anti-AMPAR and anti-NMDAR encephalitis: Case report and literature review
Abstract
Introduction: 18 F-fluorodeoxyglucose (FDG)-PET metabolic patterns of brain differ among autoimmune encephalitis with different neuronal surface antigens. In this case report, we compared the topographical relationship of cerebral glucose metabolism and antigen distribution in the patients with anti-NMDAR and anti-AMPAR encephalitis. Literature review summarized the common features of brain metabolism of autoimmune encephalitis.
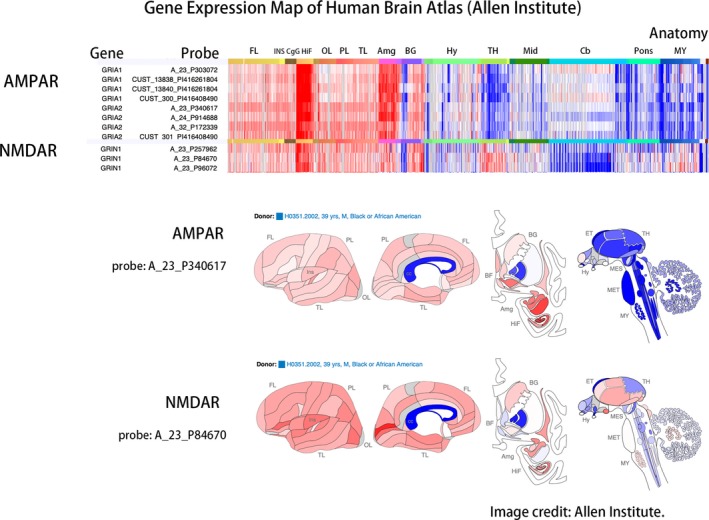
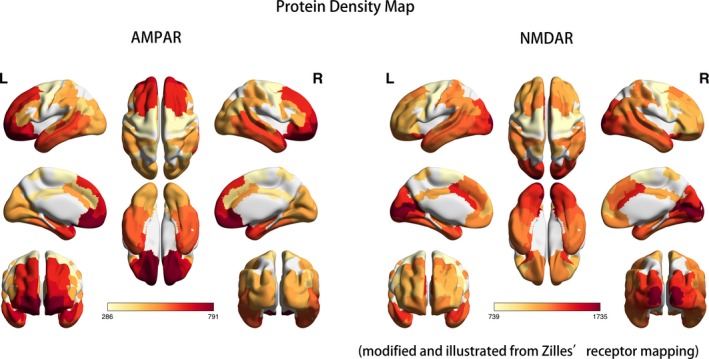
Methods: The cerebral glucose metabolism was evaluated by FDG-PET/CT during acute-to-subacute stage of autoimmune encephalitis and after treatment. The stereo and quantitative analysis of cerebral metabolism used standardized z-score and visualized on three-dimensional stereotactic surface projection. To map NMDAR and AMPAR in human brain, we adopted genetic atlases from the Allen Institute and protein atlases from Zilles's receptor densities.
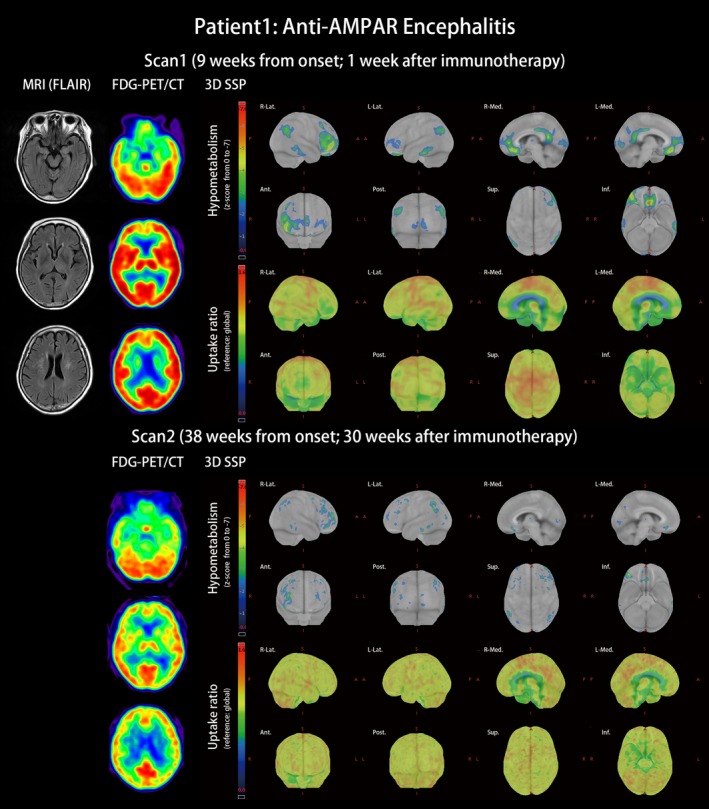
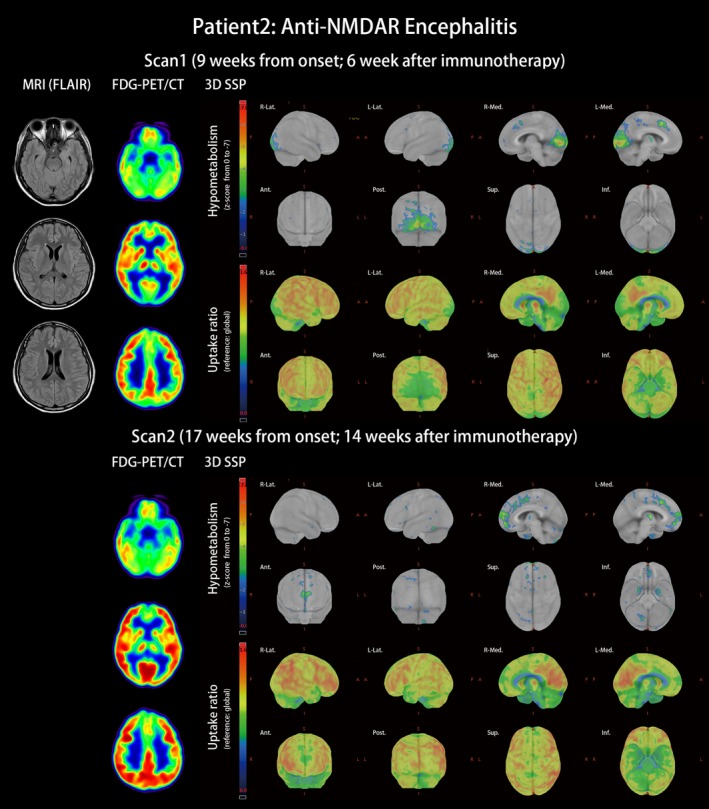
Results: The three-dimensional stereotactic surface projection displayed frontal-dominant hypometabolism in a 66-year-old female patient with anti-AMPAR encephalitis and occipital-dominant hypometabolism in a 29-year-old female patient with anti-NMDAR encephalitis. Receptor density maps revealed opposite frontal-occipital gradients of AMPAR and NMDAR, which reflect reduced metabolism in the correspondent encephalitis. FDG-PET hypometabolic areas possibly represent receptor hypofunction with spatial correspondence to receptor distributions of the autoimmune encephalitis. The reversibility of hypometabolism was in line with patients' cognitive improvement. The literature review summarized six features of metabolic anomalies of autoimmune encephalitis: (a) temporal hypermetabolism, (b) frontal hypermetabolism and (c) occipital hypometabolism in anti-NMDAR encephalitis, (d) hypometabolism in association cortices, (e) sparing of unimodal primary motor cortex, and (e) reversibility in recovery.
Conclusions: The distinct cerebral hypometabolic patterns of autoimmune encephalitis were representative for receptor hypofunction and topographical distribution of antigenic receptors. The reversibility of hypometabolism marked the clinical recovery of autoimmune encephalitis and made FDG-PET of brain a valuable diagnostic tool.
Keywords: FDG-PET; autoimmune encephalitis; hypermetabolism; hypometabolism; receptor density map.
© 2020 The Authors. Brain and Behavior published by Wiley Periodicals, Inc.
Conflict of interest statement
All authors report no conflicts of interest.
Figures
Similar articles
-
Cerebral (18)FluoroDeoxy-Glucose Positron Emission Tomography in paediatric anti N-methyl-D-aspartate receptor encephalitis: A case series.Brain Dev. 2016 May;38(5):461-70. doi: 10.1016/j.braindev.2015.10.013. Epub 2015 Nov 2. Brain Dev. 2016. PMID: 26542469
-
Typical metabolic pattern of 18F-FDG PET in Anti-NMDAR encephalitis in the acute and subacute phases and its correlation with T2 FLAIR-MRI features.BMC Neurosci. 2023 Sep 25;24(1):51. doi: 10.1186/s12868-023-00823-2. BMC Neurosci. 2023. PMID: 37749547 Free PMC article.
-
Subcortical Hypermetabolism Associated With Cortical Hypometabolism Is a Common Metabolic Pattern in Patients With Anti-Leucine-Rich Glioma-Inactivated 1 Antibody Encephalitis.Front Immunol. 2021 Sep 20;12:672846. doi: 10.3389/fimmu.2021.672846. eCollection 2021. Front Immunol. 2021. PMID: 34616389 Free PMC article.
-
Regional Metabolic Abnormalities in Autoimmune Encephalitis: A Meta-analysis of 498 Cases With Brain FDG PET.Clin Nucl Med. 2025 Mar 1;50(3):208-213. doi: 10.1097/RLU.0000000000005574. Epub 2024 Nov 27. Clin Nucl Med. 2025. PMID: 39601059
-
Autoimmune cerebellar hypermetabolism: Report of three cases and literature overview.Rev Neurol (Paris). 2022 Apr;178(4):337-346. doi: 10.1016/j.neurol.2021.07.018. Epub 2021 Oct 14. Rev Neurol (Paris). 2022. PMID: 34657731 Review.
Cited by
-
Psychiatric Illness or Immune Dysfunction-Brain Perfusion Imaging Providing the Answer in a Case of Anti-NMDAR Encephalitis.Diagnostics (Basel). 2022 Sep 30;12(10):2377. doi: 10.3390/diagnostics12102377. Diagnostics (Basel). 2022. PMID: 36292066 Free PMC article.
-
Functional connectivity changes of the hippocampal subregions in anti-N-methyl-D-aspartate receptor encephalitis.Brain Imaging Behav. 2024 Jun;18(3):686-697. doi: 10.1007/s11682-024-00852-3. Epub 2024 Feb 16. Brain Imaging Behav. 2024. PMID: 38363500
-
Anti-alpha-amino-3-hydroxy-5-methyl-4-isoxazolepropionic acid receptor encephalitis presenting as catatonia.BMC Psychiatry. 2025 Jul 17;25(1):712. doi: 10.1186/s12888-025-07185-5. BMC Psychiatry. 2025. PMID: 40676616 Free PMC article.
-
Neurovascular Uncoupling in Schizophrenia: A Bimodal Meta-Analysis of Brain Perfusion and Glucose Metabolism.Front Psychiatry. 2020 Aug 5;11:754. doi: 10.3389/fpsyt.2020.00754. eCollection 2020. Front Psychiatry. 2020. PMID: 32848931 Free PMC article.
-
FDG-PET in Autoimmune Encephalitis: Utility, Pattern of Abnormalities, and Correlation with Autoantibodies.Ann Indian Acad Neurol. 2022 Nov-Dec;25(6):1122-1129. doi: 10.4103/aian.aian_645_22. Epub 2022 Dec 3. Ann Indian Acad Neurol. 2022. PMID: 36911487 Free PMC article.
References
-
- Bauer, J. , & Bien, C. G. (2016). Chapter 7 ‐ Neuropathology of autoimmune encephalitides In Pittock S. J., & Vincent A. (Eds.), Handbook of clinical neurology (Vol. 133; pp. 107–120). Amsterdam, The Netherlands: Elsevier. - PubMed
Publication types
MeSH terms
Substances
Supplementary concepts
Grants and funding
LinkOut - more resources
Full Text Sources
Medical
